Estimated zip code population in 2022: 3,678 Zip code population in 2010: 3,912 Zip code population in 2000: 4,174
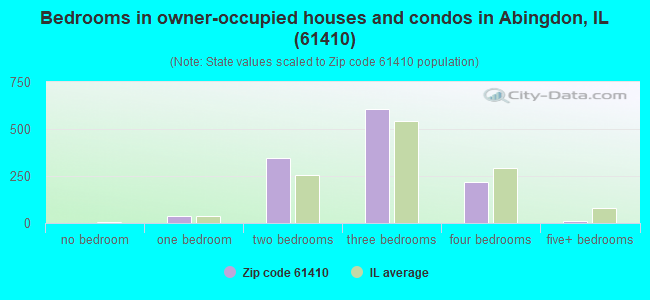
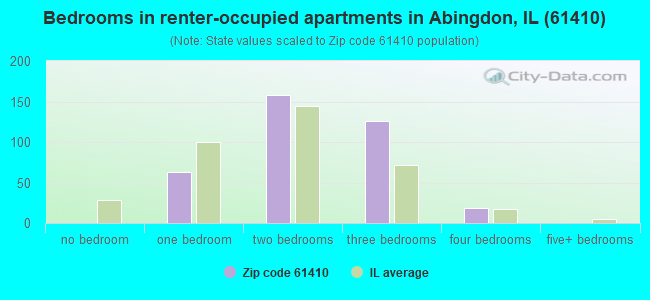
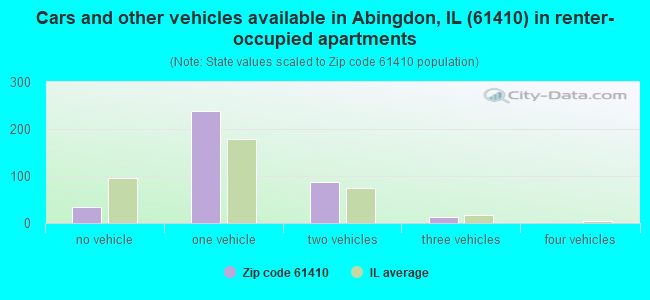
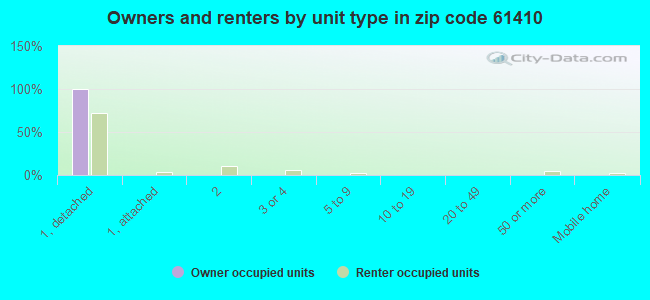
Houses and condos: 1,701 Renter-occupied apartments: 373
% of renters here:
23%
State:
33%
March 2022 cost of living index in zip code 61410: 73.8 (low, U.S. average is 100)
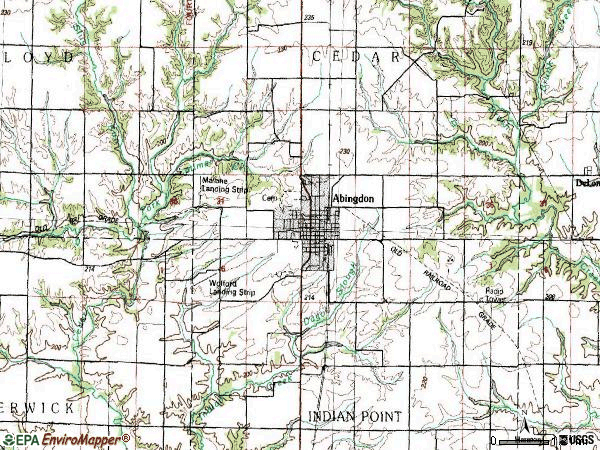
Land area: 41.2 sq. mi. Water area: 0.0 sq. mi.
Population density: 89 people per square mile
(very low).
OSM Map
General Map
Google Map
MSN Map
OSM Map
General Map
Google Map
MSN Map
OSM Map
General Map
Google Map
MSN Map
OSM Map
General Map
Google Map
MSN Map
Please wait while loading the map...
Real estate property taxes paid for housing units in 2022:
This zip code:
1.7% ($1,419)
Illinois:
2.0% ($4,912)
Median real estate property taxes paid for housing units with mortgages in 2022: $1,774 (1.8%) Median real estate property taxes paid for housing units with no mortgage in 2022: $1,138 (1.7%)
Averages for the 2020 tax year for zip code 61410, filed in 2021:
Average Adjusted Gross Income (AGI) in 2020: $51,368 (Individual Income Tax Returns)
Here:
$51,368
State:
$82,626
Salary/wage: $44,716 (reported on 84.7% of returns)
Here:
$44,716
State:
$66,640
(% of AGI for various income ranges: 1136.5% for AGIs below $25k, 3250.5% for AGIs $25k-50k, 6014.8% for AGIs $50k-75k, 8996.9% for AGIs $75k-100k, 14621.3% for AGIs $100k-200k)
Taxable interest for individuals: $725 (reported on 31.2% of returns)
This zip code:
$725
Illinois:
$2,376
(% of AGI for various income ranges: 17.3% for AGIs below $25k, 18.7% for AGIs $25k-50k, 45.7% for AGIs $50k-75k, 23.1% for AGIs $75k-100k, 68.0% for AGIs $100k-200k)
Ordinary dividends: $1,763 (reported on 11.2% of returns)
Here:
$1,763
State:
$9,061
(% of AGI for various income ranges: 8.8% for AGIs below $25k, 9.5% for AGIs $25k-50k, 43.8% for AGIs $50k-75k, 39.2% for AGIs $75k-100k, 75.3% for AGIs $100k-200k)
Net capital gain/loss in AGI: +$5,231 (reported on 9.4% of returns)
Here:
+$5,231
State:
+$31,684
(% of AGI for various income ranges: 6.0% for AGIs below $25k, 12.6% for AGIs $25k-50k, 21.4% for AGIs $50k-75k, 95.4% for AGIs $75k-100k, 393.3% for AGIs $100k-200k)
Profit/loss from business: +$6,947 (reported on 8.8% of returns)
Here:
+$6,947
State:
+$12,175
(% of AGI for various income ranges: 59.8% for AGIs below $25k, 55.9% for AGIs $25k-50k, 48.6% for AGIs $50k-75k, 290.0% for AGIs $100k-200k)
Taxable individual retirement arrangement distribution: $10,027 (reported on 8.8% of returns)
61410:
$10,027
Illinois:
$21,613
(% of AGI for various income ranges: 36.2% for AGIs below $25k, 43.8% for AGIs $25k-50k, 100.5% for AGIs $50k-75k, 228.5% for AGIs $75k-100k, 434.0% for AGIs $100k-200k)
Earned income credit: $2,484 (reported on 18.2% of returns)
Here:
$2,484
State:
$2,311
(% of AGI for various income ranges: 105.0% for AGIs below $25k, 68.2% for AGIs $25k-50k)
Percentage of individuals using paid preparers for their 2020 taxes: 97.1%
Here:
97%
State:
93%
(% for various income ranges: 96.6% for AGIs below $25k, 97.8% for AGIs $25k-50k, 96.3% for AGIs $50k-75k, 100.0% for AGIs $75k-100k, 95.5% for AGIs $100k-200k)
Averages for the 2012 tax year for zip code 61410, filed in 2013:
Average Adjusted Gross Income (AGI) in 2012: $40,210 (Individual Income Tax Returns)
Here:
$40,210
State:
$68,058
Salary/wage: $35,533 (reported on 84.1% of returns)
Here:
$35,533
State:
$55,396
(% of AGI for various income ranges: 70.6% for AGIs below $25k, 78.5% for AGIs $25k-50k, 79.6% for AGIs $50k-75k, 85.4% for AGIs $75k-100k, 58.6% for AGIs $100k-200k)
Taxable interest for individuals: $493 (reported on 33.5% of returns)
This zip code:
$493
Illinois:
$1,969
(% of AGI for various income ranges: 1.0% for AGIs below $25k, 0.5% for AGIs $25k-50k, 0.2% for AGIs $50k-75k, 0.2% for AGIs $75k-100k, 0.3% for AGIs $100k-200k)
Ordinary dividends: $1,257 (reported on 11.9% of returns)
Here:
$1,257
State:
$7,786
(% of AGI for various income ranges: 0.5% for AGIs below $25k, 0.3% for AGIs $25k-50k, 0.3% for AGIs $50k-75k, 0.6% for AGIs $75k-100k, 0.2% for AGIs $100k-200k)
Net capital gain/loss in AGI: +$5,164 (reported on 8.0% of returns)
Here:
+$5,164
State:
+$22,183
(% of AGI for various income ranges: 0.5% for AGIs $25k-50k, 0.5% for AGIs $75k-100k, 3.7% for AGIs $100k-200k)
Profit/loss from business: +$4,959 (reported on 9.7% of returns)
Here:
+$4,959
State:
+$12,903
(% of AGI for various income ranges: 2.9% for AGIs below $25k, 1.2% for AGIs $25k-50k, 1.5% for AGIs $50k-75k, 0.9% for AGIs $75k-100k)
Taxable individual retirement arrangement distribution: $5,780 (reported on 8.5% of returns)
61410:
$5,780
Illinois:
$17,929
(% of AGI for various income ranges: 2.4% for AGIs below $25k, 1.8% for AGIs $25k-50k, 2.2% for AGIs $50k-75k)
Total itemized deductions: $17,929 (20% of AGI, reported on 13.6% of returns)
Here:
$17,929
State:
$26,433
Here:
20.3% of AGI
State:
19.2% of AGI
(% of AGI for various income ranges: 3.8% for AGIs below $25k, 3.2% for AGIs $25k-50k, 6.9% for AGIs $50k-75k, 6.6% for AGIs $75k-100k, 9.2% for AGIs $100k-200k)
Charity contributions: $2,631 (reported on 7.4% of returns)
Here:
$2,631
State:
$4,525
(% of AGI for various income ranges: 0.6% for AGIs below $25k, 0.5% for AGIs $50k-75k, 0.3% for AGIs $75k-100k, 1.0% for AGIs $100k-200k)
Taxes paid: $6,133 (reported on 13.6% of returns)
61410:
$6,133
State:
$11,968
(% of AGI for various income ranges: 0.6% for AGIs below $25k, 0.8% for AGIs $25k-50k, 2.0% for AGIs $50k-75k, 2.6% for AGIs $75k-100k, 4.0% for AGIs $100k-200k)
Earned income credit: $2,292 (reported on 21.0% of returns)
Here:
$2,292
State:
$2,349
(% of AGI for various income ranges: 6.6% for AGIs below $25k, 1.1% for AGIs $25k-50k)
Percentage of individuals using paid preparers for their 2012 taxes: 61.9%
Here:
62%
State:
57%
(% for various income ranges: 56.8% for AGIs below $25k, 62.2% for AGIs $25k-50k, 69.6% for AGIs $50k-75k, 68.8% for AGIs $75k-100k, 72.7% for AGIs $100k-200k)
Averages for the 2004 tax year for zip code 61410, filed in 2005:
Average Adjusted Gross Income (AGI) in 2004: $31,975 (Individual Income Tax Returns)
Here:
$31,975
State:
$54,625
Salary/wage: $30,039 (reported on 82.6% of returns)
Here:
$30,039
State:
$46,811
(% of AGI for various income ranges: 131.0% for AGIs below $10k, 63.0% for AGIs $10k-25k, 80.0% for AGIs $25k-50k, 80.0% for AGIs $50k-75k, 83.0% for AGIs $75k-100k, 68.5% for AGIs over 100k)
Taxable interest for individuals: $1,196 (reported on 41.2% of returns)
This zip code:
$1,196
Illinois:
$2,101
(% of AGI for various income ranges: 10.0% for AGIs below $10k, 3.5% for AGIs $10k-25k, 1.0% for AGIs $25k-50k, 1.2% for AGIs $50k-75k, 0.8% for AGIs $75k-100k, 0.5% for AGIs over 100k)
Taxable dividends: $830 (reported on 16.7% of returns)
Here:
$830
State:
$4,306
(% of AGI for various income ranges: 1.6% for AGIs below $10k, 0.7% for AGIs $10k-25k, 0.3% for AGIs $25k-50k, 0.3% for AGIs $50k-75k, 0.3% for AGIs $75k-100k, 0.6% for AGIs over 100k)
Net capital gain/loss: +$404 (reported on 10.1% of returns)
Here:
+$404
State:
+$17,321
(% of AGI for various income ranges: -0.1% for AGIs below $10k, 0.0% for AGIs $10k-25k, 0.0% for AGIs $25k-50k, 0.3% for AGIs $50k-75k, 0.1% for AGIs $75k-100k, 0.2% for AGIs over 100k)
Profit/loss from business: +$5,942 (reported on 10.9% of returns)
Here:
+$5,942
State:
+$11,771
(% of AGI for various income ranges: 14.3% for AGIs below $10k, 3.6% for AGIs $10k-25k, 1.6% for AGIs $25k-50k, 1.9% for AGIs $50k-75k, 1.3% for AGIs $75k-100k)
IRA payment deduction: $3,733 (reported on 1.7% of returns)
61410:
$3,733
Illinois:
$3,087
Total itemized deductions: $13,843 (23% of AGI, reported on 13.0% of returns)
Here:
$13,843
State:
$20,239
Here:
23.4% of AGI
State:
19.5% of AGI
(% of AGI for various income ranges: 13.8% for AGIs below $10k, 3.1% for AGIs $10k-25k, 4.3% for AGIs $25k-50k, 5.8% for AGIs $50k-75k, 7.8% for AGIs $75k-100k, 8.4% for AGIs over 100k)
Charity contributions deductions: $2,079 (3% of AGI, reported on 9.3% of returns)
Here:
$2,079
State:
$3,719
Here:
3.3% of AGI
State:
3.4% of AGI
(% of AGI for various income ranges: 0.3% for AGIs $10k-25k, 0.5% for AGIs $25k-50k, 0.6% for AGIs $50k-75k, 0.7% for AGIs $75k-100k, 1.3% for AGIs over 100k)
Total tax: $3,635 (reported on 72.5% of returns)
61410:
$3,635
State:
$9,882
(% of AGI for various income ranges: 3.7% for AGIs below $10k, 3.8% for AGIs $10k-25k, 6.3% for AGIs $25k-50k, 8.5% for AGIs $50k-75k, 11.2% for AGIs $75k-100k, 16.1% for AGIs over 100k)
Earned income credit: $1,596 (reported on 18.1% of returns)
Here:
$1,596
State:
$1,788
Percentage of individuals using paid preparers for their 2004 taxes: 61.0%
Here:
61%
State:
61%
(% for various income ranges: 49.4% for AGIs below $10k, 61.1% for AGIs $10k-25k, 63.5% for AGIs $25k-50k, 68.5% for AGIs $50k-75k, 67.1% for AGIs $75k-100k, 81.6% for AGIs over 100k)
Household received Food Stamps/SNAP in the past 12 months: 363 Household did not receive Food Stamps/SNAP in the past 12 months: 1,245
Women who had a birth in the past 12 months: 19 (19 now married, 0 unmarried) Women who did not have a birth in the past 12 months: 727 (244 now married, 484 unmarried)
Housing units in zip code 61410 with a mortgage: 666 (7 second mortgage, 8 both second mortgage and home equity loan) Houses without a mortgage: 21
Median monthly owner costs for units with a mortgage: $879 Median monthly owner costs for units without a mortgage: $422
Residents with income below the poverty level in 2022:
This zip code:
16.9%
Whole state:
11.9%
Residents with income below 50% of the poverty level in 2022:
This zip code:
9.6%
Whole state:
5.7%
Median number of rooms in houses and condos:
Here:
6.3
State:
6.4
Median number of rooms in apartments:
Here:
4.6
State:
4.1
Notable locations in this zip code not listed on our city pages
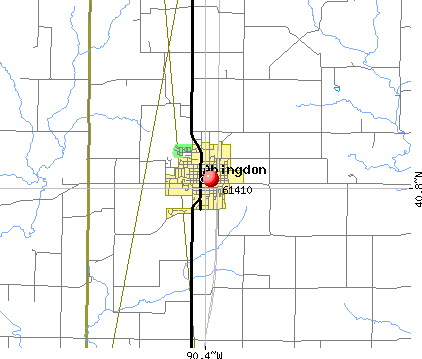
Notable locations in zip code 61410: Abingdon Water Works (A), Abingdon Fire Protection District Station 1 (B), John Mosser Public Library (C), Abingdon City Hall (D). Display/hide their locations on the map
Churches in zip code 61410 include: All Souls Roman Catholic Church (A), First Christian Church (B), First Church of the Nazarene (C), First Congregational Church (D), First Methodist Church (E), Sacred Hearth Catholic Church (F). Display/hide their locations on the map
In group quarters: 46 (-1 institutionalized population)
Size of family households: 415 2-persons, 249 3-persons, 175 4-persons, 32 5-persons, 29 6-persons
Size of nonfamily households: 606 1-person, 78 2-persons, 11 3-persons
338 married couples with children.
608 single-parent households (88 men, 520 women).
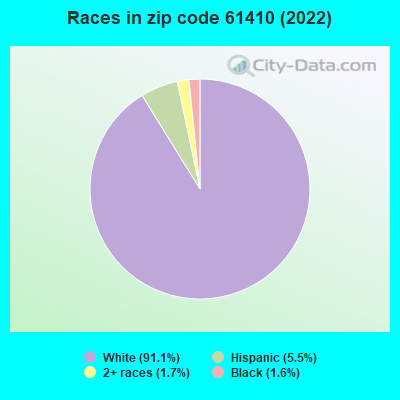
99.0% of residents of 61410 zip code speak English at home.
0.3% of residents speak Spanish at home (100% very well).
0.1% of residents speak Asian or Pacific Island language at home (100% very well).
Foreign born population: 0 (0.0%)
:
0.0%
Whole state:
14.4%
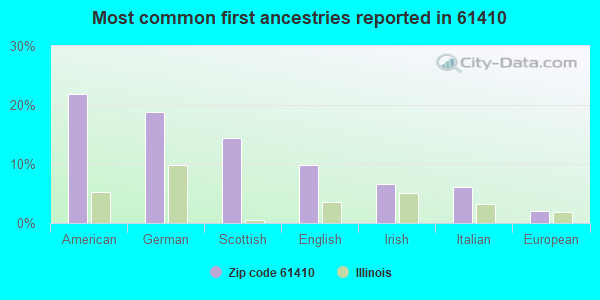
22%American
19%German
14%Scottish
10%English
7%Irish
6%Italian
2%European
Facilities with environmental interests located in this zip code:
ILLINI FEEDS INC (402 N FRONT ST in ABINGDON, IL)
STATE MASTER (Illinois EPA Project) - AIR PROGRAM AIR MINOR (AIRS/AFS) CRITERIA AND HAZARDOUS AIR POLLUTANT INVENTORY (Inventory of air pollution sources) Business SIC classification: GRAIN AND FIELD BEANS Alternative names: GRAINSTORE ELEVATORS
ABINGDON STP (SOUTHEAST OF CITY in ABINGDON, IL)
STATE MASTER (Illinois EPA Project) - National Pollutant Discharge Elimination System Permit National Pollutant Discharge Elimination System NON-MAJOR (Tracking pollutant discharge elimination systems) - permit National Pollutant Discharge Elimination System NON-MAJOR (Tracking pollutant discharge elimination systems) - permit Business SIC classification: SEWERAGE SYSTEMS Alternative names: ABINGDON, CITY OF, ABINGDON STP, CITY OF
ABINGDON MILLING & CATTLE FEEDING CO (SOUTH FRONT ST in ABINGDON, IL)
STATE MASTER (Illinois EPA Project) - AIR PROGRAM AIR MINOR (AIRS/AFS) Business SIC classification: PREPARED FEEDS AND FEED INGREDIENTS FOR ANIMALS AND FOWLS, EXCEPT DOGS AND CATS
KISLER BROS. INC (503 COMMERCIAL DR. in ABINGDON, IL)
STATE MASTER (Illinois EPA Project) - AIR PROGRAM AIR MINOR (AIRS/AFS) Business SIC classification: NONCLASSIFIABLE ESTABLISHMENTS
ABINGDON HIGH SCHOOL (600 W MARTIN ST in ABINGDON, IL)
(Geographic Names Information System) (National Center for Education Statistics) - STATE ID-3304821700001 Organizations: ABINGDON C U SCHOOL DIST 217 (SCHOOL DISTRICT)
HEDDING GRADE SCHOOL (401 W LATIMER ST in ABINGDON, IL)
(Geographic Names Information System) (National Center for Education Statistics) - STATE ID-3304821702003 Organizations: ABINGDON C U SCHOOL DIST 217 (SCHOOL DISTRICT)
ABINGDON MIDDLE SCHOOL (202 W SNYDER ST in ABINGDON, IL)
(National Center for Education Statistics) - STATE ID-3304821701002 Organizations: ABINGDON C U SCHOOL DIST 217 (SCHOOL DISTRICT)
ABINGDON HIGH SCHOOL-DISTRICT 217 (600 WEST MARTIN STREET in ABINGDON, IL)
AIR MINOR (AIRS/AFS) CRITERIA AND HAZARDOUS AIR POLLUTANT INVENTORY (Inventory of air pollution sources) Business SIC and NAICS classification: ELEMENTARY AND SECONDARY SCHOOLS
CLINE SOIL SERVICE (506 MAPLE ST in ABINGDON, IL)
COMPLIANCE ACTIVITY (Tracking inspections of insecticide, fungicide, and rodenticide, and toxic substances)
Housing units lacking complete plumbing facilities: 3.4% Housing units lacking complete kitchen facilities: 6.9%
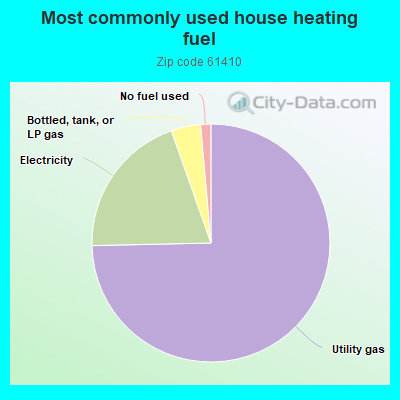
74.8%Utility gas
20.0%Electricity
4.0%Bottled, tank, or LP gas
1.4%No fuel used
Population in 1990: 4,241.
Place of birth for U.S.-born residents:
This state: 3,119
Northeast: 31
Midwest: 268
South: 194
West: 44
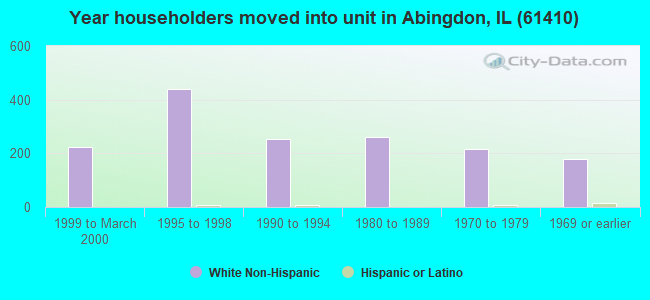
58% of the 61410 zip code residents lived in the same house 5 years ago. Out of people who lived in different houses, 66% lived in this county. Out of people who lived in different counties, 50% lived in Illinois.
96% of the 61410 zip code residents lived in the same house 1 year ago. Out of people who lived in different houses, 63% moved from this county. Out of people who lived in different houses, 36% moved from different county within same state.
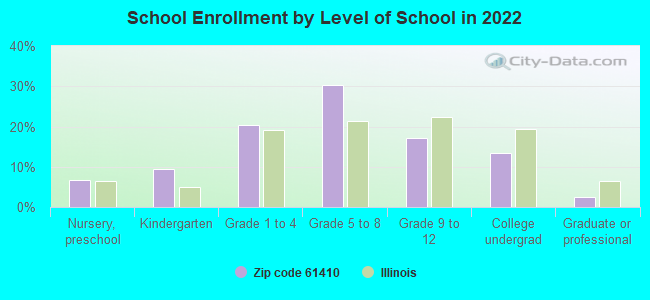
Private vs. public school enrollment:
Students in private schools in grades 1 to 8 (elementary and middle school): 21
Here:
4.8%
Illinois:
13.3%
Students in private schools in grades 9 to 12 (high school):
Here:
0.0%
Illinois:
9.9%
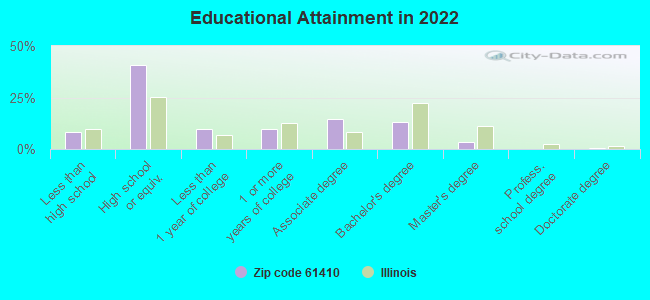
Students in private undergraduate colleges: 15
Here:
12.8%
Illinois:
27.4%
Occupation by median earnings in the past 12 months ($)
67,771Health diagnosing and treating practitioners and other technical occupations
58,132Production occupations
58,052Installation, maintenance, and repair occupations
55,127Building and grounds cleaning and maintenance occupations
45,955Management occupations
43,278Sales and related occupations
Top industries in this zip code by the number of employees in 2005:
Accommodation and Food Services: Full-Service Restaurants (10-19: 1, 1-4: 2)
Finance and Insurance: Insurance Agencies and Brokerages (5-9: 2, 1-4: 1)
Administrative and Support and Waste Management and Remediation Services: Solid Waste Collection (10-19: 1)
Finance and Insurance: Commercial Banking (10-19: 1)
Other Services (except Public Administration): Religious Organizations (5-9: 1, 1-4: 3)
People in group quarters in 2010:
70 people in nursing facilities/skilled-nursing facilities
People in group quarters in 2000:
60 people in nursing homes
Fatal accident statistics in 2014:
Fatal accident count: 1
Vehicles involved in fatal accidents: 2
Fatal accidents caused by drunken drivers: 0
Fatalities: 1
Persons involved in fatal accidents: 3
Pedestrians involved in fatal accidents: 0
2002 - 2018 National Fire Incident Reporting System (NFIRS) incidents
According to the data from the years 2002 - 2018 the average number of fire incidents per year is 25. The highest number of reported fires - 42 took place in 2006, and the least - 12 in 2016. The data has a dropping trend.
When looking into fire subcategories, the most reports belonged to: Outside Fires (62.6%), and Structure Fires (21.2%).
Fire incident types reported to NFIRS in Zip Code 61410


 Nearest zip codes: 61474, 61423, 61417, 61415, 61401, 61430.


 According to the data from the years 2002 - 2018 the average number of fire incidents per year is 25. The highest number of reported fires - 42 took place in 2006, and the least - 12 in 2016. The data has a dropping trend.
 When looking into fire subcategories, the most reports belonged to: Outside Fires (62.6%), and Structure Fires (21.2%).