Estimated zip code population in 2022: 4,449 Zip code population in 2010: 4,484 Zip code population in 2000: 3,121
Houses and condos: 1,765 Renter-occupied apartments: 183
% of renters here:
10%
State:
33%
March 2022 cost of living index in zip code 62285: 94.3 (less than average, U.S. average is 100)
Land area: 16.4 sq. mi. Water area: 0.4 sq. mi.
Population density: 272 people per square mile
(very low).
OSM Map
General Map
Google Map
MSN Map
OSM Map
General Map
Google Map
MSN Map
OSM Map
General Map
Google Map
MSN Map
OSM Map
General Map
Google Map
MSN Map
Please wait while loading the map...
Real estate property taxes paid for housing units in 2022:
This zip code:
2.1% ($5,554)
Illinois:
2.0% ($4,912)
Median real estate property taxes paid for housing units with mortgages in 2022: $5,980 (2.1%) Median real estate property taxes paid for housing units with no mortgage in 2022: $3,837 (2.1%)
Estimated median house/condo value in 2022: $259,703
62285:
$259,703
Illinois:
$251,600
According to our research of Illinois and other state lists, there were 2 registered sex offenders living in 62285 zip code as of May 08, 2024. The ratio of all residents to sex offenders in zip code 62285 is 2,239 to 1. The ratio of registered sex offenders to all residents in this zip code is much lower than the state average.
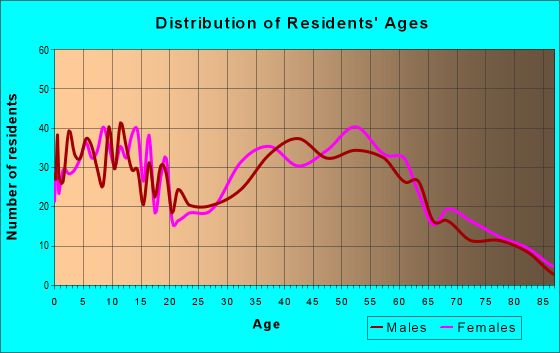
Median resident age:
This zip code:
44.5 years
Illinois median age:
39.1 years
Average household size:
This zip code:
2.5 people
Illinois:
2.4 people
Averages for the 2020 tax year for zip code 62285, filed in 2021:
Average Adjusted Gross Income (AGI) in 2020: $101,215 (Individual Income Tax Returns)
Here:
$101,215
State:
$82,626
Salary/wage: $77,926 (reported on 79.7% of returns)
Here:
$77,926
State:
$66,640
(% of AGI for various income ranges: 1140.0% for AGIs below $25k, 3231.6% for AGIs $25k-50k, 6047.1% for AGIs $50k-75k, 8378.3% for AGIs $75k-100k, 16974.9% for AGIs $100k-200k, 50164.3% for AGIs over 200k)
Taxable interest for individuals: $1,280 (reported on 47.0% of returns)
This zip code:
$1,280
Illinois:
$2,376
(% of AGI for various income ranges: 26.9% for AGIs below $25k, 36.1% for AGIs $25k-50k, 74.3% for AGIs $50k-75k, 93.3% for AGIs $75k-100k, 110.2% for AGIs $100k-200k, 627.1% for AGIs over 200k)
Ordinary dividends: $4,646 (reported on 30.5% of returns)
Here:
$4,646
State:
$9,061
(% of AGI for various income ranges: 44.3% for AGIs below $25k, 79.4% for AGIs $25k-50k, 110.0% for AGIs $50k-75k, 158.3% for AGIs $75k-100k, 185.4% for AGIs $100k-200k, 2382.9% for AGIs over 200k)
Net capital gain/loss in AGI: +$14,939 (reported on 25.8% of returns)
Here:
+$14,939
State:
+$31,684
(% of AGI for various income ranges: 33.1% for AGIs below $25k, 69.4% for AGIs $25k-50k, 72.9% for AGIs $50k-75k, 193.3% for AGIs $75k-100k, 283.9% for AGIs $100k-200k, 10167.1% for AGIs over 200k)
Profit/loss from business: +$12,819 (reported on 13.6% of returns)
Here:
+$12,819
State:
+$12,175
(% of AGI for various income ranges: 38.3% for AGIs below $25k, 123.5% for AGIs $25k-50k, 196.7% for AGIs $50k-75k, 335.6% for AGIs $75k-100k, 500.2% for AGIs $100k-200k, 738.6% for AGIs over 200k)
Taxable individual retirement arrangement distribution: $18,342 (reported on 14.0% of returns)
62285:
$18,342
Illinois:
$21,613
(% of AGI for various income ranges: 86.3% for AGIs below $25k, 130.6% for AGIs $25k-50k, 375.7% for AGIs $50k-75k, 390.6% for AGIs $75k-100k, 613.4% for AGIs $100k-200k, 1912.9% for AGIs over 200k)
Total itemized deductions: $31,038 (reported on 6.8% of returns)
Here:
$31,038
State:
$34,948
(% of AGI for various income ranges: 519.0% for AGIs $50k-75k, 448.3% for AGIs $75k-100k, 314.9% for AGIs $100k-200k, 2540.0% for AGIs over 200k)
Charity contributions: $9,409 (reported on 4.7% of returns)
Here:
$9,409
State:
$13,122
(% of AGI for various income ranges: 26.7% for AGIs $50k-75k, 58.0% for AGIs $100k-200k, 1058.6% for AGIs over 200k)
Taxes paid: $8,894 (reported on 6.8% of returns)
62285:
$8,894
State:
$8,563
(% of AGI for various income ranges: 146.7% for AGIs $50k-75k, 182.8% for AGIs $75k-100k, 113.4% for AGIs $100k-200k, 458.6% for AGIs over 200k)
Earned income credit: $2,107 (reported on 6.4% of returns)
Here:
$2,107
State:
$2,311
(% of AGI for various income ranges: 54.0% for AGIs below $25k, 41.0% for AGIs $25k-50k)
Percentage of individuals using paid preparers for their 2020 taxes: 93.2%
Here:
93%
State:
93%
(% for various income ranges: 89.5% for AGIs below $25k, 92.7% for AGIs $25k-50k, 93.5% for AGIs $50k-75k, 96.2% for AGIs $75k-100k, 95.3% for AGIs $100k-200k, 94.1% for AGIs over 200k)
Averages for the 2012 tax year for zip code 62285, filed in 2013:
Average Adjusted Gross Income (AGI) in 2012: $78,073 (Individual Income Tax Returns)
Here:
$78,073
State:
$68,058
Salary/wage: $63,549 (reported on 83.9% of returns)
Here:
$63,549
State:
$55,396
(% of AGI for various income ranges: 68.1% for AGIs below $25k, 72.7% for AGIs $25k-50k, 71.9% for AGIs $50k-75k, 77.7% for AGIs $75k-100k, 82.9% for AGIs $100k-200k, 37.7% for AGIs over 200k)
Taxable interest for individuals: $1,171 (reported on 51.2% of returns)
This zip code:
$1,171
Illinois:
$1,969
(% of AGI for various income ranges: 2.3% for AGIs below $25k, 1.1% for AGIs $25k-50k, 1.4% for AGIs $50k-75k, 0.5% for AGIs $75k-100k, 0.4% for AGIs $100k-200k, 0.9% for AGIs over 200k)
Ordinary dividends: $3,079 (reported on 32.2% of returns)
Here:
$3,079
State:
$7,786
(% of AGI for various income ranges: 2.4% for AGIs below $25k, 1.8% for AGIs $25k-50k, 1.2% for AGIs $50k-75k, 0.9% for AGIs $75k-100k, 1.1% for AGIs $100k-200k, 1.5% for AGIs over 200k)
Net capital gain/loss in AGI: +$1,975 (reported on 20.9% of returns)
Here:
+$1,975
State:
+$22,183
(% of AGI for various income ranges: 0.2% for AGIs below $25k, 0.1% for AGIs $75k-100k, 0.8% for AGIs $100k-200k, 0.8% for AGIs over 200k)
Profit/loss from business: +$9,604 (reported on 10.9% of returns)
Here:
+$9,604
State:
+$12,903
(% of AGI for various income ranges: 2.7% for AGIs below $25k, 2.0% for AGIs $25k-50k, 1.7% for AGIs $50k-75k, 1.6% for AGIs $75k-100k, 1.7% for AGIs $100k-200k)
Taxable individual retirement arrangement distribution: $9,985 (reported on 12.8% of returns)
62285:
$9,985
Illinois:
$17,929
(% of AGI for various income ranges: 5.1% for AGIs below $25k, 2.7% for AGIs $25k-50k, 2.1% for AGIs $50k-75k, 2.4% for AGIs $75k-100k, 1.6% for AGIs $100k-200k)
Total itemized deductions: $21,037 (17% of AGI, reported on 46.9% of returns)
Here:
$21,037
State:
$26,433
Here:
16.6% of AGI
State:
19.2% of AGI
(% of AGI for various income ranges: 10.1% for AGIs below $25k, 10.2% for AGIs $25k-50k, 14.8% for AGIs $50k-75k, 13.4% for AGIs $75k-100k, 15.5% for AGIs $100k-200k, 8.4% for AGIs over 200k)
Charity contributions: $2,328 (reported on 36.0% of returns)
Here:
$2,328
State:
$4,525
(% of AGI for various income ranges: 0.5% for AGIs below $25k, 0.5% for AGIs $25k-50k, 1.0% for AGIs $50k-75k, 0.9% for AGIs $75k-100k, 1.2% for AGIs $100k-200k, 1.3% for AGIs over 200k)
Taxes paid: $10,591 (reported on 46.4% of returns)
62285:
$10,591
State:
$11,968
(% of AGI for various income ranges: 2.8% for AGIs below $25k, 4.0% for AGIs $25k-50k, 6.1% for AGIs $50k-75k, 6.5% for AGIs $75k-100k, 7.9% for AGIs $100k-200k, 5.4% for AGIs over 200k)
Earned income credit: $1,788 (reported on 8.1% of returns)
Here:
$1,788
State:
$2,349
(% of AGI for various income ranges: 3.2% for AGIs below $25k, 0.6% for AGIs $25k-50k)
Percentage of individuals using paid preparers for their 2012 taxes: 63.0%
Here:
63%
State:
57%
(% for various income ranges: 53.3% for AGIs below $25k, 59.5% for AGIs $25k-50k, 66.7% for AGIs $50k-75k, 69.7% for AGIs $75k-100k, 67.4% for AGIs $100k-200k, 87.5% for AGIs over 200k)
Averages for the 2004 tax year for zip code 62285, filed in 2005:
Average Adjusted Gross Income (AGI) in 2004: $59,072 (Individual Income Tax Returns)
Here:
$59,072
State:
$54,625
Salary/wage: $51,211 (reported on 86.6% of returns)
Here:
$51,211
State:
$46,811
(% of AGI for various income ranges: 78.4% for AGIs below $10k, 67.2% for AGIs $10k-25k, 79.7% for AGIs $25k-50k, 84.5% for AGIs $50k-75k, 85.5% for AGIs $75k-100k, 65.4% for AGIs over 100k)
Taxable interest for individuals: $1,126 (reported on 61.3% of returns)
This zip code:
$1,126
Illinois:
$2,101
(% of AGI for various income ranges: 5.2% for AGIs below $10k, 4.3% for AGIs $10k-25k, 1.6% for AGIs $25k-50k, 1.0% for AGIs $50k-75k, 0.5% for AGIs $75k-100k, 0.9% for AGIs over 100k)
Taxable dividends: $2,997 (reported on 36.1% of returns)
Here:
$2,997
State:
$4,306
(% of AGI for various income ranges: 4.0% for AGIs below $10k, 2.2% for AGIs $10k-25k, 1.6% for AGIs $25k-50k, 1.4% for AGIs $50k-75k, 1.0% for AGIs $75k-100k, 2.4% for AGIs over 100k)
Net capital gain/loss: +$4,134 (reported on 24.8% of returns)
Here:
+$4,134
State:
+$17,321
(% of AGI for various income ranges: -2.2% for AGIs below $10k, -0.2% for AGIs $10k-25k, 0.1% for AGIs $25k-50k, 0.8% for AGIs $50k-75k, 1.0% for AGIs $75k-100k, 3.3% for AGIs over 100k)
Profit/loss from business: +$11,150 (reported on 13.2% of returns)
Here:
+$11,150
State:
+$11,771
(% of AGI for various income ranges: 5.6% for AGIs below $10k, 3.2% for AGIs $10k-25k, 2.5% for AGIs $25k-50k, 1.3% for AGIs $50k-75k, 3.2% for AGIs $75k-100k, 2.6% for AGIs over 100k)
IRA payment deduction: $3,122 (reported on 2.8% of returns)
62285:
$3,122
Illinois:
$3,087
Total itemized deductions: $17,617 (18% of AGI, reported on 43.2% of returns)
Here:
$17,617
State:
$20,239
Here:
18.2% of AGI
State:
19.5% of AGI
(% of AGI for various income ranges: 14.9% for AGIs below $10k, 11.6% for AGIs $10k-25k, 11.0% for AGIs $25k-50k, 14.6% for AGIs $50k-75k, 14.8% for AGIs $75k-100k, 11.8% for AGIs over 100k)
Charity contributions deductions: $2,088 (2% of AGI, reported on 36.3% of returns)
Here:
$2,088
State:
$3,719
Here:
2.0% of AGI
State:
3.4% of AGI
(% of AGI for various income ranges: 1.0% for AGIs $10k-25k, 1.0% for AGIs $25k-50k, 1.1% for AGIs $50k-75k, 1.5% for AGIs $75k-100k, 1.4% for AGIs over 100k)
Total tax: $8,884 (reported on 83.2% of returns)
62285:
$8,884
State:
$9,882
(% of AGI for various income ranges: 2.4% for AGIs below $10k, 4.1% for AGIs $10k-25k, 7.1% for AGIs $25k-50k, 7.8% for AGIs $50k-75k, 10.2% for AGIs $75k-100k, 18.6% for AGIs over 100k)
Earned income credit: $1,463 (reported on 6.8% of returns)
Here:
$1,463
State:
$1,788
Percentage of individuals using paid preparers for their 2004 taxes: 64.4%
Here:
64%
State:
61%
(% for various income ranges: 57.7% for AGIs below $10k, 61.1% for AGIs $10k-25k, 63.2% for AGIs $25k-50k, 65.0% for AGIs $50k-75k, 71.2% for AGIs $75k-100k, 71.7% for AGIs over 100k)
Household received Food Stamps/SNAP in the past 12 months: 139 Household did not receive Food Stamps/SNAP in the past 12 months: 1,598
Women who had a birth in the past 12 months: 6 (6 now married, 0 unmarried) Women who did not have a birth in the past 12 months: 807 (574 now married, 222 unmarried)
Housing units in zip code 62285 with a mortgage: 1,017 (131 second mortgage, 120 both second mortgage and home equity loan) Median monthly owner costs for units with a mortgage: $2,018 Median monthly owner costs for units without a mortgage: $692
Residents with income below the poverty level in 2022:
This zip code:
4.5%
Whole state:
11.9%
Residents with income below 50% of the poverty level in 2022:
This zip code:
2.3%
Whole state:
5.7%
Median number of rooms in houses and condos:
Here:
6.7
State:
6.4
Median number of rooms in apartments:
Here:
4.1
State:
4.1
Notable locations in this zip code not listed on our city pages
Churches in zip code 62285 include: First Baptist Church of Smithton (A), Saint John the Baptist Catholic Church (B), Saint Johns United Church of Christ (C), Evangelische Saint Johannes Kirche (D). Display/hide their locations on the map
Lakes and reservoirs: Draabs Lake (A), Sportsman Lake (B), Smithton Sportmans Club Lake (C), New West Fork Club Lake (D). Display/hide their locations on the map
In group quarters: 58 (-1 institutionalized population)
Size of family households: 678 2-persons, 219 3-persons, 265 4-persons, 180 5-persons, 6 6-persons
Size of nonfamily households: 367 1-person, 17 2-persons
929 married couples with children.
64 single-parent households (18 men, 46 women).
96.7% of residents of 62285 zip code speak English at home.
3.1% of residents speak other Indo-European language at home (84% very well, 16% well).
Foreign born population: 114 (2.6%) (35.3% of them are naturalized citizens)
This zip code:
2.6%
Whole state:
14.4%
45%Sweden
39%Moldova
18%France
53%German
7%American
7%Irish
5%European
3%Albanian
2%English
2%Lithuanian
Year of entry for the foreign-born population
482010 or later
252000 to 2009
511990 to 1999
19Before 1990
Facilities with environmental interests located in this zip code:
HY-DAC (9 W FRANKLIN in SMITHTON, IL)
STATE MASTER (Illinois EPA Project) - HAZARDOUS WASTE PROGRAM Conditionally Exempt Small Quantity Generators, less than 100 kg/month of hazardous waste (Resource Conservation and Recovery Act (tracking hazardous waste)) Organizations: JEANNE E BROWN & PAT CARR (CONTACT/OWNER)
INDUSTRIAL ROLLER CO (218 N MAIN in SMITHTON, IL)
STATE MASTER (Illinois EPA Project) - SOLID WASTE PROGRAM, HAZARDOUS WASTE PROGRAM Conditionally Exempt Small Quantity Generators, less than 100 kg/month of hazardous waste (Resource Conservation and Recovery Act (tracking hazardous waste))
Housing units lacking complete plumbing facilities: 1.2%
68.0%Utility gas
25.1%Electricity
5.2%Bottled, tank, or LP gas
1.0%Wood
0.8%Other fuel
Population in 1990: 2,749. Population change in the 1990s: +372 (+13.5%).
Place of birth for U.S.-born residents:
This state: 2,924
Northeast: 177
Midwest: 936
South: 191
West: 78
57% of the 62285 zip code residents lived in the same house 5 years ago. Out of people who lived in different houses, 74% lived in this county. Out of people who lived in different counties, 50% lived in Illinois.
95% of the 62285 zip code residents lived in the same house 1 year ago. Out of people who lived in different houses, 72% moved from this county. Out of people who lived in different houses, 17% moved from different county within same state. Out of people who lived in different houses, 8% moved from abroad.
Private vs. public school enrollment:
Students in private schools in grades 1 to 8 (elementary and middle school): 78
Here:
14.5%
Illinois:
13.3%
Students in private schools in grades 9 to 12 (high school):
Here:
0.0%
Illinois:
9.9%
Students in private undergraduate colleges: 47
Here:
29.3%
Illinois:
27.4%
Occupation by median earnings in the past 12 months ($)
165,663Legal occupations
135,517Installation, maintenance, and repair occupations
95,475Business and financial operations occupations
93,781Production occupations
92,423Architecture and engineering occupations
86,527Construction and extraction occupations
Top industries in this zip code by the number of employees in 2005:
Health Care and Social Assistance: Nursing Care Facilities (50-99 employees: 1 establishment)
Other Services (except Public Administration): Religious Organizations (20-49: 1, 5-9: 1)
Administrative and Support and Waste Management and Remediation Services: Landscaping Services (20-49: 1, 1-4: 2)
Accommodation and Food Services: Full-Service Restaurants (20-49: 1)
Health Care and Social Assistance: Child Day Care Services (10-19: 1, 1-4: 2)
Health Care and Social Assistance: Offices of Dentists (5-9: 1)
People in group quarters in 2010:
73 people in nursing facilities/skilled-nursing facilities
People in group quarters in 2000:
93 people in nursing homes
Fatal accident statistics in 2013:
Fatal accident count: 1
Vehicles involved in fatal accidents: 1
Fatal accidents caused by drunken drivers: 0
Fatalities: 1
Persons involved in fatal accidents: 1
Pedestrians involved in fatal accidents: 1
Fatal accident statistics in 2011:
Fatal accident count: 1
Vehicles involved in fatal accidents: 2
Fatal accidents caused by drunken drivers: 0
Fatalities: 1
Persons involved in fatal accidents: 2
Pedestrians involved in fatal accidents: 0
Home Mortgage Disclosure Act Aggregated Statistics For Year 2009 (Based on 4 partial tracts)
A) FHA, FSA/RHS & VA Home Purchase Loans
B) Conventional Home Purchase Loans
C) Refinancings
D) Home Improvement Loans
E) Loans on Dwellings For 5+ Families
F) Non-occupant Loans on < 5 Family Dwellings (A B C & D)
G) Loans On Manufactured Home Dwelling (A B C & D)
Number
Average Value
Number
Average Value
Number
Average Value
Number
Average Value
Number
Average Value
Number
Average Value
Number
Average Value
LOANS ORIGINATED
13
$156,243
23
$141,662
131
$150,554
8
$88,654
1
$129,410
6
$132,167
3
$45,420
APPLICATIONS APPROVED, NOT ACCEPTED
1
$189,690
2
$192,670
9
$174,718
0
$0
0
$0
0
$0
0
$0
APPLICATIONS DENIED
2
$150,865
3
$122,953
19
$153,387
4
$44,938
0
$0
0
$0
1
$81,530
APPLICATIONS WITHDRAWN
1
$228,580
3
$131,950
16
$176,377
1
$130,310
0
$0
1
$183,750
0
$0
FILES CLOSED FOR INCOMPLETENESS
0
$0
0
$0
3
$132,030
0
$0
0
$0
0
$0
1
$22,700
Aggregated Statistics For Year 2008 (Based on 4 partial tracts)
A) FHA, FSA/RHS & VA Home Purchase Loans
B) Conventional Home Purchase Loans
C) Refinancings
D) Home Improvement Loans
F) Non-occupant Loans on < 5 Family Dwellings (A B C & D)
G) Loans On Manufactured Home Dwelling (A B C & D)
Number
Average Value
Number
Average Value
Number
Average Value
Number
Average Value
Number
Average Value
Number
Average Value
LOANS ORIGINATED
9
$162,866
28
$141,301
59
$150,474
8
$48,272
5
$111,976
4
$55,210
APPLICATIONS APPROVED, NOT ACCEPTED
1
$114,220
3
$179,303
9
$136,530
2
$54,935
0
$0
2
$48,185
APPLICATIONS DENIED
2
$141,170
3
$80,240
18
$149,476
7
$54,333
1
$95,630
2
$47,640
APPLICATIONS WITHDRAWN
1
$196,630
3
$111,907
13
$160,107
1
$83,750
0
$0
0
$0
FILES CLOSED FOR INCOMPLETENESS
0
$0
0
$0
4
$161,958
0
$0
0
$0
0
$0
Aggregated Statistics For Year 2007 (Based on 4 partial tracts)
A) FHA, FSA/RHS & VA Home Purchase Loans
B) Conventional Home Purchase Loans
C) Refinancings
D) Home Improvement Loans
F) Non-occupant Loans on < 5 Family Dwellings (A B C & D)
G) Loans On Manufactured Home Dwelling (A B C & D)
Number
Average Value
Number
Average Value
Number
Average Value
Number
Average Value
Number
Average Value
Number
Average Value
LOANS ORIGINATED
5
$172,998
46
$120,966
53
$129,408
14
$52,819
7
$88,609
4
$48,392
APPLICATIONS APPROVED, NOT ACCEPTED
0
$0
3
$105,333
10
$121,758
1
$84,640
1
$51,440
1
$50,940
APPLICATIONS DENIED
1
$138,340
7
$99,811
23
$123,320
10
$62,245
2
$86,025
2
$77,630
APPLICATIONS WITHDRAWN
0
$0
3
$131,500
13
$146,817
1
$160,160
0
$0
0
$0
FILES CLOSED FOR INCOMPLETENESS
0
$0
1
$192,320
4
$158,725
0
$0
0
$0
0
$0
Aggregated Statistics For Year 2006 (Based on 4 partial tracts)
A) FHA, FSA/RHS & VA Home Purchase Loans
B) Conventional Home Purchase Loans
C) Refinancings
D) Home Improvement Loans
F) Non-occupant Loans on < 5 Family Dwellings (A B C & D)
G) Loans On Manufactured Home Dwelling (A B C & D)
Number
Average Value
Number
Average Value
Number
Average Value
Number
Average Value
Number
Average Value
Number
Average Value
LOANS ORIGINATED
8
$155,729
61
$125,330
55
$119,451
18
$46,574
7
$103,716
4
$40,412
APPLICATIONS APPROVED, NOT ACCEPTED
0
$0
6
$146,722
6
$112,840
1
$62,520
0
$0
0
$0
APPLICATIONS DENIED
1
$109,120
9
$111,028
28
$123,406
4
$50,750
1
$91,300
3
$60,870
APPLICATIONS WITHDRAWN
0
$0
3
$112,130
15
$139,646
1
$46,730
0
$0
0
$0
FILES CLOSED FOR INCOMPLETENESS
0
$0
1
$142,080
3
$138,890
0
$0
0
$0
0
$0
Aggregated Statistics For Year 2005 (Based on 4 partial tracts)
A) FHA, FSA/RHS & VA Home Purchase Loans
B) Conventional Home Purchase Loans
C) Refinancings
D) Home Improvement Loans
F) Non-occupant Loans on < 5 Family Dwellings (A B C & D)
G) Loans On Manufactured Home Dwelling (A B C & D)
Number
Average Value
Number
Average Value
Number
Average Value
Number
Average Value
Number
Average Value
Number
Average Value
LOANS ORIGINATED
8
$149,481
57
$132,451
73
$115,777
11
$42,499
6
$110,658
4
$33,772
APPLICATIONS APPROVED, NOT ACCEPTED
0
$0
5
$100,074
7
$123,731
1
$39,070
1
$94,940
1
$32,690
APPLICATIONS DENIED
2
$110,420
10
$89,354
28
$118,591
4
$20,568
2
$54,535
5
$46,220
APPLICATIONS WITHDRAWN
1
$101,120
3
$170,650
19
$148,797
1
$216,280
1
$88,780
0
$0
FILES CLOSED FOR INCOMPLETENESS
0
$0
1
$69,770
4
$136,740
0
$0
0
$0
0
$0
Aggregated Statistics For Year 2004 (Based on 4 partial tracts)
A) FHA, FSA/RHS & VA Home Purchase Loans
B) Conventional Home Purchase Loans
C) Refinancings
D) Home Improvement Loans
F) Non-occupant Loans on < 5 Family Dwellings (A B C & D)
G) Loans On Manufactured Home Dwelling (A B C & D)
Number
Average Value
Number
Average Value
Number
Average Value
Number
Average Value
Number
Average Value
Number
Average Value
LOANS ORIGINATED
6
$160,863
47
$114,809
72
$116,524
8
$45,411
5
$72,260
6
$42,785
APPLICATIONS APPROVED, NOT ACCEPTED
0
$0
6
$109,922
9
$117,208
1
$49,910
0
$0
1
$40,590
APPLICATIONS DENIED
1
$81,310
7
$82,966
29
$126,465
6
$47,267
1
$111,930
2
$49,765
APPLICATIONS WITHDRAWN
0
$0
3
$76,483
17
$120,467
1
$73,660
0
$0
1
$20,940
FILES CLOSED FOR INCOMPLETENESS
0
$0
1
$162,840
2
$122,990
0
$0
0
$0
0
$0
Aggregated Statistics For Year 2003 (Based on 4 partial tracts)
A) FHA, FSA/RHS & VA Home Purchase Loans
B) Conventional Home Purchase Loans
C) Refinancings
D) Home Improvement Loans
F) Non-occupant Loans on < 5 Family Dwellings (A B C & D)
Detailed PMIC statistics for the following Tracts:5039.02
, 5040.01
2002 - 2018 National Fire Incident Reporting System (NFIRS) incidents
According to the data from the years 2002 - 2018 the average number of fires per year is 22. The highest number of fire incidents - 38 took place in 2007, and the least - 9 in 2003. The data has a dropping trend.
When looking into fire subcategories, the most reports belonged to: Structure Fires (55.1%), and Outside Fires (31.9%).
Fire incident types reported to NFIRS in Zip Code 62285


 Nearest zip codes: 62248, 62220, 62260, 62243, 62264, 62226.


 According to the data from the years 2002 - 2018 the average number of fires per year is 22. The highest number of fire incidents - 38 took place in 2007, and the least - 9 in 2003. The data has a dropping trend.
 When looking into fire subcategories, the most reports belonged to: Structure Fires (55.1%), and Outside Fires (31.9%).