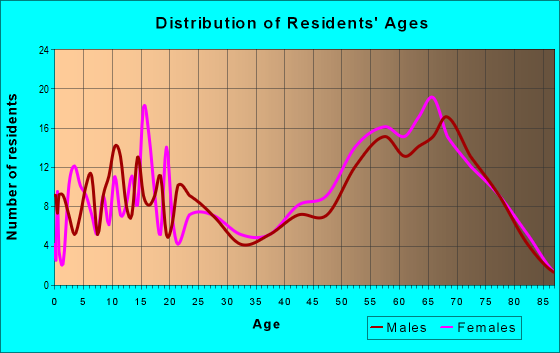
Estimated zip code population in 2022: 1,415 Zip code population in 2010: 1,684 Zip code population in 2000: 1,559
Houses and condos: 835 Renter-occupied apartments: 111
% of renters here:
21%
State:
33%
March 2022 cost of living index in zip code 62354: 85.0 (less than average, U.S. average is 100)
Land area: 36.7 sq. mi. Water area: 7.9 sq. mi.
Population density: 39 people per square mile
(very low).
OSM Map
General Map
Google Map
MSN Map
OSM Map
General Map
Google Map
MSN Map
OSM Map
General Map
Google Map
MSN Map
OSM Map
General Map
Google Map
MSN Map
Please wait while loading the map...
Real estate property taxes paid for housing units in 2022:
This zip code:
2.0% ($2,725)
Illinois:
2.0% ($4,912)
Median real estate property taxes paid for housing units with mortgages in 2022: $2,811 (1.7%) Median real estate property taxes paid for housing units with no mortgage in 2022: $2,724 (2.1%)
Averages for the 2020 tax year for zip code 62354, filed in 2021:
Average Adjusted Gross Income (AGI) in 2020: $58,767 (Individual Income Tax Returns)
Here:
$58,767
State:
$82,626
Salary/wage: $45,757 (reported on 73.0% of returns)
Here:
$45,757
State:
$66,640
(% of AGI for various income ranges: 1177.9% for AGIs below $25k, 3136.7% for AGIs $25k-50k, 5936.7% for AGIs $50k-75k, 7688.0% for AGIs $75k-100k, 15283.3% for AGIs $100k-200k)
Taxable interest for individuals: $1,193 (reported on 44.4% of returns)
This zip code:
$1,193
Illinois:
$2,376
(% of AGI for various income ranges: 25.0% for AGIs below $25k, 53.3% for AGIs $25k-50k, 93.3% for AGIs $50k-75k, 30.0% for AGIs $75k-100k, 300.0% for AGIs $100k-200k)
Ordinary dividends: $5,381 (reported on 25.4% of returns)
Here:
$5,381
State:
$9,061
(% of AGI for various income ranges: 42.9% for AGIs below $25k, 115.6% for AGIs $25k-50k, 116.7% for AGIs $50k-75k, 122.0% for AGIs $75k-100k, 943.3% for AGIs $100k-200k)
Net capital gain/loss in AGI: +$7,180 (reported on 23.8% of returns)
Here:
+$7,180
State:
+$31,684
(% of AGI for various income ranges: 17.1% for AGIs below $25k, 92.2% for AGIs $25k-50k, 85.0% for AGIs $50k-75k, 356.0% for AGIs $75k-100k, 1235.0% for AGIs $100k-200k)
Profit/loss from business: +$5,931 (reported on 20.6% of returns)
Here:
+$5,931
State:
+$12,175
(% of AGI for various income ranges: 102.9% for AGIs below $25k, 195.6% for AGIs $25k-50k, 180.0% for AGIs $50k-75k, 686.0% for AGIs $75k-100k)
Taxable individual retirement arrangement distribution: $12,300 (reported on 14.3% of returns)
62354:
$12,300
Illinois:
$21,613
(% of AGI for various income ranges: 180.7% for AGIs below $25k, 940.0% for AGIs $50k-75k, 483.3% for AGIs $100k-200k)
Total itemized deductions: $33,220 (reported on 7.9% of returns)
Here:
$33,220
State:
$34,948
(% of AGI for various income ranges: 2768.3% for AGIs $100k-200k)
Charity contributions: $18,450 (reported on 6.3% of returns)
Here:
$18,450
State:
$13,122
(% of AGI for various income ranges: 1230.0% for AGIs $100k-200k)
Taxes paid: $7,280 (reported on 7.9% of returns)
62354:
$7,280
State:
$8,563
(% of AGI for various income ranges: 135.6% for AGIs $25k-50k, 403.3% for AGIs $100k-200k)
Earned income credit: $2,200 (reported on 12.7% of returns)
Here:
$2,200
State:
$2,311
(% of AGI for various income ranges: 97.1% for AGIs below $25k, 44.4% for AGIs $25k-50k)
Percentage of individuals using paid preparers for their 2020 taxes: 93.7%
Here:
94%
State:
93%
(% for various income ranges: 95.2% for AGIs below $25k, 92.3% for AGIs $25k-50k, 100.0% for AGIs $50k-75k, 87.5% for AGIs $75k-100k, 90.9% for AGIs $100k-200k)
Averages for the 2012 tax year for zip code 62354, filed in 2013:
Average Adjusted Gross Income (AGI) in 2012: $50,993 (Individual Income Tax Returns)
Here:
$50,993
State:
$68,058
Salary/wage: $36,408 (reported on 75.4% of returns)
Here:
$36,408
State:
$55,396
(% of AGI for various income ranges: 59.3% for AGIs below $25k, 58.0% for AGIs $25k-50k, 68.9% for AGIs $50k-75k, 63.0% for AGIs $75k-100k, 38.5% for AGIs $100k-200k)
Taxable interest for individuals: $1,636 (reported on 52.2% of returns)
This zip code:
$1,636
Illinois:
$1,969
(% of AGI for various income ranges: 3.5% for AGIs below $25k, 1.8% for AGIs $25k-50k, 0.7% for AGIs $50k-75k, 0.9% for AGIs $75k-100k, 2.1% for AGIs $100k-200k)
Ordinary dividends: $3,576 (reported on 30.4% of returns)
Here:
$3,576
State:
$7,786
(% of AGI for various income ranges: 2.2% for AGIs below $25k, 1.2% for AGIs $25k-50k, 1.5% for AGIs $50k-75k, 1.2% for AGIs $75k-100k, 3.3% for AGIs $100k-200k)
Net capital gain/loss in AGI: +$6,673 (reported on 21.7% of returns)
Here:
+$6,673
State:
+$22,183
(% of AGI for various income ranges: 0.3% for AGIs $25k-50k, 0.6% for AGIs $50k-75k, 7.3% for AGIs $100k-200k)
Profit/loss from business: +$4,480 (reported on 21.7% of returns)
Here:
+$4,480
State:
+$12,903
(% of AGI for various income ranges: 5.2% for AGIs below $25k, 2.3% for AGIs $25k-50k, 2.3% for AGIs $50k-75k, 3.5% for AGIs $75k-100k)
Taxable individual retirement arrangement distribution: $11,925 (reported on 17.4% of returns)
62354:
$11,925
Illinois:
$17,929
(% of AGI for various income ranges: 4.6% for AGIs below $25k, 4.1% for AGIs $25k-50k, 2.9% for AGIs $50k-75k, 13.6% for AGIs $75k-100k)
Total itemized deductions: $21,927 (26% of AGI, reported on 31.9% of returns)
Here:
$21,927
State:
$26,433
Here:
25.5% of AGI
State:
19.2% of AGI
(% of AGI for various income ranges: 14.1% for AGIs below $25k, 13.9% for AGIs $25k-50k, 11.7% for AGIs $50k-75k, 10.8% for AGIs $75k-100k, 16.0% for AGIs $100k-200k)
Charity contributions: $7,726 (reported on 27.5% of returns)
Here:
$7,726
State:
$4,525
(% of AGI for various income ranges: 1.8% for AGIs below $25k, 5.0% for AGIs $25k-50k, 3.1% for AGIs $50k-75k, 4.0% for AGIs $75k-100k, 5.0% for AGIs $100k-200k)
Taxes paid: $7,400 (reported on 31.9% of returns)
62354:
$7,400
State:
$11,968
(% of AGI for various income ranges: 3.3% for AGIs below $25k, 3.1% for AGIs $25k-50k, 3.6% for AGIs $50k-75k, 3.6% for AGIs $75k-100k, 6.6% for AGIs $100k-200k)
Earned income credit: $2,450 (reported on 11.6% of returns)
Here:
$2,450
State:
$2,349
(% of AGI for various income ranges: 4.5% for AGIs below $25k, 1.0% for AGIs $25k-50k)
Percentage of individuals using paid preparers for their 2012 taxes: 71.0%
Here:
71%
State:
57%
(% for various income ranges: 63.0% for AGIs below $25k, 68.8% for AGIs $25k-50k, 81.8% for AGIs $50k-75k, 85.7% for AGIs $75k-100k, 75.0% for AGIs $100k-200k)
Averages for the 2004 tax year for zip code 62354, filed in 2005:
Average Adjusted Gross Income (AGI) in 2004: $36,683 (Individual Income Tax Returns)
Here:
$36,683
State:
$54,625
Salary/wage: $31,044 (reported on 74.9% of returns)
Here:
$31,044
State:
$46,811
(% of AGI for various income ranges: 110.9% for AGIs below $10k, 55.0% for AGIs $10k-25k, 66.6% for AGIs $25k-50k, 69.1% for AGIs $50k-75k, 72.2% for AGIs $75k-100k, 47.1% for AGIs over 100k)
Taxable interest for individuals: $1,335 (reported on 66.1% of returns)
This zip code:
$1,335
Illinois:
$2,101
(% of AGI for various income ranges: 12.2% for AGIs below $10k, 4.1% for AGIs $10k-25k, 2.0% for AGIs $25k-50k, 2.2% for AGIs $50k-75k, 1.5% for AGIs $75k-100k, 1.8% for AGIs over 100k)
Taxable dividends: $2,547 (reported on 33.5% of returns)
Here:
$2,547
State:
$4,306
(% of AGI for various income ranges: 5.9% for AGIs below $10k, 3.0% for AGIs $10k-25k, 1.5% for AGIs $25k-50k, 1.6% for AGIs $50k-75k, 0.8% for AGIs $75k-100k, 4.2% for AGIs over 100k)
Net capital gain/loss: +$8,776 (reported on 22.5% of returns)
Here:
+$8,776
State:
+$17,321
(% of AGI for various income ranges: 2.3% for AGIs below $10k, -0.6% for AGIs $10k-25k, 1.9% for AGIs $25k-50k, 0.6% for AGIs $50k-75k, 1.0% for AGIs $75k-100k, 20.6% for AGIs over 100k)
Profit/loss from business: +$3,099 (reported on 22.0% of returns)
Here:
+$3,099
State:
+$11,771
(% of AGI for various income ranges: -4.7% for AGIs below $10k, 4.1% for AGIs $10k-25k, 4.4% for AGIs $25k-50k, 1.0% for AGIs $50k-75k, 1.1% for AGIs over 100k)
IRA payment deduction: $2,500 (reported on 3.0% of returns)
62354:
$2,500
Illinois:
$3,087
Total itemized deductions: $19,500 (28% of AGI, reported on 23.8% of returns)
Here:
$19,500
State:
$20,239
Here:
28.2% of AGI
State:
19.5% of AGI
(% of AGI for various income ranges: 15.4% for AGIs $10k-25k, 11.8% for AGIs $25k-50k, 8.3% for AGIs $50k-75k, 14.0% for AGIs $75k-100k, 17.6% for AGIs over 100k)
Charity contributions deductions: $8,291 (11% of AGI, reported on 20.2% of returns)
Here:
$8,291
State:
$3,719
Here:
11.2% of AGI
State:
3.4% of AGI
(% of AGI for various income ranges: 2.5% for AGIs $10k-25k, 3.2% for AGIs $25k-50k, 2.3% for AGIs $50k-75k, 4.8% for AGIs $75k-100k, 10.0% for AGIs over 100k)
Total tax: $4,499 (reported on 72.8% of returns)
62354:
$4,499
State:
$9,882
(% of AGI for various income ranges: 3.6% for AGIs below $10k, 4.1% for AGIs $10k-25k, 6.9% for AGIs $25k-50k, 8.5% for AGIs $50k-75k, 9.4% for AGIs $75k-100k, 14.2% for AGIs over 100k)
Earned income credit: $1,348 (reported on 12.6% of returns)
Here:
$1,348
State:
$1,788
Percentage of individuals using paid preparers for their 2004 taxes: 72.4%
Here:
72%
State:
61%
(% for various income ranges: 61.6% for AGIs below $10k, 81.5% for AGIs $10k-25k, 70.8% for AGIs $25k-50k, 81.0% for AGIs $50k-75k, 71.1% for AGIs $75k-100k, 64.9% for AGIs over 100k)
Household received Food Stamps/SNAP in the past 12 months: 57 Household did not receive Food Stamps/SNAP in the past 12 months: 475
Women who had a birth in the past 12 months: 6 (6 now married, 0 unmarried) Women who did not have a birth in the past 12 months: 222 (76 now married, 146 unmarried)
Housing units in zip code 62354 with a mortgage: 143 (3 second mortgage, 4 both second mortgage and home equity loan) Houses without a mortgage: 6
Median monthly owner costs for units with a mortgage: $1,199 Median monthly owner costs for units without a mortgage: $636
Residents with income below the poverty level in 2022:
This zip code:
26.5%
Whole state:
11.9%
Residents with income below 50% of the poverty level in 2022:
This zip code:
10.3%
Whole state:
5.7%
Median number of rooms in houses and condos:
Here:
6.3
State:
6.4
Median number of rooms in apartments:
Here:
4.5
State:
4.1
Notable locations in this zip code not listed on our city pages
Notable locations in zip code 62354: Baxters Vineyard (A), Nauvoo Fire Protection District (B), Niota Fire Department (C). Display/hide their locations on the map
Churches in zip code 62354 include: Christ Lutheran Church (A), Saint Marys Priory (B), Saints Peter and Paul Catholic Church (C). Display/hide their locations on the map
Cemeteries: Smith Family Cemetery (1), Nauvoo Two Cemetery (2), Oak Grove Cemetery (3), Nauvoo City Cemetery (4), Pioneer Saints Cemetery (5), Saints Peter and Paul Cemetery (6), Dundey Cemetery (7). Display/hide their locations on the map
Creeks: Sheridan Creek (A), Robinson Creek (B), Waggoner Creek (C), Larry Creek (D), Tyson Creek (E), Sycamore Creek (F). Display/hide their locations on the map
In group quarters: 35 (-1 institutionalized population)
Size of family households: 223 2-persons, 106 3-persons, 25 4-persons, 34 5-persons, 11 7-or-more-persons
Size of nonfamily households: 112 1-person, 11 2-persons, 9 4-persons
190 married couples with children.
58 single-parent households (58 women).
98.3% of residents of 62354 zip code speak English at home.
0.4% of residents speak Spanish at home (100% well).
0.5% of residents speak other Indo-European language at home (43% very well, 57% well).
0.5% of residents speak Asian or Pacific Island language at home (100% well).
0.2% of residents speak other language at home (100% very well).
Foreign born population: 15 (1.1%) (46.9% of them are naturalized citizens)
This zip code:
1.1%
Whole state:
14.4%
27%France
20%Thailand
20%Liberia
13%Singapore
27%German
21%English
14%Irish
11%American
3%French
3%Swedish
2%European
Year of entry for the foreign-born population
82010 or later
02000 to 2009
31990 to 1999
3Before 1990
Facilities with environmental interests located in this zip code:
NAUVOO COLUSA SCHOOL DISTRICT (ILLINOIS ROUTE 96 NORTH in NAUVOO, IL)
STATE MASTER (Illinois EPA Project) - National Pollutant Discharge Elimination System Permit National Pollutant Discharge Elimination System NON-MAJOR (Tracking pollutant discharge elimination systems) - permit National Pollutant Discharge Elimination System NON-MAJOR (Tracking pollutant discharge elimination systems) - permit Business SIC classification: ELEMENTARY AND SECONDARY SCHOOLS Organizations: NAUVOO-COLUSA HIGH SCHOOL (CONTACT/OWNER)
Alternative names: NAUVOO-COLUSA HIGH SCHOOL, NAUVOO-COLUSA HIGH SCHOOL STP
NAUVOO STP (345 WATER STREET in NAUVOO, IL)
STATE MASTER (Illinois EPA Project) - National Pollutant Discharge Elimination System Permit National Pollutant Discharge Elimination System NON-MAJOR (Tracking pollutant discharge elimination systems) - permit National Pollutant Discharge Elimination System NON-MAJOR (Tracking pollutant discharge elimination systems) - permit Business SIC classification: SEWERAGE SYSTEMS Alternative names: NAUVOO STP, CITY OF
NAUVOO BLUE CHEESE CO (1095 YOUNG ST in NAUVOO, IL)
STATE MASTER (Illinois EPA Project) - SOLID WASTE PROGRAM (Resource Conservation and Recovery Act (tracking hazardous waste))
NAUVOO WTP (120 YOUNG STREET in NAUVOO, IL)
STATE MASTER (Illinois EPA Project) - National Pollutant Discharge Elimination System Permit National Pollutant Discharge Elimination System NON-MAJOR (Tracking pollutant discharge elimination systems) - permit Business SIC classification: WATER SUPPLY Alternative names: NAUVOO WTP, CITY OF
NAUVOO MINI MART (1395 MULHOLLAND in NAUVOO, IL)
STATE MASTER (Illinois EPA Project) - HAZARDOUS WASTE PROGRAM Small Quantity Generators, between 100 kg and 1000 kg of hazardous waste/month (Resource Conservation and Recovery Act (tracking hazardous waste)) - notification Organizations: LARIMORE RAY L (CONTACT/OWNER)
NAUVOO ELEM SCHOOL (PO BOX 308 in NAUVOO, IL)
(National Center for Education Statistics) - STATE ID-2603432502002 Organizations: NAUVOO-COLUSA C U S DIST 325 (SCHOOL DISTRICT)
NAUVOO-COLUSA JR HIGH SCHOOL (PO BOX 308 in NAUVOO, IL)
(National Center for Education Statistics) - STATE ID-2603432501001 Organizations: NAUVOO-COLUSA C U S DIST 325 (SCHOOL DISTRICT)
NAUVOO-COLUSA SR HIGH SCHOOL (PO BOX 308 in NAUVOO, IL)
(National Center for Education Statistics) - STATE ID-2603432500001 Organizations: NAUVOO-COLUSA C U S DIST 325 (SCHOOL DISTRICT)
COLUSA ELEVATOR CO (#13 COMMERCE - BROADWAY ST. in NAUVOO, IL)
AIR MINOR (AIRS/AFS) CRITERIA AND HAZARDOUS AIR POLLUTANT INVENTORY (Inventory of air pollution sources) Business SIC classification: GRAIN AND FIELD BEANS Alternative names: COLUSA ELEVATOR COMPANY NAUVOO ELEVATOR
Housing units lacking complete plumbing facilities: 6.0%
38.2%Utility gas
37.2%Electricity
19.9%Bottled, tank, or LP gas
2.7%Other fuel
1.9%Wood
0.6%Solar energy
Place of birth for U.S.-born residents:
This state: 414
Northeast: 23
Midwest: 777
South: 49
West: 149
68% of the 62354 zip code residents lived in the same house 5 years ago. Out of people who lived in different houses, 65% lived in this county. Out of people who lived in different counties, 50% lived in Illinois.
89% of the 62354 zip code residents lived in the same house 1 year ago. Out of people who lived in different houses, 36% moved from this county. Out of people who lived in different houses, 16% moved from different county within same state. Out of people who lived in different houses, 52% moved from different state.
Private vs. public school enrollment:
Students in private schools in grades 1 to 8 (elementary and middle school): 23
Here:
17.8%
Illinois:
13.3%
Students in private schools in grades 9 to 12 (high school): 2
Here:
5.3%
Illinois:
9.9%
Students in private undergraduate colleges: 15
Here:
22.2%
Illinois:
27.4%
Occupation by median earnings in the past 12 months ($)
71,066Health diagnosing and treating practitioners and other technical occupations
56,845Management occupations
53,263Education, training, and library occupations
42,300Production occupations
33,974Construction and extraction occupations
20,361Transportation occupations
Top industries in this zip code by the number of employees in 2005:
Other Services (except Public Administration): Religious Organizations (10-19: 1, 1-4: 2)
Construction: Painting and Wall Covering Contractors (10-19: 1)
Wholesale Trade: Grain and Field Bean Merchant Wholesalers (10-19: 1)
People in group quarters in 2010:
21 people in college/university student housing
4 people in other noninstitutional facilities
People in group quarters in 2000:
45 people in religious group quarters
25 people in other noninstitutional group quarters
Fatal accident statistics in 2014:
Fatal accident count: 2
Vehicles involved in fatal accidents: 2
Fatal accidents caused by drunken drivers: 1
Fatalities: 2
Persons involved in fatal accidents: 2
Pedestrians involved in fatal accidents: 0
2002 - 2018 National Fire Incident Reporting System (NFIRS) incidents
According to the data from the years 2002 - 2018 the average number of fire incidents per year is 6. The highest number of reported fires - 14 took place in 2005, and the least - 0 in 2009. The data has a constant trend.
When looking into fire subcategories, the most incidents belonged to: Outside Fires (56.0%), and Structure Fires (32.1%).
Fire incident types reported to NFIRS in Zip Code 62354


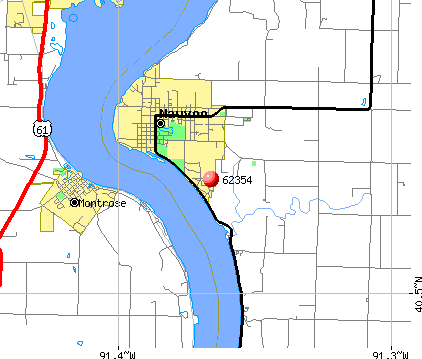 Nearest zip codes: 62358, 62341, 52639, 52632, 52627, 62334.


 According to the data from the years 2002 - 2018 the average number of fire incidents per year is 6. The highest number of reported fires - 14 took place in 2005, and the least - 0 in 2009. The data has a constant trend.
 When looking into fire subcategories, the most incidents belonged to: Outside Fires (56.0%), and Structure Fires (32.1%).