Estimated zip code population in 2022: 2,594 Zip code population in 2010: 2,667 Zip code population in 2000: 2,416
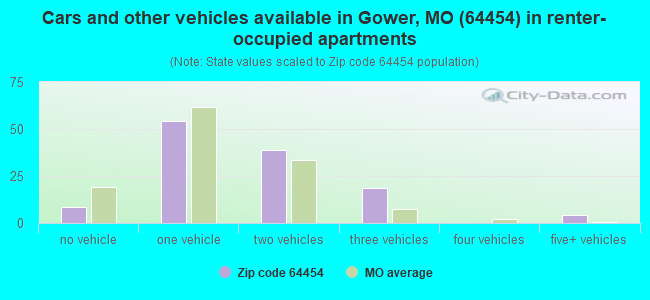
Houses and condos: 1,074 Renter-occupied apartments: 125
% of renters here:
13%
State:
32%
March 2022 cost of living index in zip code 64454: 77.6 (low, U.S. average is 100)
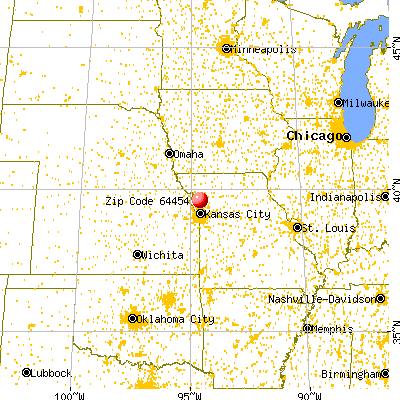
Land area: 65.8 sq. mi. Water area: 0.2 sq. mi.
Population density: 39 people per square mile
(very low).
OSM Map
General Map
Google Map
MSN Map
OSM Map
General Map
Google Map
MSN Map
OSM Map
General Map
Google Map
MSN Map
OSM Map
General Map
Google Map
MSN Map
Please wait while loading the map...
Real estate property taxes paid for housing units in 2022:
This zip code:
0.8% ($1,824)
Missouri:
0.8% ($1,810)
Median real estate property taxes paid for housing units with mortgages in 2022: $1,827 (0.8%) Median real estate property taxes paid for housing units with no mortgage in 2022: $1,819 (0.7%)
Estimated median house/condo value in 2022: $235,732
64454:
$235,732
Missouri:
$221,200
According to our research of Missouri and other state lists, there were 2 registered sex offenders living in 64454 zip code as of April 27, 2024. The ratio of all residents to sex offenders in zip code 64454 is 1,215 to 1. The ratio of registered sex offenders to all residents in this zip code is much lower than the state average.
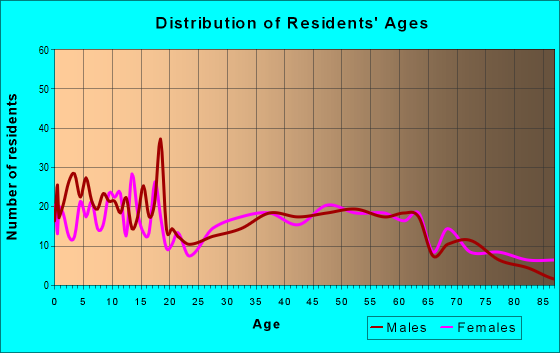
Median resident age:
This zip code:
38.3 years
Missouri median age:
39.1 years
Average household size:
This zip code:
2.6 people
Missouri:
2.4 people
Averages for the 2020 tax year for zip code 64454, filed in 2021:
Average Adjusted Gross Income (AGI) in 2020: $62,246 (Individual Income Tax Returns)
Here:
$62,246
State:
$68,151
Salary/wage: $57,596 (reported on 80.5% of returns)
Here:
$57,596
State:
$56,131
(% of AGI for various income ranges: 1087.2% for AGIs below $25k, 3746.8% for AGIs $25k-50k, 6192.7% for AGIs $50k-75k, 9591.8% for AGIs $75k-100k, 16211.4% for AGIs $100k-200k)
Taxable interest for individuals: $1,044 (reported on 36.6% of returns)
This zip code:
$1,044
Missouri:
$1,586
(% of AGI for various income ranges: 15.2% for AGIs below $25k, 24.2% for AGIs $25k-50k, 53.3% for AGIs $50k-75k, 50.9% for AGIs $75k-100k, 150.0% for AGIs $100k-200k)
Ordinary dividends: $2,343 (reported on 17.1% of returns)
Here:
$2,343
State:
$10,947
(% of AGI for various income ranges: 27.2% for AGIs below $25k, 22.6% for AGIs $25k-50k, 48.7% for AGIs $50k-75k, 26.4% for AGIs $75k-100k, 199.3% for AGIs $100k-200k)
Net capital gain/loss in AGI: +$6,260 (reported on 16.3% of returns)
Here:
+$6,260
State:
+$18,453
(% of AGI for various income ranges: 16.4% for AGIs below $25k, 84.2% for AGIs $25k-50k, 75.3% for AGIs $50k-75k, 69.1% for AGIs $75k-100k, 615.7% for AGIs $100k-200k)
Profit/loss from business: +$4,506 (reported on 14.6% of returns)
Here:
+$4,506
State:
+$12,260
(% of AGI for various income ranges: 104.8% for AGIs below $25k, 83.7% for AGIs $25k-50k, 83.3% for AGIs $50k-75k, 18.2% for AGIs $75k-100k, 175.0% for AGIs $100k-200k)
Taxable individual retirement arrangement distribution: $16,821 (reported on 11.4% of returns)
64454:
$16,821
Missouri:
$19,719
(% of AGI for various income ranges: 62.4% for AGIs below $25k, 127.9% for AGIs $25k-50k, 193.3% for AGIs $50k-75k, 617.3% for AGIs $75k-100k, 705.0% for AGIs $100k-200k)
Total itemized deductions: $26,000 (reported on 4.9% of returns)
Here:
$26,000
State:
$36,651
(% of AGI for various income ranges: 398.4% for AGIs $25k-50k, 573.6% for AGIs $100k-200k)
Charity contributions: $7,300 (reported on 3.3% of returns)
Here:
$7,300
State:
$15,671
(% of AGI for various income ranges: 208.6% for AGIs $100k-200k)
Taxes paid: $5,467 (reported on 4.9% of returns)
64454:
$5,467
State:
$7,608
(% of AGI for various income ranges: 48.4% for AGIs $25k-50k, 168.6% for AGIs $100k-200k)
Earned income credit: $2,529 (reported on 11.4% of returns)
Here:
$2,529
State:
$2,315
(% of AGI for various income ranges: 94.0% for AGIs below $25k, 62.6% for AGIs $25k-50k)
Percentage of individuals using paid preparers for their 2020 taxes: 95.1%
Here:
95%
State:
93%
(% for various income ranges: 92.1% for AGIs below $25k, 96.0% for AGIs $25k-50k, 94.7% for AGIs $50k-75k, 100.0% for AGIs $75k-100k, 95.5% for AGIs $100k-200k, 100.0% for AGIs over 200k)
Averages for the 2012 tax year for zip code 64454, filed in 2013:
Average Adjusted Gross Income (AGI) in 2012: $55,801 (Individual Income Tax Returns)
Here:
$55,801
State:
$55,896
Salary/wage: $50,041 (reported on 84.5% of returns)
Here:
$50,041
State:
$46,205
(% of AGI for various income ranges: 75.2% for AGIs below $25k, 79.4% for AGIs $25k-50k, 77.3% for AGIs $50k-75k, 76.9% for AGIs $75k-100k, 73.0% for AGIs $100k-200k)
Taxable interest for individuals: $1,047 (reported on 40.9% of returns)
This zip code:
$1,047
Missouri:
$1,559
(% of AGI for various income ranges: 1.8% for AGIs below $25k, 0.8% for AGIs $25k-50k, 0.8% for AGIs $50k-75k, 0.5% for AGIs $75k-100k, 0.7% for AGIs $100k-200k)
Ordinary dividends: $1,661 (reported on 16.4% of returns)
Here:
$1,661
State:
$7,410
(% of AGI for various income ranges: 0.5% for AGIs below $25k, 0.5% for AGIs $25k-50k, 0.4% for AGIs $50k-75k, 0.4% for AGIs $75k-100k, 0.6% for AGIs $100k-200k)
Net capital gain/loss in AGI: +$5,412 (reported on 15.5% of returns)
Here:
+$5,412
State:
+$11,579
(% of AGI for various income ranges: 0.3% for AGIs below $25k, 0.8% for AGIs $50k-75k, 2.0% for AGIs $75k-100k, 2.4% for AGIs $100k-200k)
Profit/loss from business: +$5,733 (reported on 16.4% of returns)
Here:
+$5,733
State:
+$11,688
(% of AGI for various income ranges: 4.5% for AGIs below $25k, 2.4% for AGIs $25k-50k, 2.8% for AGIs $50k-75k, 1.8% for AGIs $75k-100k, 0.2% for AGIs $100k-200k)
Taxable individual retirement arrangement distribution: $9,767 (reported on 10.9% of returns)
64454:
$9,767
Missouri:
$14,773
(% of AGI for various income ranges: 3.4% for AGIs $25k-50k, 2.3% for AGIs $50k-75k, 1.6% for AGIs $75k-100k, 1.6% for AGIs $100k-200k)
Total itemized deductions: $18,634 (20% of AGI, reported on 31.8% of returns)
Here:
$18,634
State:
$22,730
Here:
19.6% of AGI
State:
19.2% of AGI
(% of AGI for various income ranges: 8.1% for AGIs below $25k, 7.4% for AGIs $25k-50k, 8.8% for AGIs $50k-75k, 11.3% for AGIs $75k-100k, 13.1% for AGIs $100k-200k)
Charity contributions: $3,219 (reported on 23.6% of returns)
Here:
$3,219
State:
$4,745
(% of AGI for various income ranges: 1.1% for AGIs $25k-50k, 0.9% for AGIs $50k-75k, 1.5% for AGIs $75k-100k, 1.9% for AGIs $100k-200k)
Taxes paid: $6,346 (reported on 31.8% of returns)
64454:
$6,346
State:
$8,399
(% of AGI for various income ranges: 1.3% for AGIs below $25k, 1.8% for AGIs $25k-50k, 2.4% for AGIs $50k-75k, 3.5% for AGIs $75k-100k, 5.5% for AGIs $100k-200k)
Earned income credit: $2,075 (reported on 14.5% of returns)
Here:
$2,075
State:
$2,288
(% of AGI for various income ranges: 5.9% for AGIs below $25k, 1.2% for AGIs $25k-50k)
Percentage of individuals using paid preparers for their 2012 taxes: 58.2%
Here:
58%
State:
55%
(% for various income ranges: 50.0% for AGIs below $25k, 52.0% for AGIs $25k-50k, 61.9% for AGIs $50k-75k, 66.7% for AGIs $75k-100k, 73.3% for AGIs $100k-200k)
Averages for the 2004 tax year for zip code 64454, filed in 2005:
Average Adjusted Gross Income (AGI) in 2004: $42,132 (Individual Income Tax Returns)
Here:
$42,132
State:
$44,591
Salary/wage: $40,422 (reported on 84.5% of returns)
Here:
$40,422
State:
$38,941
(% of AGI for various income ranges: 102.8% for AGIs below $10k, 70.7% for AGIs $10k-25k, 79.9% for AGIs $25k-50k, 90.8% for AGIs $50k-75k, 87.9% for AGIs $75k-100k, 67.1% for AGIs over 100k)
Taxable interest for individuals: $1,585 (reported on 50.0% of returns)
This zip code:
$1,585
Missouri:
$1,801
(% of AGI for various income ranges: 9.1% for AGIs below $10k, 2.7% for AGIs $10k-25k, 1.9% for AGIs $25k-50k, 0.8% for AGIs $50k-75k, 0.6% for AGIs $75k-100k, 3.4% for AGIs over 100k)
Taxable dividends: $951 (reported on 20.2% of returns)
Here:
$951
State:
$3,677
(% of AGI for various income ranges: 1.8% for AGIs below $10k, 0.6% for AGIs $10k-25k, 0.6% for AGIs $25k-50k, 0.2% for AGIs $50k-75k, 0.4% for AGIs $75k-100k, 0.5% for AGIs over 100k)
Net capital gain/loss: +$4,939 (reported on 14.8% of returns)
Here:
+$4,939
State:
+$8,915
(% of AGI for various income ranges: -0.5% for AGIs below $10k, 0.1% for AGIs $10k-25k, -0.2% for AGIs $25k-50k, -0.1% for AGIs $50k-75k, 0.5% for AGIs $75k-100k, 7.7% for AGIs over 100k)
Profit/loss from business: +$5,005 (reported on 16.6% of returns)
Here:
+$5,005
State:
+$9,793
(% of AGI for various income ranges: 11.0% for AGIs below $10k, 5.8% for AGIs $10k-25k, 4.0% for AGIs $25k-50k, 0.8% for AGIs $50k-75k, 0.9% for AGIs $75k-100k)
IRA payment deduction: $3,036 (reported on 2.5% of returns)
64454:
$3,036
Missouri:
$2,972
Total itemized deductions: $15,396 (21% of AGI, reported on 29.4% of returns)
Here:
$15,396
State:
$18,261
Here:
21.2% of AGI
State:
20.5% of AGI
(% of AGI for various income ranges: 9.1% for AGIs $10k-25k, 9.8% for AGIs $25k-50k, 10.6% for AGIs $50k-75k, 11.6% for AGIs $75k-100k, 12.7% for AGIs over 100k)
Charity contributions deductions: $2,919 (4% of AGI, reported on 23.4% of returns)
Here:
$2,919
State:
$3,665
Here:
3.9% of AGI
State:
3.9% of AGI
(% of AGI for various income ranges: 0.5% for AGIs $10k-25k, 1.4% for AGIs $25k-50k, 1.4% for AGIs $50k-75k, 1.4% for AGIs $75k-100k, 2.8% for AGIs over 100k)
Total tax: $5,029 (reported on 78.2% of returns)
64454:
$5,029
State:
$6,999
(% of AGI for various income ranges: 3.2% for AGIs below $10k, 4.5% for AGIs $10k-25k, 6.9% for AGIs $25k-50k, 7.9% for AGIs $50k-75k, 10.5% for AGIs $75k-100k, 14.9% for AGIs over 100k)
Earned income credit: $1,403 (reported on 12.1% of returns)
Here:
$1,403
State:
$1,728
Percentage of individuals using paid preparers for their 2004 taxes: 68.7%
Here:
69%
State:
62%
(% for various income ranges: 53.8% for AGIs below $10k, 68.0% for AGIs $10k-25k, 71.8% for AGIs $25k-50k, 73.6% for AGIs $50k-75k, 73.7% for AGIs $75k-100k, 81.6% for AGIs over 100k)
Household received Food Stamps/SNAP in the past 12 months: 53 Household did not receive Food Stamps/SNAP in the past 12 months: 923
Women who had a birth in the past 12 months: 12 (12 now married, 0 unmarried) Women who did not have a birth in the past 12 months: 563 (305 now married, 256 unmarried)
Housing units in zip code 64454 with a mortgage: 564 (29 second mortgage, 23 both second mortgage and home equity loan) Houses without a mortgage: 17
Median monthly owner costs for units with a mortgage: $1,474 Median monthly owner costs for units without a mortgage: $557
Residents with income below the poverty level in 2022:
This zip code:
11.4%
Whole state:
13.2%
Residents with income below 50% of the poverty level in 2022:
This zip code:
1.8%
Whole state:
6.8%
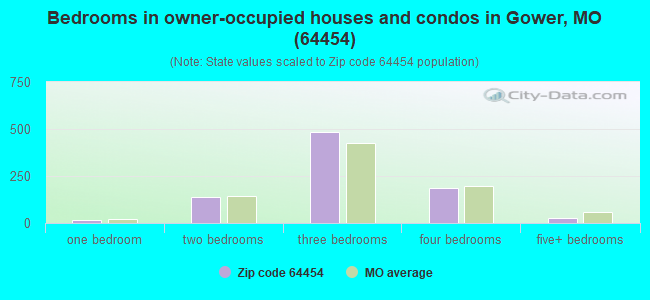
Median number of rooms in houses and condos:
Here:
6.3
State:
6.4
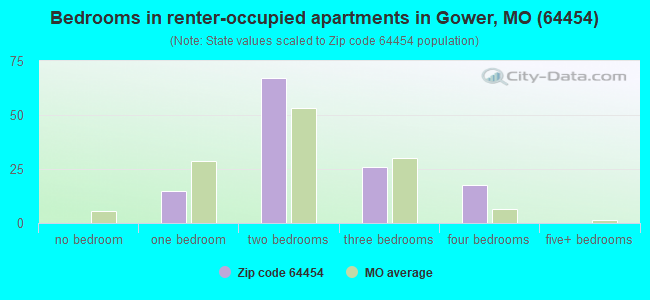
Median number of rooms in apartments:
Here:
4.9
State:
4.4
Notable locations in this zip code not listed on our city pages
Cemeteries: Number 6 Cemetery (1), Hebron Cemetery (2), Mount Carmel Cemetery (3), Bretz Cemetery (4), New Harmony Cemetery (5), Allen Cemetery (6), Antioch Cemetery (7). Display/hide their locations on the map
Streams, rivers, and creeks: Malden Creek (A), Crabapple Branch (B), Belcher Branch (C), Castile Creek (D), Jenkins Branch (E), McGuire Branch (F). Display/hide their locations on the map
In group quarters: 76 (-1 institutionalized population)
Size of family households: 257 2-persons, 148 3-persons, 181 4-persons, 75 5-persons, 6 6-persons, 4 7-or-more-persons
Size of nonfamily households: 207 1-person, 89 2-persons
562 married couples with children.
145 single-parent households (46 men, 99 women).
99.9% of residents of 64454 zip code speak English at home.
0.1% of residents speak Spanish at home (100% very well).
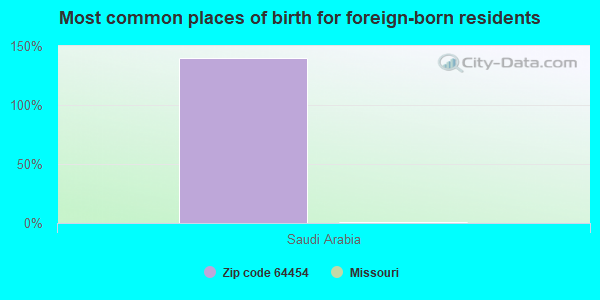
Foreign born population: 5 (0.2%) (100.0% of them are naturalized citizens)
This zip code:
0.2%
Whole state:
4.1%
140%Saudi Arabia
32%German
25%English
15%American
7%Irish
5%Polish
2%European
2%Scotch-Irish
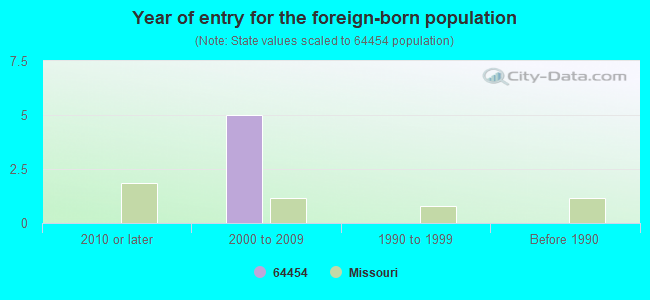
Year of entry for the foreign-born population
02010 or later
52000 to 2009
01990 to 1999
0Before 1990
Facilities with environmental interests located in this zip code:
AIRY ACRES MOBILE HOME PARK (9000 NORTHWEST 268TH STREET in GOWER, MO)
STATE MASTER (Missouri monitoring and compilance) - PCS-MO0117897, NPDES NON-MAJOR National Pollutant Discharge Elimination System NON-MAJOR (Tracking pollutant discharge elimination systems) - permit COMMUNITY WATER SYSTEM (SDWIS) Business SIC classification: OPERATORS OF RESIDENTIAL MOBILE HOME SITES Organizations: RALPH KELLER (CONTACT/OWNER)
Alternative names: AIRY ACRES MHP, AIRY ACRES MOBILE HOME CT, RALPH KELLER
GOWER WWTP (94 NORTH 4TH STREET in GOWER, MO)
STATE MASTER (Missouri monitoring and compilance) - PCS-MO0099287, NPDES NON-MAJOR National Pollutant Discharge Elimination System NON-MAJOR (Tracking pollutant discharge elimination systems) - permit Business SIC classification: SEWERAGE SYSTEMS
RICKS HEATING & AIRCONDITIONING (12230 SE MT MORIAH ROAD in GOWER, MO)
AIR MINOR (AIRS/AFS) Business SIC classification: PLUMBING, HEATING AND AIR-CONDITIONING
Housing units lacking complete plumbing facilities: 4.6% Housing units lacking complete kitchen facilities: 0.6%
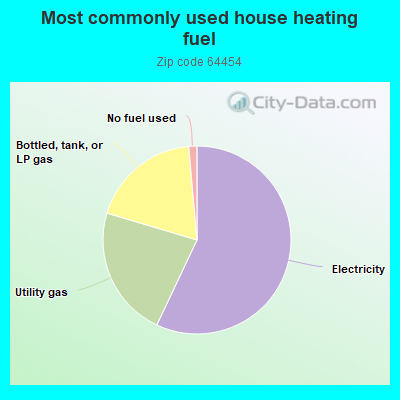
57.1%Electricity
22.6%Utility gas
19.0%Bottled, tank, or LP gas
1.4%No fuel used
Population in 1990: 2,115. Population change in the 1990s: +301 (+14.2%).
Place of birth for U.S.-born residents:
This state: 1,979
Northeast: 84
Midwest: 335
South: 107
West: 81
57% of the 64454 zip code residents lived in the same house 5 years ago. Out of people who lived in different houses, 39% lived in this county. Out of people who lived in different counties, 50% lived in Missouri.
93% of the 64454 zip code residents lived in the same house 1 year ago. Out of people who lived in different houses, 18% moved from this county. Out of people who lived in different houses, 65% moved from different county within same state. Out of people who lived in different houses, 23% moved from different state.
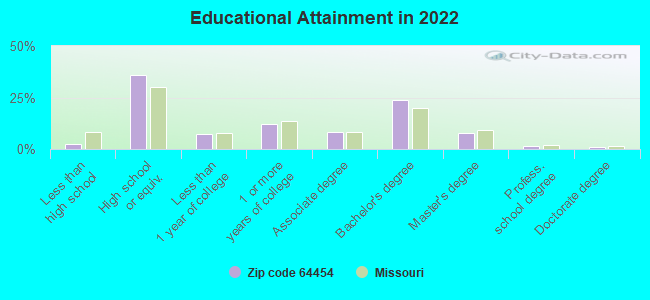
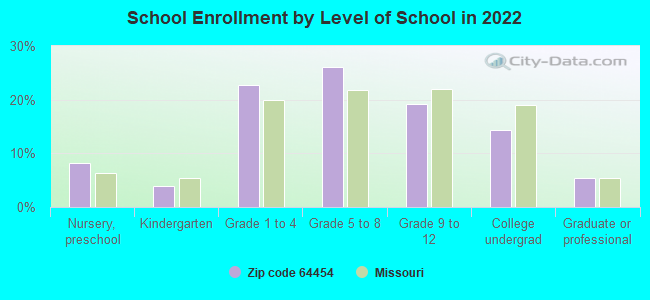
Private vs. public school enrollment:
Students in private schools in grades 1 to 8 (elementary and middle school): 15
Here:
4.9%
Missouri:
15.4%
Students in private schools in grades 9 to 12 (high school):
Here:
0.0%
Missouri:
13.9%
Students in private undergraduate colleges: 32
Here:
34.3%
Missouri:
22.6%
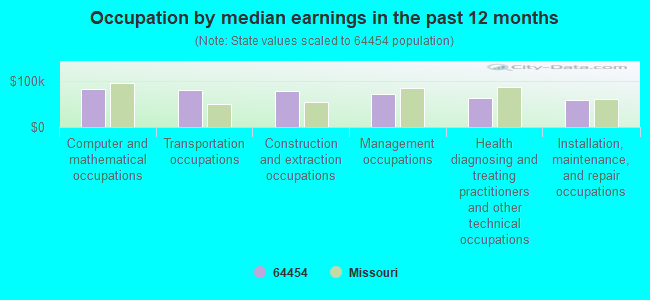
Occupation by median earnings in the past 12 months ($)
83,227Computer and mathematical occupations
81,689Transportation occupations
79,547Construction and extraction occupations
71,381Management occupations
63,779Health diagnosing and treating practitioners and other technical occupations
58,604Installation, maintenance, and repair occupations
Top industries in this zip code by the number of employees in 2005:
Health Care and Social Assistance: Nursing Care Facilities (50-99 employees: 1 establishment)
Construction: New Single-Family Housing Construction (except Operative Builders) (5-9: 2)
Health Care and Social Assistance: Child Day Care Services (5-9: 1, 1-4: 1)
Other Services (except Public Administration): Funeral Homes and Funeral Services (5-9: 1)
People in group quarters in 2010:
67 people in nursing facilities/skilled-nursing facilities
People in group quarters in 2000:
79 people in nursing homes
Fatal accident statistics in 2010:
Fatal accident count: 1
Vehicles involved in fatal accidents: 1
Fatal accidents caused by drunken drivers: 0
Fatalities: 1
Persons involved in fatal accidents: 1
Pedestrians involved in fatal accidents: 1
Home Mortgage Disclosure Act Aggregated Statistics For Year 2009 (Based on 2 partial tracts)
A) FHA, FSA/RHS & VA Home Purchase Loans
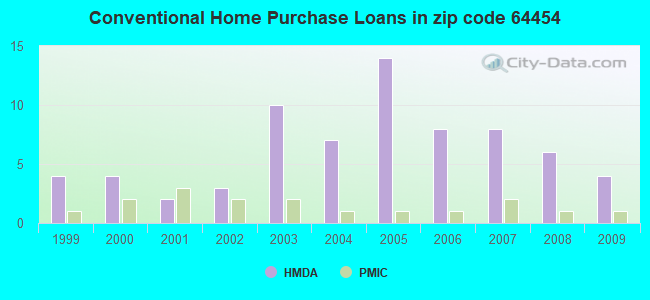
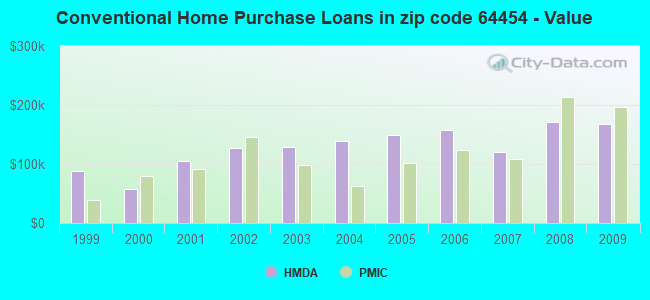
B) Conventional Home Purchase Loans
C) Refinancings
D) Home Improvement Loans
F) Non-occupant Loans on < 5 Family Dwellings (A B C & D)
Number
Average Value
Number
Average Value
Number
Average Value
Number
Average Value
Number
Average Value
LOANS ORIGINATED
1
$104,430
4
$167,482
23
$181,730
2
$49,200
2
$127,235
APPLICATIONS APPROVED, NOT ACCEPTED
0
$0
0
$0
1
$219,790
0
$0
0
$0
APPLICATIONS DENIED
1
$114,230
1
$127,800
5
$155,852
1
$10,560
0
$0
APPLICATIONS WITHDRAWN
0
$0
0
$0
6
$190,260
0
$0
0
$0
FILES CLOSED FOR INCOMPLETENESS
0
$0
0
$0
0
$0
0
$0
0
$0
Aggregated Statistics For Year 2008 (Based on 2 partial tracts)
A) FHA, FSA/RHS & VA Home Purchase Loans
B) Conventional Home Purchase Loans
C) Refinancings
D) Home Improvement Loans
F) Non-occupant Loans on < 5 Family Dwellings (A B C & D)
G) Loans On Manufactured Home Dwelling (A B C & D)
Number
Average Value
Number
Average Value
Number
Average Value
Number
Average Value
Number
Average Value
Number
Average Value
LOANS ORIGINATED
1
$158,720
6
$171,472
17
$122,148
3
$92,617
2
$105,750
0
$0
APPLICATIONS APPROVED, NOT ACCEPTED
0
$0
0
$0
3
$225,193
0
$0
0
$0
0
$0
APPLICATIONS DENIED
0
$0
1
$124,410
9
$250,077
4
$30,632
0
$0
1
$60,700
APPLICATIONS WITHDRAWN
0
$0
0
$0
2
$153,060
1
$38,080
0
$0
0
$0
FILES CLOSED FOR INCOMPLETENESS
0
$0
0
$0
1
$223,180
0
$0
0
$0
0
$0
Aggregated Statistics For Year 2007 (Based on 2 partial tracts)
B) Conventional Home Purchase Loans
C) Refinancings
D) Home Improvement Loans
F) Non-occupant Loans on < 5 Family Dwellings (A B C & D)
G) Loans On Manufactured Home Dwelling (A B C & D)
Number
Average Value
Number
Average Value
Number
Average Value
Number
Average Value
Number
Average Value
LOANS ORIGINATED
8
$119,980
12
$158,246
4
$36,002
2
$255,795
2
$70,875
APPLICATIONS APPROVED, NOT ACCEPTED
2
$85,390
3
$130,943
0
$0
0
$0
0
$0
APPLICATIONS DENIED
0
$0
9
$128,180
1
$193,020
0
$0
0
$0
APPLICATIONS WITHDRAWN
0
$0
2
$115,360
0
$0
0
$0
0
$0
FILES CLOSED FOR INCOMPLETENESS
0
$0
1
$81,060
0
$0
0
$0
0
$0
Aggregated Statistics For Year 2006 (Based on 2 partial tracts)
A) FHA, FSA/RHS & VA Home Purchase Loans
B) Conventional Home Purchase Loans
C) Refinancings
D) Home Improvement Loans
F) Non-occupant Loans on < 5 Family Dwellings (A B C & D)
G) Loans On Manufactured Home Dwelling (A B C & D)
Number
Average Value
Number
Average Value
Number
Average Value
Number
Average Value
Number
Average Value
Number
Average Value
LOANS ORIGINATED
0
$0
8
$158,105
11
$149,258
3
$58,813
1
$58,810
1
$27,140
APPLICATIONS APPROVED, NOT ACCEPTED
0
$0
1
$125,160
2
$80,490
0
$0
0
$0
1
$54,660
APPLICATIONS DENIED
1
$71,630
3
$109,580
7
$168,357
2
$85,200
0
$0
0
$0
APPLICATIONS WITHDRAWN
0
$0
2
$156,265
4
$159,660
0
$0
0
$0
0
$0
FILES CLOSED FOR INCOMPLETENESS
0
$0
1
$66,730
1
$185,480
0
$0
0
$0
0
$0
Aggregated Statistics For Year 2005 (Based on 2 partial tracts)
B) Conventional Home Purchase Loans
C) Refinancings
D) Home Improvement Loans
F) Non-occupant Loans on < 5 Family Dwellings (A B C & D)
G) Loans On Manufactured Home Dwelling (A B C & D)
Number
Average Value
Number
Average Value
Number
Average Value
Number
Average Value
Number
Average Value
LOANS ORIGINATED
14
$149,723
20
$130,744
3
$31,667
2
$118,380
1
$99,910
APPLICATIONS APPROVED, NOT ACCEPTED
3
$97,267
2
$84,070
0
$0
0
$0
0
$0
APPLICATIONS DENIED
3
$74,647
9
$106,523
2
$23,940
0
$0
2
$40,715
APPLICATIONS WITHDRAWN
2
$118,945
5
$103,826
1
$13,200
0
$0
0
$0
FILES CLOSED FOR INCOMPLETENESS
0
$0
2
$169,840
0
$0
0
$0
0
$0
Aggregated Statistics For Year 2004 (Based on 2 partial tracts)
A) FHA, FSA/RHS & VA Home Purchase Loans
B) Conventional Home Purchase Loans
C) Refinancings
D) Home Improvement Loans
F) Non-occupant Loans on < 5 Family Dwellings (A B C & D)
G) Loans On Manufactured Home Dwelling (A B C & D)
Number
Average Value
Number
Average Value
Number
Average Value
Number
Average Value
Number
Average Value
Number
Average Value
LOANS ORIGINATED
1
$138,360
7
$138,844
21
$121,645
3
$54,540
1
$35,440
2
$42,225
APPLICATIONS APPROVED, NOT ACCEPTED
0
$0
1
$128,560
3
$103,173
0
$0
0
$0
0
$0
APPLICATIONS DENIED
0
$0
3
$81,933
11
$91,954
1
$65,220
0
$0
2
$59,565
APPLICATIONS WITHDRAWN
0
$0
0
$0
8
$92,176
0
$0
0
$0
0
$0
FILES CLOSED FOR INCOMPLETENESS
0
$0
0
$0
3
$136,473
0
$0
0
$0
0
$0
Aggregated Statistics For Year 2003 (Based on 2 partial tracts)
A) FHA, FSA/RHS & VA Home Purchase Loans
B) Conventional Home Purchase Loans
C) Refinancings
D) Home Improvement Loans
F) Non-occupant Loans on < 5 Family Dwellings (A B C & D)
Number
Average Value
Number
Average Value
Number
Average Value
Number
Average Value
Number
Average Value
LOANS ORIGINATED
1
$98,770
10
$129,500
46
$121,738
3
$13,197
3
$78,417
APPLICATIONS APPROVED, NOT ACCEPTED
0
$0
1
$179,450
3
$133,457
0
$0
0
$0
APPLICATIONS DENIED
0
$0
1
$55,800
14
$105,776
2
$14,890
0
$0
APPLICATIONS WITHDRAWN
0
$0
1
$82,940
10
$94,288
0
$0
0
$0
FILES CLOSED FOR INCOMPLETENESS
0
$0
0
$0
3
$120,263
0
$0
0
$0
Aggregated Statistics For Year 2002 (Based on 2 partial tracts)
A) FHA, FSA/RHS & VA Home Purchase Loans
B) Conventional Home Purchase Loans
C) Refinancings
D) Home Improvement Loans
E) Loans on Dwellings For 5+ Families
F) Non-occupant Loans on < 5 Family Dwellings (A B C & D)
Number
Average Value
Number
Average Value
Number
Average Value
Number
Average Value
Number
Average Value
Number
Average Value
LOANS ORIGINATED
1
$78,790
3
$127,300
25
$107,747
2
$10,555
2
$308,575
1
$71,250
APPLICATIONS APPROVED, NOT ACCEPTED
0
$0
2
$134,965
3
$115,613
0
$0
0
$0
0
$0
APPLICATIONS DENIED
0
$0
1
$82,560
9
$88,386
0
$0
0
$0
0
$0
APPLICATIONS WITHDRAWN
0
$0
0
$0
4
$66,448
1
$26,390
0
$0
0
$0
FILES CLOSED FOR INCOMPLETENESS
0
$0
0
$0
3
$113,980
0
$0
0
$0
0
$0
Aggregated Statistics For Year 2001 (Based on 2 partial tracts)
B) Conventional Home Purchase Loans
C) Refinancings
D) Home Improvement Loans
Number
Average Value
Number
Average Value
Number
Average Value
LOANS ORIGINATED
2
$105,560
22
$109,775
1
$12,820
APPLICATIONS APPROVED, NOT ACCEPTED
1
$19,980
1
$134,590
0
$0
APPLICATIONS DENIED
6
$44,675
7
$75,184
1
$62,200
APPLICATIONS WITHDRAWN
1
$16,970
5
$64,466
0
$0
FILES CLOSED FOR INCOMPLETENESS
0
$0
1
$187,750
0
$0
Aggregated Statistics For Year 2000 (Based on 2 partial tracts)
A) FHA, FSA/RHS & VA Home Purchase Loans
B) Conventional Home Purchase Loans
C) Refinancings
D) Home Improvement Loans
F) Non-occupant Loans on < 5 Family Dwellings (A B C & D)
Number
Average Value
Number
Average Value
Number
Average Value
Number
Average Value
Number
Average Value
LOANS ORIGINATED
1
$103,680
4
$57,492
8
$109,754
4
$29,782
1
$105,180
APPLICATIONS APPROVED, NOT ACCEPTED
0
$0
0
$0
2
$50,520
0
$0
0
$0
APPLICATIONS DENIED
0
$0
2
$32,420
2
$64,655
1
$16,590
0
$0
APPLICATIONS WITHDRAWN
0
$0
1
$70,120
2
$53,910
1
$7,540
0
$0
FILES CLOSED FOR INCOMPLETENESS
0
$0
0
$0
0
$0
0
$0
0
$0
Aggregated Statistics For Year 1999 (Based on 1 partial tract)
A) FHA, FSA/RHS & VA Home Purchase Loans
B) Conventional Home Purchase Loans
C) Refinancings
D) Home Improvement Loans
F) Non-occupant Loans on < 5 Family Dwellings (A B C & D)
Detailed PMIC statistics for the following Tracts:0027.00
2002 - 2018 National Fire Incident Reporting System (NFIRS) incidents
According to the data from the years 2002 - 2018 the average number of fire incidents per year is 24. The highest number of fire incidents - 42 took place in 2002, and the least - 3 in 2004. The data has a declining trend.
When looking into fire subcategories, the most incidents belonged to: Outside Fires (53.3%), and Structure Fires (29.5%).
Fire incident types reported to NFIRS in Zip Code 64454


 Nearest zip codes: 64444, 64401, 64492, 64477, 64490, 64443.
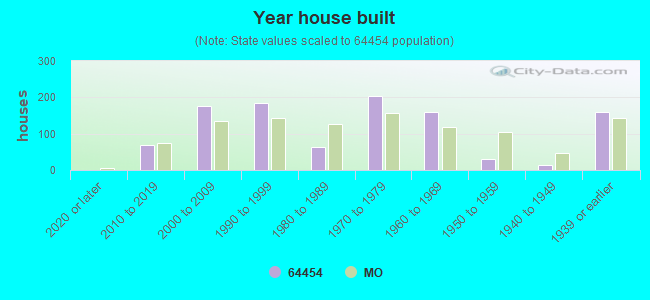


 According to the data from the years 2002 - 2018 the average number of fire incidents per year is 24. The highest number of fire incidents - 42 took place in 2002, and the least - 3 in 2004. The data has a declining trend.
 When looking into fire subcategories, the most incidents belonged to: Outside Fires (53.3%), and Structure Fires (29.5%).