Estimated zip code population in 2022: 543 Zip code population in 2010: 556 Zip code population in 2000: 787
Houses and condos: 286 Renter-occupied apartments: 61
% of renters here:
24%
State:
32%
March 2022 cost of living index in zip code 67008: 79.6 (low, U.S. average is 100)
Land area: 123.0 sq. mi. Water area: 0.1 sq. mi.
Population density: 4 people per square mile
(very low).
OSM Map
General Map
Google Map
MSN Map
OSM Map
General Map
Google Map
MSN Map
OSM Map
General Map
Google Map
MSN Map
OSM Map
General Map
Google Map
MSN Map
Please wait while loading the map...
Real estate property taxes paid for housing units in 2022:
This zip code:
1.4% ($2,237)
Kansas:
1.2% ($2,578)
Median real estate property taxes paid for housing units with mortgages in 2022: $2,421 (0.8%) Median real estate property taxes paid for housing units with no mortgage in 2022: $1,988 (1.7%)
Business Search- 14 Million verified businesses
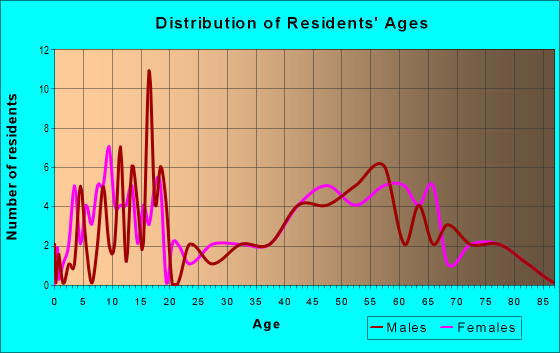
Males: 222
(41.0%)
Females: 320
(59.0%)
For population 25 years and over in 67008:
High school or higher: 91.2%
Bachelor's degree or higher: 25.5%
Graduate or professional degree: 5.0%
Unemployed: 1.1%
Mean travel time to work (commute): 26.6 minutes
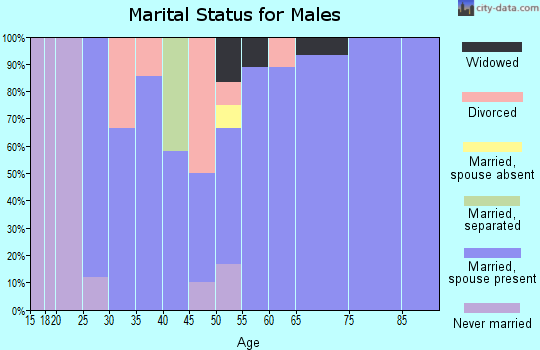
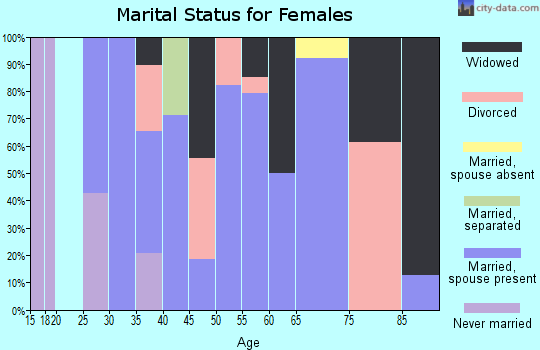
For population 15 years and over in 67008:
Never married: 19.1%
Now married: 58.4%
Separated: 0.4%
Widowed: 8.9%
Divorced: 13.3%
Zip code 67008 compared to state average:
Unemployed percentage significantly below state average.
Black race population percentage significantly below state average.
Hispanic race population percentage significantly below state average.
Median age significantly above state average.
Foreign-born population percentage significantly below state average.
Length of stay since moving in significantly above state average.
Estimated median house/condo value in 2022: $156,178
67008:
$156,178
Kansas:
$206,600
According to our research of Kansas and other state lists, there was 1 registered sex offender living in 67008 zip code as of May 21, 2024. The ratio of all residents to sex offenders in zip code 67008 is 546 to 1. The ratio of registered sex offenders to all residents in this zip code is lower than the state average.
Median resident age:
This zip code:
49.2 years
Kansas median age:
37.6 years
Average household size:
This zip code:
2.1 people
Kansas:
2.4 people
Averages for the 2020 tax year for zip code 67008, filed in 2021:
Average Adjusted Gross Income (AGI) in 2020: $50,316 (Individual Income Tax Returns)
Here:
$50,316
State:
$72,721
Salary/wage: $39,108 (reported on 68.4% of returns)
Here:
$39,108
State:
$58,641
(% of AGI for various income ranges: 1045.0% for AGIs below $25k, 2975.0% for AGIs $25k-50k, 8690.0% for AGIs $50k-75k)
Taxable interest for individuals: $1,767 (reported on 31.6% of returns)
This zip code:
$1,767
Kansas:
$1,625
(% of AGI for various income ranges: 17.5% for AGIs below $25k, 247.5% for AGIs $50k-75k)
Ordinary dividends: $3,433 (reported on 15.8% of returns)
Here:
$3,433
State:
$7,290
(% of AGI for various income ranges: 257.5% for AGIs $25k-50k)
Net capital gain/loss in AGI: +$6,100 (reported on 21.1% of returns)
Here:
+$6,100
State:
+$20,511
(% of AGI for various income ranges: 610.0% for AGIs $50k-75k)
Profit/loss from business: +$6,000 (reported on 15.8% of returns)
Here:
+$6,000
State:
+$13,852
(% of AGI for various income ranges: 450.0% for AGIs $25k-50k)
Earned income credit: $2,367 (reported on 15.8% of returns)
Here:
$2,367
State:
$2,267
(% of AGI for various income ranges: 177.5% for AGIs below $25k)
Percentage of individuals using paid preparers for their 2020 taxes: 84.2%
Here:
84%
State:
95%
(% for various income ranges: 85.7% for AGIs below $25k, 80.0% for AGIs $25k-50k, 80.0% for AGIs $50k-75k, 100.0% for AGIs $100k-200k)
Averages for the 2012 tax year for zip code 67008, filed in 2013:
Average Adjusted Gross Income (AGI) in 2012: $46,785 (Individual Income Tax Returns)
Here:
$46,785
State:
$60,095
Salary/wage: $37,743 (reported on 70.0% of returns)
Here:
$37,743
State:
$48,770
(% of AGI for various income ranges: 57.5% for AGIs below $25k, 66.2% for AGIs $25k-50k, 71.3% for AGIs $50k-75k, 47.1% for AGIs $75k-100k)
Taxable interest for individuals: $238 (reported on 40.0% of returns)
This zip code:
$238
Kansas:
$1,506
(% of AGI for various income ranges: 1.0% for AGIs below $25k, 0.4% for AGIs $25k-50k)
Ordinary dividends: $325 (reported on 20.0% of returns)
Here:
$325
State:
$6,093
Net capital gain/loss in AGI: +$1,800 (reported on 20.0% of returns)
Here:
+$1,800
State:
+$14,598
Profit/loss from business: +$2,900 (reported on 15.0% of returns)
Here:
+$2,900
State:
+$12,554
Taxable individual retirement arrangement distribution: $11,350 (reported on 10.0% of returns)
67008:
$11,350
Kansas:
$14,098
Total itemized deductions: $14,500 (20% of AGI, reported on 25.0% of returns)
Here:
$14,500
State:
$23,678
Here:
19.7% of AGI
State:
18.9% of AGI
Charity contributions: $4,367 (reported on 15.0% of returns)
Here:
$4,367
State:
$5,321
Taxes paid: $6,650 (reported on 20.0% of returns)
67008:
$6,650
State:
$9,548
Earned income credit: $2,633 (reported on 15.0% of returns)
Here:
$2,633
State:
$2,212
(% of AGI for various income ranges: 7.2% for AGIs below $25k)
Percentage of individuals using paid preparers for their 2012 taxes: 70.0%
Here:
70%
State:
56%
(% for various income ranges: 62.5% for AGIs below $25k, 120.0% for AGIs $25k-50k, 75.0% for AGIs $75k-100k)
Averages for the 2004 tax year for zip code 67008, filed in 2005:
Average Adjusted Gross Income (AGI) in 2004: $33,570 (Individual Income Tax Returns)
Here:
$33,570
State:
$45,726
Salary/wage: $32,686 (reported on 78.5% of returns)
Here:
$32,686
State:
$40,112
(% of AGI for various income ranges: 118.8% for AGIs below $10k, 68.5% for AGIs $10k-25k, 79.9% for AGIs $25k-50k, 80.7% for AGIs $50k-75k, 69.0% for AGIs $75k-100k)
Taxable interest for individuals: $417 (reported on 48.4% of returns)
This zip code:
$417
Kansas:
$1,749
(% of AGI for various income ranges: 5.6% for AGIs below $10k, 2.2% for AGIs $10k-25k, 0.4% for AGIs $25k-50k, 0.1% for AGIs $50k-75k, 0.2% for AGIs $75k-100k)
Taxable dividends: $340 (reported on 21.1% of returns)
Here:
$340
State:
$3,066
Net capital gain/loss: +$1,698 (reported on 19.3% of returns)
Here:
+$1,698
State:
+$7,555
Profit/loss from business: +$2,286 (reported on 22.0% of returns)
Here:
+$2,286
State:
+$9,571
(% of AGI for various income ranges: 18.3% for AGIs below $10k, 8.6% for AGIs $10k-25k, -0.3% for AGIs $25k-50k, 0.3% for AGIs $50k-75k)
Total itemized deductions: $13,725 (26% of AGI, reported on 17.9% of returns)
Here:
$13,725
State:
$18,779
Here:
25.6% of AGI
State:
20.5% of AGI
Charity contributions deductions: $2,231 (3% of AGI, reported on 11.7% of returns)
Here:
$2,231
State:
$3,892
Here:
3.2% of AGI
State:
4.0% of AGI
Total tax: $4,112 (reported on 71.7% of returns)
67008:
$4,112
State:
$7,203
(% of AGI for various income ranges: 6.1% for AGIs below $10k, 4.6% for AGIs $10k-25k, 6.1% for AGIs $25k-50k, 9.1% for AGIs $50k-75k, 13.2% for AGIs $75k-100k)
Earned income credit: $1,689 (reported on 20.2% of returns)
Here:
$1,689
State:
$1,674
Percentage of individuals using paid preparers for their 2004 taxes: 70.4%
Here:
70%
State:
63%
(% for various income ranges: 75.0% for AGIs below $10k, 75.5% for AGIs $10k-25k, 64.5% for AGIs $25k-50k, 64.3% for AGIs $50k-75k, 70.8% for AGIs $75k-100k)
Household received Food Stamps/SNAP in the past 12 months: 20 Household did not receive Food Stamps/SNAP in the past 12 months: 240
Women who had a birth in the past 12 months: 9 (9 now married, 0 unmarried) Women who did not have a birth in the past 12 months: 115 (60 now married, 54 unmarried)
Housing units in zip code 67008 with a mortgage: 92 (2 second mortgage) Median monthly owner costs for units with a mortgage: $1,707 Median monthly owner costs for units without a mortgage: $378
Residents with income below the poverty level in 2022:
This zip code:
4.7%
Whole state:
12.0%
Residents with income below 50% of the poverty level in 2022:
This zip code:
3.0%
Whole state:
6.4%
Median number of rooms in houses and condos:
Here:
6.7
State:
6.9
Median number of rooms in apartments:
Here:
5.5
State:
4.4
Notable locations in this zip code not listed on our city pages
Notable locations in zip code 67008: Atlanta Wastewater Treatment Plant (A), Ophir (B), Pine Grove (C), Cowley County Fire District 2 Atlanta (D). Display/hide their locations on the map
Churches in zip code 67008 include: Prairie View Church (A), Timber Creek Friends Church (B), Atlanta Christian Church (C). Display/hide their locations on the map
Size of family households: 112 2-persons, 52 3-persons, 6 4-persons, 8 7-or-more-persons
Size of nonfamily households: 74 1-person, 7 2-persons
81 married couples with children.
6 single-parent households (3 men, 3 women).
100.8% of residents of 67008 zip code speak English at home.
Foreign born population: 3 (0.6%) (32.6% of them are naturalized citizens)
This zip code:
0.6%
Whole state:
7.1%
67%Bolivia
31%American
18%German
7%Scotch-Irish
5%English
3%Italian
3%Welsh
2%Irish
Year of entry for the foreign-born population
02010 or later
02000 to 2009
11990 to 1999
21Before 1990
Facilities with environmental interests located in this zip code:
VALLEY COOP, INC. (207 OAK in ATLANTA, KS)
AIR MINOR (AIRS/AFS) STATE MASTER (Kansas Facility Profiler) - ISTEPS-03500008, AIR PROGRAM Business SIC classification: GRAIN AND FIELD BEANS Business NAICS classification: GRAIN AND FIELD BEAN WHOLESALERS.
AT&T (RR in ATLANTA, KS)
(Resource Conservation and Recovery Act (tracking hazardous waste)) Organizations: AMERICAN TEL & TEL CO LONG LINES (CONTACT/OWNER)
ATLANTA WASTE WATER TREATMENT PLANT C/O CITY HALL (302 MAIN STREET in ATLANTA, KS)
National Pollutant Discharge Elimination System NON-MAJOR (Tracking pollutant discharge elimination systems) - permit Business SIC classification: SEWERAGE SYSTEMS Organizations: ATLANTA, CITY OF (CONTACT/OWNER)
Alternative names: ATLANTA MUN WWTP, CITY OF ATLANTA
CITY OF ATLANTA LANDFILL C/O CITY HALL (302 MAIN STREET in ATLANTA, KS)
CRITERIA AND HAZARDOUS AIR POLLUTANT INVENTORY (Inventory of air pollution sources) Business SIC classification: REFUSE SYSTEMS Business NAICS classification: SOLID WASTE LANDFILL.
Housing units lacking complete plumbing facilities: 5.1% Housing units lacking complete kitchen facilities: 3.2%
37.0%Electricity
34.2%Bottled, tank, or LP gas
17.3%Utility gas
7.9%Wood
3.9%Other fuel
Population in 1990: 320. Population change in the 1990s: +467 (+145.9%).
Place of birth for U.S.-born residents:
This state: 381
Northeast: 11
Midwest: 31
South: 87
West: 4
62% of the 67008 zip code residents lived in the same house 5 years ago. Out of people who lived in different houses, 47% lived in this county. Out of people who lived in different counties, 50% lived in Kansas.
95% of the 67008 zip code residents lived in the same house 1 year ago. Out of people who lived in different houses, 5% moved from this county. Out of people who lived in different houses, 95% moved from different county within same state. Out of people who lived in different houses, 5% moved from different state.
Private vs. public school enrollment:
Students in private schools in grades 1 to 8 (elementary and middle school):
Here:
0.0%
Kansas:
14.1%
Students in private schools in grades 9 to 12 (high school):
Here:
0.0%
Kansas:
10.8%
Students in private undergraduate colleges:
Here:
0.0%
Kansas:
15.4%
Occupation by median earnings in the past 12 months ($)
103,253Management occupations
56,880Health diagnosing and treating practitioners and other technical occupations
45,762Building and grounds cleaning and maintenance occupations
44,641Construction and extraction occupations
9,962Sales and related occupations
9,557Office and administrative support occupations
Top industries in this zip code by the number of employees in 2005:
Other Services (except Public Administration): Other Personal and Household Goods Repair and Maintenance (5-9 employees: 1 establishment)
Other Services (except Public Administration): Religious Organizations (1-4: 3)
Mining: Crude Petroleum and Natural Gas Extraction (1-4: 2)
Administrative and Support and Waste Management and Remediation Services: Employment Placement Agencies (1-4: 1)
Finance and Insurance: Mortgage and Nonmortgage Loan Brokers (1-4: 1)
Finance and Insurance: Commercial Banking (1-4: 1)
Administrative and Support and Waste Management and Remediation Services: Landscaping Services (1-4: 1)
Home Mortgage Disclosure Act Aggregated Statistics For Year 2009 (Based on 2 partial tracts)
A) FHA, FSA/RHS & VA Home Purchase Loans
B) Conventional Home Purchase Loans
C) Refinancings
D) Home Improvement Loans
F) Non-occupant Loans on < 5 Family Dwellings (A B C & D)
G) Loans On Manufactured Home Dwelling (A B C & D)
Number
Average Value
Number
Average Value
Number
Average Value
Number
Average Value
Number
Average Value
Number
Average Value
LOANS ORIGINATED
9
$122,990
10
$122,614
47
$129,494
7
$23,389
5
$98,828
3
$64,660
APPLICATIONS APPROVED, NOT ACCEPTED
0
$0
4
$98,915
3
$171,433
1
$52,790
2
$139,400
2
$54,280
APPLICATIONS DENIED
1
$98,470
5
$102,624
17
$117,488
3
$60,110
1
$95,510
5
$84,946
APPLICATIONS WITHDRAWN
2
$118,045
1
$121,610
9
$113,960
1
$21,950
1
$27,880
2
$103,810
FILES CLOSED FOR INCOMPLETENESS
1
$90,760
0
$0
2
$126,650
0
$0
0
$0
0
$0
Aggregated Statistics For Year 2008 (Based on 2 partial tracts)
A) FHA, FSA/RHS & VA Home Purchase Loans
B) Conventional Home Purchase Loans
C) Refinancings
D) Home Improvement Loans
F) Non-occupant Loans on < 5 Family Dwellings (A B C & D)
G) Loans On Manufactured Home Dwelling (A B C & D)
Number
Average Value
Number
Average Value
Number
Average Value
Number
Average Value
Number
Average Value
Number
Average Value
LOANS ORIGINATED
15
$102,189
17
$108,137
29
$115,899
8
$41,524
7
$48,557
2
$64,360
APPLICATIONS APPROVED, NOT ACCEPTED
0
$0
1
$85,420
5
$102,504
1
$20,760
1
$102,030
1
$129,910
APPLICATIONS DENIED
1
$89,570
6
$97,680
15
$100,291
8
$20,465
2
$32,925
6
$48,840
APPLICATIONS WITHDRAWN
1
$96,690
2
$90,165
5
$143,080
1
$121,610
0
$0
1
$61,100
FILES CLOSED FOR INCOMPLETENESS
1
$29,070
1
$10,680
2
$116,860
0
$0
0
$0
0
$0
Aggregated Statistics For Year 2007 (Based on 2 partial tracts)
A) FHA, FSA/RHS & VA Home Purchase Loans
B) Conventional Home Purchase Loans
C) Refinancings
D) Home Improvement Loans
E) Loans on Dwellings For 5+ Families
F) Non-occupant Loans on < 5 Family Dwellings (A B C & D)
G) Loans On Manufactured Home Dwelling (A B C & D)
Number
Average Value
Number
Average Value
Number
Average Value
Number
Average Value
Number
Average Value
Number
Average Value
Number
Average Value
LOANS ORIGINATED
5
$90,760
36
$105,128
31
$105,054
12
$34,900
1
$180,930
4
$45,528
5
$61,218
APPLICATIONS APPROVED, NOT ACCEPTED
1
$78,300
4
$86,310
5
$114,488
1
$11,270
0
$0
0
$0
2
$77,115
APPLICATIONS DENIED
2
$84,235
9
$114,422
15
$133,747
5
$33,220
0
$0
1
$35,590
5
$96,692
APPLICATIONS WITHDRAWN
0
$0
3
$125,957
11
$122,846
1
$56,950
0
$0
0
$0
1
$143,550
FILES CLOSED FOR INCOMPLETENESS
1
$84,830
0
$0
1
$26,690
1
$109,150
0
$0
0
$0
0
$0
Aggregated Statistics For Year 2006 (Based on 2 partial tracts)
A) FHA, FSA/RHS & VA Home Purchase Loans
B) Conventional Home Purchase Loans
C) Refinancings
D) Home Improvement Loans
F) Non-occupant Loans on < 5 Family Dwellings (A B C & D)
G) Loans On Manufactured Home Dwelling (A B C & D)
Number
Average Value
Number
Average Value
Number
Average Value
Number
Average Value
Number
Average Value
Number
Average Value
LOANS ORIGINATED
8
$76,820
37
$94,351
28
$97,285
9
$29,528
5
$34,286
2
$38,855
APPLICATIONS APPROVED, NOT ACCEPTED
0
$0
5
$89,692
5
$101,794
1
$24,320
0
$0
1
$22,540
APPLICATIONS DENIED
1
$51,020
9
$64,396
28
$103,598
7
$27,287
2
$61,990
4
$35,295
APPLICATIONS WITHDRAWN
1
$37,370
6
$105,787
12
$93,182
1
$17,800
1
$40,930
1
$32,630
FILES CLOSED FOR INCOMPLETENESS
0
$0
0
$0
2
$89,575
0
$0
0
$0
0
$0
Aggregated Statistics For Year 2005 (Based on 2 partial tracts)
A) FHA, FSA/RHS & VA Home Purchase Loans
B) Conventional Home Purchase Loans
C) Refinancings
D) Home Improvement Loans
F) Non-occupant Loans on < 5 Family Dwellings (A B C & D)
G) Loans On Manufactured Home Dwelling (A B C & D)
Number
Average Value
Number
Average Value
Number
Average Value
Number
Average Value
Number
Average Value
Number
Average Value
LOANS ORIGINATED
5
$93,370
27
$88,299
31
$91,774
12
$22,344
5
$69,048
9
$57,804
APPLICATIONS APPROVED, NOT ACCEPTED
1
$168,470
7
$59,236
8
$110,484
0
$0
0
$0
4
$69,108
APPLICATIONS DENIED
0
$0
9
$58,727
31
$86,588
9
$65,713
2
$37,370
14
$68,387
APPLICATIONS WITHDRAWN
1
$27,880
4
$123,535
18
$100,514
2
$207,620
2
$39,450
1
$85,420
FILES CLOSED FOR INCOMPLETENESS
0
$0
1
$123,980
5
$123,742
1
$35,000
0
$0
0
$0
Aggregated Statistics For Year 2004 (Based on 2 partial tracts)
A) FHA, FSA/RHS & VA Home Purchase Loans
B) Conventional Home Purchase Loans
C) Refinancings
D) Home Improvement Loans
F) Non-occupant Loans on < 5 Family Dwellings (A B C & D)
G) Loans On Manufactured Home Dwelling (A B C & D)
Number
Average Value
Number
Average Value
Number
Average Value
Number
Average Value
Number
Average Value
Number
Average Value
LOANS ORIGINATED
4
$99,212
28
$92,560
40
$96,069
13
$31,075
9
$55,629
1
$121,010
APPLICATIONS APPROVED, NOT ACCEPTED
0
$0
4
$47,752
8
$125,684
1
$34,410
1
$26,100
4
$46,418
APPLICATIONS DENIED
0
$0
14
$42,075
26
$103,399
6
$59,715
3
$35,393
11
$39,151
APPLICATIONS WITHDRAWN
1
$47,460
2
$98,770
13
$75,473
2
$153,935
1
$52,790
1
$48,050
FILES CLOSED FOR INCOMPLETENESS
0
$0
1
$86,010
6
$106,777
1
$53,980
1
$39,740
0
$0
Aggregated Statistics For Year 2003 (Based on 2 partial tracts)
A) FHA, FSA/RHS & VA Home Purchase Loans
B) Conventional Home Purchase Loans
C) Refinancings
D) Home Improvement Loans
F) Non-occupant Loans on < 5 Family Dwellings (A B C & D)
Number
Average Value
Number
Average Value
Number
Average Value
Number
Average Value
Number
Average Value
LOANS ORIGINATED
7
$99,657
33
$80,352
93
$93,502
5
$38,202
5
$42,710
APPLICATIONS APPROVED, NOT ACCEPTED
0
$0
10
$70,650
8
$101,956
1
$2,970
2
$36,185
APPLICATIONS DENIED
0
$0
12
$68,762
30
$98,451
3
$11,667
0
$0
APPLICATIONS WITHDRAWN
0
$0
3
$56,353
17
$95,016
1
$1,780
1
$40,340
FILES CLOSED FOR INCOMPLETENESS
0
$0
1
$160,760
1
$164,320
1
$29,660
0
$0
Aggregated Statistics For Year 1999 (Based on 1 partial tract)
A) FHA, FSA/RHS & VA Home Purchase Loans
B) Conventional Home Purchase Loans
C) Refinancings
D) Home Improvement Loans
F) Non-occupant Loans on < 5 Family Dwellings (A B C & D)
Detailed PMIC statistics for the following Tracts:0209.03
2002 - 2018 National Fire Incident Reporting System (NFIRS) incidents
According to the data from the years 2002 - 2018 the average number of fire incidents per year is 23. The highest number of fire incidents - 44 took place in 2003, and the least - 0 in 2012. The data has a declining trend.
When looking into fire subcategories, the most reports belonged to: Outside Fires (77.0%), and Structure Fires (14.4%).
Fire incident types reported to NFIRS in Zip Code 67008


 Nearest zip codes: 67019, 67072, 67131, 67074, 67039, 67023.


 According to the data from the years 2002 - 2018 the average number of fire incidents per year is 23. The highest number of fire incidents - 44 took place in 2003, and the least - 0 in 2012. The data has a declining trend.
 When looking into fire subcategories, the most reports belonged to: Outside Fires (77.0%), and Structure Fires (14.4%).