Estimated zip code population in 2022: 3,891 Zip code population in 2010: 3,884 Zip code population in 2000: 3,476
Houses and condos: 1,367 Renter-occupied apartments: 215
% of renters here:
16%
State:
32%
March 2022 cost of living index in zip code 67025: 79.8 (low, U.S. average is 100)
Land area: 114.3 sq. mi. Water area: 2.6 sq. mi.
Population density: 34 people per square mile
(very low).
OSM Map
General Map
Google Map
MSN Map
OSM Map
General Map
Google Map
MSN Map
OSM Map
General Map
Google Map
MSN Map
OSM Map
General Map
Google Map
MSN Map
Please wait while loading the map...
Real estate property taxes paid for housing units in 2022:
This zip code:
1.3% ($2,379)
Kansas:
1.2% ($2,578)
Median real estate property taxes paid for housing units with mortgages in 2022: $2,671 (1.1%) Median real estate property taxes paid for housing units with no mortgage in 2022: $1,932 (1.6%)
Estimated median house/condo value in 2022: $179,424
67025:
$179,424
Kansas:
$206,600
According to our research of Kansas and other state lists, there were 8 registered sex offenders living in 67025 zip code as of May 05, 2024. The ratio of all residents to sex offenders in zip code 67025 is 474 to 1. The ratio of registered sex offenders to all residents in this zip code is lower than the state average.
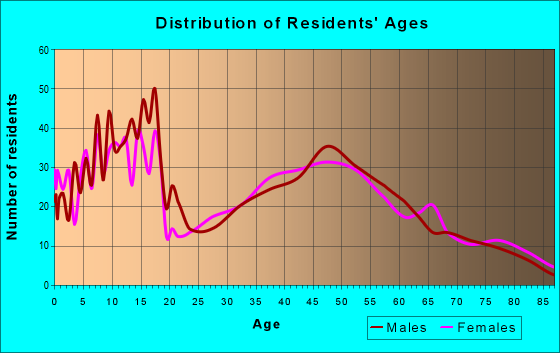
Median resident age:
This zip code:
40.0 years
Kansas median age:
37.6 years
Average household size:
This zip code:
2.9 people
Kansas:
2.4 people
Averages for the 2020 tax year for zip code 67025, filed in 2021:
Average Adjusted Gross Income (AGI) in 2020: $76,326 (Individual Income Tax Returns)
Here:
$76,326
State:
$72,721
Salary/wage: $64,686 (reported on 83.8% of returns)
Here:
$64,686
State:
$58,641
(% of AGI for various income ranges: 1235.2% for AGIs below $25k, 3741.9% for AGIs $25k-50k, 6952.6% for AGIs $50k-75k, 10269.3% for AGIs $75k-100k, 18984.5% for AGIs $100k-200k, 83660.0% for AGIs over 200k)
Taxable interest for individuals: $1,058 (reported on 43.2% of returns)
This zip code:
$1,058
Kansas:
$1,625
(% of AGI for various income ranges: 15.8% for AGIs below $25k, 30.4% for AGIs $25k-50k, 49.5% for AGIs $50k-75k, 80.7% for AGIs $75k-100k, 176.4% for AGIs $100k-200k, 585.0% for AGIs over 200k)
Ordinary dividends: $3,402 (reported on 21.6% of returns)
Here:
$3,402
State:
$7,290
(% of AGI for various income ranges: 29.7% for AGIs below $25k, 52.2% for AGIs $25k-50k, 99.5% for AGIs $50k-75k, 119.3% for AGIs $75k-100k, 213.6% for AGIs $100k-200k, 1480.0% for AGIs over 200k)
Net capital gain/loss in AGI: +$9,191 (reported on 18.9% of returns)
Here:
+$9,191
State:
+$20,511
(% of AGI for various income ranges: 17.3% for AGIs below $25k, 39.6% for AGIs $25k-50k, 125.3% for AGIs $50k-75k, 243.6% for AGIs $75k-100k, 483.2% for AGIs $100k-200k, 7055.0% for AGIs over 200k)
Profit/loss from business: +$13,200 (reported on 17.3% of returns)
Here:
+$13,200
State:
+$13,852
(% of AGI for various income ranges: 105.5% for AGIs below $25k, 138.9% for AGIs $25k-50k, 266.8% for AGIs $50k-75k, 428.6% for AGIs $75k-100k, 440.0% for AGIs $100k-200k, 7130.0% for AGIs over 200k)
Taxable individual retirement arrangement distribution: $14,041 (reported on 11.9% of returns)
67025:
$14,041
Kansas:
$19,921
(% of AGI for various income ranges: 87.3% for AGIs below $25k, 179.6% for AGIs $25k-50k, 245.8% for AGIs $50k-75k, 378.6% for AGIs $75k-100k, 599.5% for AGIs $100k-200k)
Total itemized deductions: $31,162 (reported on 8.6% of returns)
Here:
$31,162
State:
$36,939
(% of AGI for various income ranges: 163.9% for AGIs below $25k, 665.3% for AGIs $50k-75k, 798.6% for AGIs $100k-200k, 7120.0% for AGIs over 200k)
Charity contributions: $10,731 (reported on 7.0% of returns)
Here:
$10,731
State:
$15,443
(% of AGI for various income ranges: 118.4% for AGIs $50k-75k, 284.1% for AGIs $100k-200k, 2725.0% for AGIs over 200k)
Taxes paid: $7,606 (reported on 8.6% of returns)
67025:
$7,606
State:
$8,001
(% of AGI for various income ranges: 26.7% for AGIs below $25k, 123.2% for AGIs $50k-75k, 238.6% for AGIs $100k-200k, 1850.0% for AGIs over 200k)
Earned income credit: $2,456 (reported on 9.7% of returns)
Here:
$2,456
State:
$2,267
(% of AGI for various income ranges: 78.2% for AGIs below $25k, 68.1% for AGIs $25k-50k)
Percentage of individuals using paid preparers for their 2020 taxes: 94.6%
Here:
95%
State:
95%
(% for various income ranges: 92.2% for AGIs below $25k, 94.7% for AGIs $25k-50k, 96.4% for AGIs $50k-75k, 95.5% for AGIs $75k-100k, 97.4% for AGIs $100k-200k, 87.5% for AGIs over 200k)
Averages for the 2012 tax year for zip code 67025, filed in 2013:
Average Adjusted Gross Income (AGI) in 2012: $59,428 (Individual Income Tax Returns)
Here:
$59,428
State:
$60,095
Salary/wage: $52,569 (reported on 84.0% of returns)
Here:
$52,569
State:
$48,770
(% of AGI for various income ranges: 72.2% for AGIs below $25k, 73.3% for AGIs $25k-50k, 78.7% for AGIs $50k-75k, 82.3% for AGIs $75k-100k, 80.8% for AGIs $100k-200k, 43.0% for AGIs over 200k)
Taxable interest for individuals: $794 (reported on 45.7% of returns)
This zip code:
$794
Kansas:
$1,506
(% of AGI for various income ranges: 1.6% for AGIs below $25k, 0.7% for AGIs $25k-50k, 0.7% for AGIs $50k-75k, 0.3% for AGIs $75k-100k, 0.5% for AGIs $100k-200k, 0.8% for AGIs over 200k)
Ordinary dividends: $2,289 (reported on 20.6% of returns)
Here:
$2,289
State:
$6,093
(% of AGI for various income ranges: 0.9% for AGIs below $25k, 1.2% for AGIs $25k-50k, 0.6% for AGIs $50k-75k, 0.2% for AGIs $75k-100k, 0.8% for AGIs $100k-200k, 1.5% for AGIs over 200k)
Net capital gain/loss in AGI: +$4,577 (reported on 17.1% of returns)
Here:
+$4,577
State:
+$14,598
(% of AGI for various income ranges: 1.3% for AGIs below $25k, 0.2% for AGIs $25k-50k, 0.6% for AGIs $50k-75k, 1.1% for AGIs $75k-100k, 2.8% for AGIs $100k-200k)
Profit/loss from business: +$10,869 (reported on 16.6% of returns)
Here:
+$10,869
State:
+$12,554
(% of AGI for various income ranges: 6.2% for AGIs below $25k, 3.4% for AGIs $25k-50k, 3.7% for AGIs $50k-75k, 3.9% for AGIs $75k-100k, 2.7% for AGIs $100k-200k)
Taxable individual retirement arrangement distribution: $12,633 (reported on 12.0% of returns)
67025:
$12,633
Kansas:
$14,098
(% of AGI for various income ranges: 3.7% for AGIs below $25k, 2.9% for AGIs $25k-50k, 1.9% for AGIs $50k-75k, 2.6% for AGIs $75k-100k, 3.6% for AGIs $100k-200k)
Total itemized deductions: $19,360 (19% of AGI, reported on 36.0% of returns)
Here:
$19,360
State:
$23,678
Here:
18.9% of AGI
State:
18.9% of AGI
(% of AGI for various income ranges: 12.9% for AGIs below $25k, 10.8% for AGIs $25k-50k, 10.9% for AGIs $50k-75k, 9.7% for AGIs $75k-100k, 14.2% for AGIs $100k-200k, 10.1% for AGIs over 200k)
Charity contributions: $3,379 (reported on 30.3% of returns)
Here:
$3,379
State:
$5,321
(% of AGI for various income ranges: 1.2% for AGIs below $25k, 1.6% for AGIs $25k-50k, 1.3% for AGIs $50k-75k, 1.5% for AGIs $75k-100k, 2.1% for AGIs $100k-200k, 1.9% for AGIs over 200k)
Taxes paid: $8,102 (reported on 35.4% of returns)
67025:
$8,102
State:
$9,548
(% of AGI for various income ranges: 2.1% for AGIs below $25k, 2.6% for AGIs $25k-50k, 3.3% for AGIs $50k-75k, 4.1% for AGIs $75k-100k, 6.7% for AGIs $100k-200k, 6.4% for AGIs over 200k)
Earned income credit: $1,790 (reported on 12.0% of returns)
Here:
$1,790
State:
$2,212
(% of AGI for various income ranges: 4.0% for AGIs below $25k, 1.0% for AGIs $25k-50k)
Percentage of individuals using paid preparers for their 2012 taxes: 56.6%
Here:
57%
State:
56%
(% for various income ranges: 51.7% for AGIs below $25k, 55.9% for AGIs $25k-50k, 55.6% for AGIs $50k-75k, 62.5% for AGIs $75k-100k, 61.5% for AGIs $100k-200k, 75.0% for AGIs over 200k)
Averages for the 2004 tax year for zip code 67025, filed in 2005:
Average Adjusted Gross Income (AGI) in 2004: $47,441 (Individual Income Tax Returns)
Here:
$47,441
State:
$45,726
Salary/wage: $42,964 (reported on 86.7% of returns)
Here:
$42,964
State:
$40,112
(% of AGI for various income ranges: 142.8% for AGIs below $10k, 75.3% for AGIs $10k-25k, 81.0% for AGIs $25k-50k, 88.5% for AGIs $50k-75k, 91.8% for AGIs $75k-100k, 54.4% for AGIs over 100k)
Taxable interest for individuals: $1,019 (reported on 53.4% of returns)
This zip code:
$1,019
Kansas:
$1,749
(% of AGI for various income ranges: 10.1% for AGIs below $10k, 3.3% for AGIs $10k-25k, 1.8% for AGIs $25k-50k, 0.5% for AGIs $50k-75k, 0.5% for AGIs $75k-100k, 0.9% for AGIs over 100k)
Taxable dividends: $1,381 (reported on 25.7% of returns)
Here:
$1,381
State:
$3,066
(% of AGI for various income ranges: 1.9% for AGIs below $10k, 1.2% for AGIs $10k-25k, 1.1% for AGIs $25k-50k, 0.4% for AGIs $50k-75k, 0.3% for AGIs $75k-100k, 1.1% for AGIs over 100k)
Net capital gain/loss: +$4,284 (reported on 21.2% of returns)
Here:
+$4,284
State:
+$7,555
(% of AGI for various income ranges: -0.1% for AGIs below $10k, -0.1% for AGIs $10k-25k, 1.8% for AGIs $25k-50k, 0.4% for AGIs $50k-75k, 1.0% for AGIs $75k-100k, 4.6% for AGIs over 100k)
Profit/loss from business: +$6,213 (reported on 16.6% of returns)
Here:
+$6,213
State:
+$9,571
(% of AGI for various income ranges: 3.9% for AGIs below $10k, 3.3% for AGIs $10k-25k, 3.7% for AGIs $25k-50k, 2.2% for AGIs $50k-75k, -0.2% for AGIs $75k-100k, 2.8% for AGIs over 100k)
IRA payment deduction: $2,771 (reported on 3.0% of returns)
67025:
$2,771
Kansas:
$2,922
Total itemized deductions: $15,678 (19% of AGI, reported on 35.7% of returns)
Here:
$15,678
State:
$18,779
Here:
19.2% of AGI
State:
20.5% of AGI
(% of AGI for various income ranges: 25.8% for AGIs below $10k, 9.6% for AGIs $10k-25k, 10.5% for AGIs $25k-50k, 11.5% for AGIs $50k-75k, 14.1% for AGIs $75k-100k, 10.8% for AGIs over 100k)
Charity contributions deductions: $3,093 (4% of AGI, reported on 31.1% of returns)
Here:
$3,093
State:
$3,892
Here:
3.6% of AGI
State:
4.0% of AGI
(% of AGI for various income ranges: 1.7% for AGIs below $10k, 1.8% for AGIs $10k-25k, 1.6% for AGIs $25k-50k, 1.9% for AGIs $50k-75k, 2.0% for AGIs $75k-100k, 2.5% for AGIs over 100k)
Total tax: $5,100 (reported on 75.4% of returns)
67025:
$5,100
State:
$7,203
(% of AGI for various income ranges: 4.1% for AGIs below $10k, 4.0% for AGIs $10k-25k, 6.2% for AGIs $25k-50k, 7.5% for AGIs $50k-75k, 9.1% for AGIs $75k-100k, 10.2% for AGIs over 100k)
Earned income credit: $1,640 (reported on 10.4% of returns)
Here:
$1,640
State:
$1,674
Percentage of individuals using paid preparers for their 2004 taxes: 60.4%
Here:
60%
State:
63%
(% for various income ranges: 51.9% for AGIs below $10k, 60.3% for AGIs $10k-25k, 68.1% for AGIs $25k-50k, 61.5% for AGIs $50k-75k, 59.0% for AGIs $75k-100k, 61.1% for AGIs over 100k)
Likely homosexual households (counted as self-reported same-sex unmarried-partner households)
Lesbian couples: 0.1% of all households
Gay men: 0.0% of all households
Household received Food Stamps/SNAP in the past 12 months: 63 Household did not receive Food Stamps/SNAP in the past 12 months: 1,244
Women who had a birth in the past 12 months: 33 (33 now married, 0 unmarried) Women who did not have a birth in the past 12 months: 869 (444 now married, 424 unmarried)
Housing units in zip code 67025 with a mortgage: 602 (63 second mortgage, 54 both second mortgage and home equity loan) Houses without a mortgage: 13
Median monthly owner costs for units with a mortgage: $1,607 Median monthly owner costs for units without a mortgage: $531
Residents with income below the poverty level in 2022:
This zip code:
8.6%
Whole state:
12.0%
Residents with income below 50% of the poverty level in 2022:
This zip code:
6.6%
Whole state:
6.4%
Median number of rooms in houses and condos:
Here:
6.6
State:
6.9
Median number of rooms in apartments:
Here:
5.4
State:
4.4
Notable locations in this zip code not listed on our city pages
Notable locations in zip code 67025: Cheney State Park Giefer Hill Campground (A), Cherry Oaks Golf Course (B), Cheney State Park Smarsh Creek Campground (C), Cheney State Park Harding Hill Campground (D), Cheney State Park West Boat Ramp (E), Cheney Wastewater Plant (F), Sedgwick County Fairgrounds (G), Kansas Department of Wildlife and Parks - Cheney State Park (H), Cheney Police Department (I), Cheney Public Library (J), Cheney Golden Age Home (K), Cheney Volunteer Fire Department (L). Display/hide their locations on the map
Churches in zip code 67025 include: Saint Rose Catholic Church (A), Saint Paul's Lutheran Church (B), Cheney Baptist Church (C). Display/hide their locations on the map
Cemeteries: Cheney Pioneer Cemetery (1), Mount Vernon Cemetery (2), Fairview Cemetery (3), Vinita Cemetery (4), Saint Paul Lutheran Cemetery (5), Saint Rose Cemetery (6). Display/hide their locations on the map
Rivers and creeks: Spring Creek (A), Rock Creek (B), Nester Creek (C), North Fork Ninnescah River (D), Mod Creek (E), South Fork Ninnescah River (F). Display/hide their locations on the map
In group quarters: 49 (-1 institutionalized population)
Size of family households: 388 2-persons, 170 3-persons, 93 4-persons, 132 5-persons, 44 6-persons, 81 7-or-more-persons
Size of nonfamily households: 362 1-person, 25 2-persons, 7 5-persons
917 married couples with children.
105 single-parent households (14 men, 91 women).
99.5% of residents of 67025 zip code speak English at home.
0.6% of residents speak Spanish at home (52% very well, 48% well).
Foreign born population: 0 (0.0%)
:
0.0%
Whole state:
7.1%
37%German
13%American
8%Irish
7%European
5%English
2%British
1%Dutch
Year of entry for the foreign-born population
02010 or later
02000 to 2009
01990 to 1999
32Before 1990
Major facilities with environmental interests located in this zip code:
CHENEY COOPERATIVE ELEVATOR (101 SOUTH ADAMS in CHENEY, KS)
AIR MINOR (AIRS/AFS) STATE MASTER (Kansas Facility Profiler) - RTK-SG00064, EPCRA, ISTEPS-17300056, AIR PROGRAM, TANKS-27818, UNDERGROUND STORAGE TANK PROGRAM, ISL-C208770068, STATE CLEANUP SITE Business SIC classification: GRAIN AND FIELD BEANS; FARM SUPPLIES Business NAICS classification: GRAIN AND FIELD BEAN WHOLESALERS. Organizations: FARMERS COOPERATIVE ELEVATOR, CHENEY (CONTACT/OPERATOR)
, FARMERS COOPERATIVE ELEVATOR CO., GARDEN PLAIN, KS (CONTACT/OWNER)
, FARMERS COOP ELEV (GARDEN PLAI (OWNER/OPERATOR)
, FARMERS COOP ELEVATOR COMPANY (RTK PARENT ORGANIZATION)
Alternative names: CHENEY CO-OP ELEVATOR ASSN., CHENEY COOPERATIVE ELEV ASSN, CHENEY COoperative ELEVATOR ASSociation
LUMEN ENERGY CORP. (13521 NORTHEAST 10TH STREET in CHENEY, KS)
AIR SYNTHETIC MINOR (AIRS/AFS) STATE MASTER (Kansas Facility Profiler) - ISTEPS-09500048, AIR MINOR, ISTEPS-09500032, ISL-C204870015, STATE CLEANUP SITE, RTK-KM00755, EPCRA CRITERIA AND HAZARDOUS AIR POLLUTANT INVENTORY (Inventory of air pollution sources) Business SIC classification: NATURAL GAS TRANSMISSION Business NAICS classification: PIPELINE TRANSPORTATION OF NATURAL GAS. Organizations: LUMEN MIDSTREAM PARTNERSHIP, LLC (CONTACT/OPERATOR)
Alternative names: WEST WICHITA GAS GATHERING, LLC
USD #268 (100 W 6TH in CHENEY, KS)
STATE MASTER (Kansas Facility Profiler) - TANKS-05844, UNDERGROUND STORAGE TANK PROGRAM Conditionally Exempt Small Quantity Generators, less than 100 kg/month of hazardous waste (Resource Conservation and Recovery Act (tracking hazardous waste)) - notification Organizations: U.S.D. 268 (CONTACT/OWNER)
Alternative names: USD 268 CHENEY
MANUFACTURING DEVELOPMENT INCORPORATED (37515 WEST 15TH STREET SOUTH in CHENEY, KS)
STATE MASTER (Kansas Facility Profiler) - WWT-I-AR20-BO01, WASTEWATER FACILITY Conditionally Exempt Small Quantity Generators, less than 100 kg/month of hazardous waste (Resource Conservation and Recovery Act (tracking hazardous waste)) Business SIC and NAICS classification: AIRCRAFT PARTS AND AUXILIARY EQUIPMENT Organizations: M D I INC (CONTACT/OPERATOR)
KLAVER CONSTRUCTION (205 AVENUE A WEST in CHENEY, KS)
AIR MINOR (AIRS/AFS) STATE MASTER (Kansas Facility Profiler) - ISTEPS-17300096, AIR PROGRAM Business SIC classification: READY-MIXED CONCRETE Business NAICS classification: READY-MIX CONCRETE MANUFACTURING. Alternative names: CHENEY REDI MIX
CHENEY ELEM (126 W 5TH in CHENEY, KS)
(National Center for Education Statistics) - STATE ID-2090
CHENEY HIGH (800 N MARSHALL in CHENEY, KS)
(National Center for Education Statistics) - STATE ID-2092
CHENEY MIDDLE SCHOOL 6-8 (100 WEST 6TH in CHENEY, KS)
(National Center for Education Statistics) - STATE ID-2091
VAL ENERGY (343RD ST W & 103RD ST S in CHENEY, KS)
(Integrated Compliance Information System) - ICIS-07-2002-0049, FORMAL ENFORCEMENT ACTION
LUBBERS FORD INC (944 N MAIN in CHENEY, KS)
Conditionally Exempt Small Quantity Generators, less than 100 kg/month of hazardous waste (Resource Conservation and Recovery Act (tracking hazardous waste)) Business NAICS classification: OTHER AUTOMOTIVE MECHANICAL AND ELECTRICAL REPAIR AND MAINTENANCE. Organizations: RON WOLF (CONTACT/OPERATOR)
, LUBBERS BROS FORD MERCURY INC (CONTACT/OWNER)
Alternative names: LUBBERS BROS FORD MERCURY INC
MANUFACTURING DEV INC (38215 W HARRY in CHENEY, KS)
(Resource Conservation and Recovery Act (tracking hazardous waste)) Business NAICS classification: OTHER AIRCRAFT PARTS AND AUXILIARY EQUIPMENT MANUFACTURING. Organizations: RON WAGGY (CONTACT/OPERATOR)
, MARCIA MIES (CONTACT/OWNER)
KANSAS DEPT. OF WILDLIFE & PAR ( in CHENEY, KS)
National Pollutant Discharge Elimination System NON-MAJOR (Tracking pollutant discharge elimination systems) - permit Business SIC classification: RECREATIONAL VEHICLE PARKS AND CAMPSITES Alternative names: KDWP-CHENEY PARK WEST SHORE
45.7%Utility gas
28.6%Electricity
20.5%Bottled, tank, or LP gas
4.1%Wood
0.8%Other fuel
Population in 1990: 2,497. Population change in the 1990s: +979 (+39.2%).
Place of birth for U.S.-born residents:
This state: 3,142
Northeast: 13
Midwest: 248
South: 231
West: 220
61% of the 67025 zip code residents lived in the same house 5 years ago. Out of people who lived in different houses, 53% lived in this county. Out of people who lived in different counties, 50% lived in Kansas.
96% of the 67025 zip code residents lived in the same house 1 year ago. Out of people who lived in different houses, 40% moved from this county. Out of people who lived in different houses, 43% moved from different county within same state. Out of people who lived in different houses, 25% moved from different state. Out of people who lived in different houses, 3% moved from abroad.
Private vs. public school enrollment:
Students in private schools in grades 1 to 8 (elementary and middle school): 22
Here:
4.4%
Kansas:
14.1%
Students in private schools in grades 9 to 12 (high school): 11
Here:
3.2%
Kansas:
10.8%
Students in private undergraduate colleges: 23
Here:
27.0%
Kansas:
15.4%
Occupation by median earnings in the past 12 months ($)
143,540Legal occupations
91,628Management occupations
80,924Health diagnosing and treating practitioners and other technical occupations
70,706Computer and mathematical occupations
67,550Production occupations
67,227Architecture and engineering occupations
Companies with federal contracts located in this zip code:
MANUFACTURING DEVELOPMENT, INC (37515 W 15TH ST SOUTH in CHENEY, KS; small business) : $110,499 in 14 contractsfrom 2000 to 2006
Contracts for Airframe Structural Components by Defense Logistics Agency Signed by year:2000: $25,759; 2001: $44,241; 2002: $0; 2003: $0; 2004: $17,634; 2005: $18,304; 2006: $4,561.
Biggest contracts:
$44,241 with Defense Logistics Agency for Airframe Structural Components. Signed on 2001-05-18. Completion date: 2001-12-20.
$25,759, same as above.Signed on 2000-07-06. Completion date: 2001-07-01.
$14,873, same as above.Signed on 2004-12-23. Completion date: 2005-12-13.
$9,182, same as above.Signed on 2005-02-10. Completion date: 2005-11-22.
CHENEY GOLDEN AGE HOME, INC (724 N JEFFERSON in CHENEY, KS; small business) 55 employees, $810000 revenue. : $52,000 in 6 contractsfrom 1999 to 2002
Contracts for Nursing Home Care Contracts by Department of Veterans Affairs Signed by year:2000: $18,000; 2001: $16,000; 2002: $11,000; 2003: $0; 2004: $0; 2005: $0; 2006: $0.
Biggest contracts:
$16,000 with Department of Veterans Affairs for Nursing Home Care Contracts. Signed on 2001-02-15. Completion date: 2002-01-15.
$11,000, same as above.Signed on 2000-09-15. Completion date: 2000-12-15.
$7,000, same as above.Signed on 2002-09-15. Completion date: 2003-01-15.
$7,000, same as above.Signed on 2000-06-15. Completion date: 2000-12-15.
ALBERS DEVELOPMENT, INC (220 N MAIN ST in CHENEY, KS; small business) : $40,201 in 7 contractsfrom 2004 to 2006
Contracts for Food Items For Resale, Non-Food Items For Resale by Defense Commissary Agency Signed by year:2000: $0; 2001: $0; 2002: $0; 2003: $0; 2004: $8,982; 2005: $23,225; 2006: $7,994.
Biggest contracts:
$9,078 with Defense Commissary Agency for Food Items For Resale. Signed on 2005-04-01. Completion date: 2005-07-31.
$8,982, same as above.Signed on 2004-10-01. Completion date: 2005-02-28.
$7,994 with Defense Commissary Agency for Non-Food Items For Resale. Signed on 2006-01-01. Completion date: 2006-03-31.
$5,396, same as above.Signed on 2005-10-01. Completion date: 2005-12-31.
Top industries in this zip code by the number of employees in 2005:
Health Care and Social Assistance: Nursing Care Facilities (50-99 employees: 1 establishment)
Accommodation and Food Services: Limited-Service Restaurants (20-49: 1, 10-19: 1)
Health Care and Social Assistance: Services for the Elderly and Persons with Disabilities (20-49: 1)
Educational Services: Elementary and Secondary Schools (20-49: 1)
Construction: New Single-Family Housing Construction (except Operative Builders) (10-19: 1, 1-4: 5)
Other Services (except Public Administration): Automotive Exhaust System Repair (10-19: 1)
People in group quarters in 2010:
54 people in nursing facilities/skilled-nursing facilities
People in group quarters in 2000:
55 people in nursing homes
Fatal accident statistics in 2011:
Fatal accident count: 2
Vehicles involved in fatal accidents: 3
Fatal accidents caused by drunken drivers: 0
Fatalities: 2
Persons involved in fatal accidents: 3
Pedestrians involved in fatal accidents: 0
Fatal accident statistics in 2010:
Fatal accident count: 2
Vehicles involved in fatal accidents: 2
Fatal accidents caused by drunken drivers: 2
Fatalities: 2
Persons involved in fatal accidents: 2
Pedestrians involved in fatal accidents: 0
Home Mortgage Disclosure Act Aggregated Statistics For Year 2009 (Based on 6 partial tracts)
A) FHA, FSA/RHS & VA Home Purchase Loans
B) Conventional Home Purchase Loans
C) Refinancings
D) Home Improvement Loans
E) Loans on Dwellings For 5+ Families
F) Non-occupant Loans on < 5 Family Dwellings (A B C & D)
G) Loans On Manufactured Home Dwelling (A B C & D)
Number
Average Value
Number
Average Value
Number
Average Value
Number
Average Value
Number
Average Value
Number
Average Value
Number
Average Value
LOANS ORIGINATED
34
$123,830
29
$130,530
161
$137,073
19
$34,324
1
$56,340
18
$53,531
13
$34,455
APPLICATIONS APPROVED, NOT ACCEPTED
1
$61,740
2
$107,745
8
$155,920
4
$53,365
0
$0
1
$30,310
1
$83,920
APPLICATIONS DENIED
6
$133,715
4
$78,350
36
$152,180
3
$60,900
0
$0
1
$43,710
5
$86,950
APPLICATIONS WITHDRAWN
2
$143,940
3
$136,290
20
$166,912
1
$87,210
0
$0
0
$0
0
$0
FILES CLOSED FOR INCOMPLETENESS
2
$97,750
1
$69,460
5
$107,020
0
$0
0
$0
0
$0
1
$89,530
Aggregated Statistics For Year 2008 (Based on 6 partial tracts)
A) FHA, FSA/RHS & VA Home Purchase Loans
B) Conventional Home Purchase Loans
C) Refinancings
D) Home Improvement Loans
E) Loans on Dwellings For 5+ Families
F) Non-occupant Loans on < 5 Family Dwellings (A B C & D)
G) Loans On Manufactured Home Dwelling (A B C & D)
Number
Average Value
Number
Average Value
Number
Average Value
Number
Average Value
Number
Average Value
Number
Average Value
Number
Average Value
LOANS ORIGINATED
22
$104,613
79
$118,237
75
$153,143
21
$24,261
1
$162,850
17
$70,681
12
$64,831
APPLICATIONS APPROVED, NOT ACCEPTED
1
$54,200
6
$129,000
8
$128,305
1
$127,370
0
$0
1
$33,960
3
$68,733
APPLICATIONS DENIED
12
$125,534
10
$78,532
29
$161,775
9
$53,416
0
$0
0
$0
3
$75,100
APPLICATIONS WITHDRAWN
1
$144,530
4
$129,998
14
$170,213
0
$0
0
$0
1
$50,400
0
$0
FILES CLOSED FOR INCOMPLETENESS
2
$122,330
2
$97,620
1
$283,600
1
$81,590
0
$0
0
$0
2
$81,490
Aggregated Statistics For Year 2007 (Based on 6 partial tracts)
A) FHA, FSA/RHS & VA Home Purchase Loans
B) Conventional Home Purchase Loans
C) Refinancings
D) Home Improvement Loans
E) Loans on Dwellings For 5+ Families
F) Non-occupant Loans on < 5 Family Dwellings (A B C & D)
G) Loans On Manufactured Home Dwelling (A B C & D)
Number
Average Value
Number
Average Value
Number
Average Value
Number
Average Value
Number
Average Value
Number
Average Value
Number
Average Value
LOANS ORIGINATED
14
$100,209
83
$125,343
55
$123,959
20
$44,836
2
$53,255
11
$53,180
14
$54,699
APPLICATIONS APPROVED, NOT ACCEPTED
1
$29,140
5
$80,050
11
$177,991
2
$31,305
0
$0
0
$0
1
$72,360
APPLICATIONS DENIED
2
$89,915
9
$137,752
34
$102,100
10
$80,744
0
$0
1
$84,900
6
$59,193
APPLICATIONS WITHDRAWN
0
$0
4
$123,068
8
$141,844
1
$124,830
0
$0
0
$0
0
$0
FILES CLOSED FOR INCOMPLETENESS
0
$0
1
$103,160
1
$132,420
0
$0
0
$0
0
$0
0
$0
Aggregated Statistics For Year 2006 (Based on 6 partial tracts)
A) FHA, FSA/RHS & VA Home Purchase Loans
B) Conventional Home Purchase Loans
C) Refinancings
D) Home Improvement Loans
F) Non-occupant Loans on < 5 Family Dwellings (A B C & D)
G) Loans On Manufactured Home Dwelling (A B C & D)
Number
Average Value
Number
Average Value
Number
Average Value
Number
Average Value
Number
Average Value
Number
Average Value
LOANS ORIGINATED
7
$103,084
81
$103,271
73
$93,264
25
$29,116
14
$48,852
9
$45,982
APPLICATIONS APPROVED, NOT ACCEPTED
0
$0
4
$118,335
10
$96,893
2
$18,430
1
$40,130
2
$59,430
APPLICATIONS DENIED
1
$96,160
15
$99,551
43
$140,002
15
$55,101
1
$34,560
6
$72,887
APPLICATIONS WITHDRAWN
1
$62,520
5
$84,002
20
$134,967
4
$74,268
1
$62,520
2
$75,905
FILES CLOSED FOR INCOMPLETENESS
0
$0
0
$0
6
$128,913
1
$12,600
1
$30,870
0
$0
Aggregated Statistics For Year 2005 (Based on 6 partial tracts)
A) FHA, FSA/RHS & VA Home Purchase Loans
B) Conventional Home Purchase Loans
C) Refinancings
D) Home Improvement Loans
E) Loans on Dwellings For 5+ Families
F) Non-occupant Loans on < 5 Family Dwellings (A B C & D)
G) Loans On Manufactured Home Dwelling (A B C & D)
Number
Average Value
Number
Average Value
Number
Average Value
Number
Average Value
Number
Average Value
Number
Average Value
Number
Average Value
LOANS ORIGINATED
6
$111,378
63
$109,970
87
$107,376
23
$38,413
1
$1,080,520
9
$38,434
6
$66,890
APPLICATIONS APPROVED, NOT ACCEPTED
1
$56,530
13
$70,662
11
$125,759
0
$0
0
$0
1
$83,350
2
$43,410
APPLICATIONS DENIED
1
$170,350
15
$54,983
60
$117,795
10
$41,706
0
$0
3
$46,540
9
$66,811
APPLICATIONS WITHDRAWN
1
$138,150
7
$87,119
26
$142,236
5
$65,430
0
$0
0
$0
2
$62,785
FILES CLOSED FOR INCOMPLETENESS
0
$0
2
$69,850
5
$154,530
1
$57,980
0
$0
0
$0
0
$0
Aggregated Statistics For Year 2004 (Based on 6 partial tracts)
A) FHA, FSA/RHS & VA Home Purchase Loans
B) Conventional Home Purchase Loans
C) Refinancings
D) Home Improvement Loans
F) Non-occupant Loans on < 5 Family Dwellings (A B C & D)
G) Loans On Manufactured Home Dwelling (A B C & D)
Number
Average Value
Number
Average Value
Number
Average Value
Number
Average Value
Number
Average Value
Number
Average Value
LOANS ORIGINATED
12
$102,636
61
$109,141
107
$109,248
20
$36,388
10
$60,561
6
$56,857
APPLICATIONS APPROVED, NOT ACCEPTED
1
$73,320
7
$103,836
19
$100,875
2
$37,010
1
$46,620
4
$68,498
APPLICATIONS DENIED
0
$0
20
$75,975
65
$96,420
8
$43,489
2
$42,505
12
$43,356
APPLICATIONS WITHDRAWN
2
$77,180
3
$82,317
28
$126,921
2
$94,930
1
$38,590
2
$98,625
FILES CLOSED FOR INCOMPLETENESS
0
$0
0
$0
11
$110,188
1
$85,090
0
$0
0
$0
Aggregated Statistics For Year 2003 (Based on 6 partial tracts)
A) FHA, FSA/RHS & VA Home Purchase Loans
B) Conventional Home Purchase Loans
C) Refinancings
D) Home Improvement Loans
F) Non-occupant Loans on < 5 Family Dwellings (A B C & D)
Number
Average Value
Number
Average Value
Number
Average Value
Number
Average Value
Number
Average Value
LOANS ORIGINATED
10
$84,450
53
$106,237
240
$110,293
27
$21,033
16
$48,142
APPLICATIONS APPROVED, NOT ACCEPTED
0
$0
1
$178,340
23
$123,943
1
$12,000
0
$0
APPLICATIONS DENIED
1
$38,590
10
$105,153
60
$94,446
7
$17,060
1
$115,410
APPLICATIONS WITHDRAWN
0
$0
7
$124,720
42
$102,461
0
$0
1
$84,570
FILES CLOSED FOR INCOMPLETENESS
0
$0
1
$220,000
10
$107,442
0
$0
0
$0
Aggregated Statistics For Year 2002 (Based on 6 partial tracts)
A) FHA, FSA/RHS & VA Home Purchase Loans
B) Conventional Home Purchase Loans
C) Refinancings
D) Home Improvement Loans
F) Non-occupant Loans on < 5 Family Dwellings (A B C & D)
Number
Average Value
Number
Average Value
Number
Average Value
Number
Average Value
Number
Average Value
LOANS ORIGINATED
12
$84,316
63
$91,634
159
$109,872
19
$24,783
10
$38,566
APPLICATIONS APPROVED, NOT ACCEPTED
1
$94,410
11
$59,841
20
$89,192
3
$40,097
1
$31,470
APPLICATIONS DENIED
1
$84,900
9
$70,476
36
$94,511
7
$34,063
2
$59,130
APPLICATIONS WITHDRAWN
0
$0
6
$86,043
21
$97,928
3
$14,327
0
$0
FILES CLOSED FOR INCOMPLETENESS
0
$0
1
$32,640
11
$100,615
0
$0
0
$0
Aggregated Statistics For Year 2001 (Based on 6 partial tracts)
A) FHA, FSA/RHS & VA Home Purchase Loans
B) Conventional Home Purchase Loans
C) Refinancings
D) Home Improvement Loans
F) Non-occupant Loans on < 5 Family Dwellings (A B C & D)
Number
Average Value
Number
Average Value
Number
Average Value
Number
Average Value
Number
Average Value
LOANS ORIGINATED
15
$90,699
55
$91,514
136
$104,427
34
$22,191
9
$45,044
APPLICATIONS APPROVED, NOT ACCEPTED
0
$0
4
$43,925
18
$77,579
5
$16,078
1
$33,800
APPLICATIONS DENIED
0
$0
9
$114,766
44
$76,884
5
$11,300
1
$79,840
APPLICATIONS WITHDRAWN
2
$56,340
3
$104,090
26
$100,123
2
$42,140
1
$96,160
FILES CLOSED FOR INCOMPLETENESS
0
$0
0
$0
7
$126,524
1
$26,810
1
$96,470
Aggregated Statistics For Year 2000 (Based on 6 partial tracts)
A) FHA, FSA/RHS & VA Home Purchase Loans
B) Conventional Home Purchase Loans
C) Refinancings
D) Home Improvement Loans
F) Non-occupant Loans on < 5 Family Dwellings (A B C & D)
Number
Average Value
Number
Average Value
Number
Average Value
Number
Average Value
Number
Average Value
LOANS ORIGINATED
11
$85,520
50
$78,951
52
$82,324
32
$17,348
16
$33,290
APPLICATIONS APPROVED, NOT ACCEPTED
0
$0
7
$84,734
7
$96,590
2
$13,845
1
$18,520
APPLICATIONS DENIED
0
$0
20
$54,672
30
$75,953
12
$17,330
1
$36,270
APPLICATIONS WITHDRAWN
1
$32,420
4
$58,768
15
$76,841
2
$24,265
0
$0
FILES CLOSED FOR INCOMPLETENESS
0
$0
1
$129,710
2
$23,155
0
$0
0
$0
Aggregated Statistics For Year 1999 (Based on 3 partial tracts)
A) FHA, FSA/RHS & VA Home Purchase Loans
B) Conventional Home Purchase Loans
C) Refinancings
D) Home Improvement Loans
F) Non-occupant Loans on < 5 Family Dwellings (A B C & D)
Detailed PMIC statistics for the following Tracts:0106.00
, 0107.00
2002 - 2018 National Fire Incident Reporting System (NFIRS) incidents
According to the data from the years 2002 - 2018 the average number of fire incidents per year is 48. The highest number of fire incidents - 81 took place in 2006, and the least - 12 in 2012. The data has a rising trend.
When looking into fire subcategories, the most reports belonged to: Outside Fires (74.1%), and Structure Fires (11.5%).
Fire incident types reported to NFIRS in Zip Code 67025


 Nearest zip codes: 67050, 67111, 67118, 67106, 67149, 67001.


 According to the data from the years 2002 - 2018 the average number of fire incidents per year is 48. The highest number of fire incidents - 81 took place in 2006, and the least - 12 in 2012. The data has a rising trend.
 When looking into fire subcategories, the most reports belonged to: Outside Fires (74.1%), and Structure Fires (11.5%).