Estimated zip code population in 2022: 2,728 Zip code population in 2010: 2,369 Zip code population in 2000: 2,121
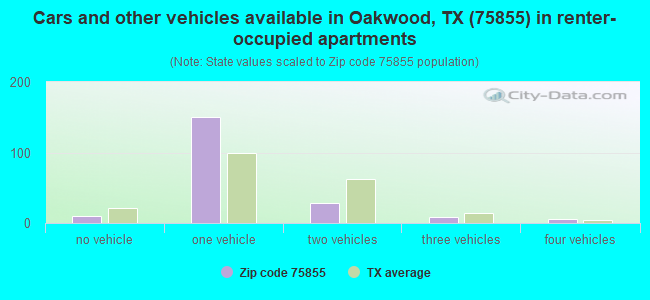
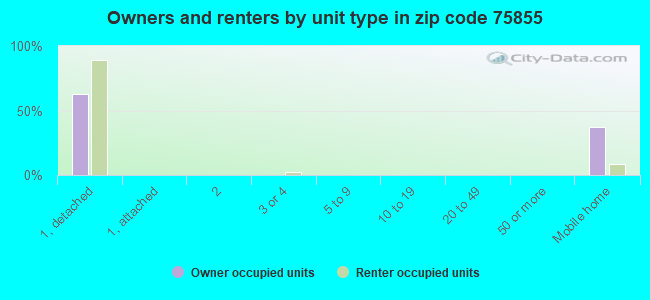
Houses and condos: 1,705 Renter-occupied apartments: 200
% of renters here:
16%
State:
38%
March 2022 cost of living index in zip code 75855: 81.0 (low, U.S. average is 100)
Land area: 272.0 sq. mi. Water area: 2.2 sq. mi.
Population density: 10 people per square mile
(very low).
OSM Map
General Map
Google Map
MSN Map
OSM Map
General Map
Google Map
MSN Map
OSM Map
General Map
Google Map
MSN Map
OSM Map
General Map
Google Map
MSN Map
Please wait while loading the map...
Real estate property taxes paid for housing units in 2022:
This zip code:
0.7% ($1,431)
Texas:
1.5% ($4,050)
Median real estate property taxes paid for housing units with mortgages in 2022: $1,384 (0.6%) Median real estate property taxes paid for housing units with no mortgage in 2022: $1,467 (0.7%)
Business Search- 14 Million verified businesses
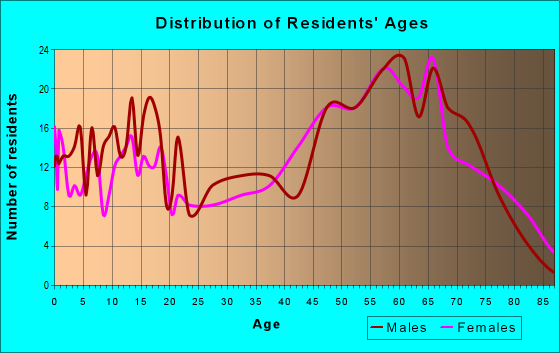
Males: 1,416
(51.9%)
Females: 1,312
(48.1%)
For population 25 years and over in 75855:
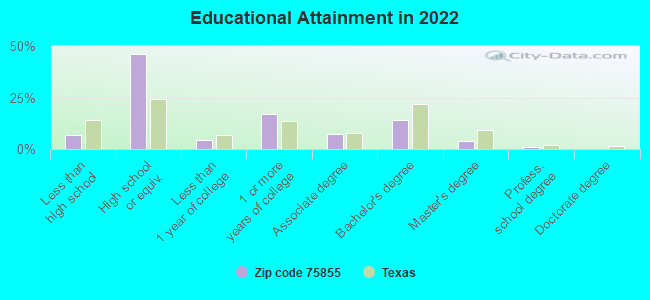
High school or higher: 92.3%
Bachelor's degree or higher: 18.3%
Graduate or professional degree: 4.6%
Unemployed: 1.3%
Mean travel time to work (commute): 33.7 minutes
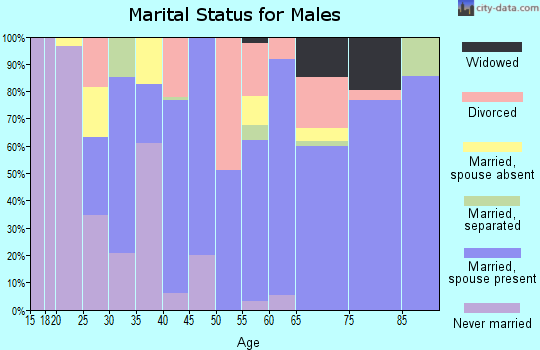
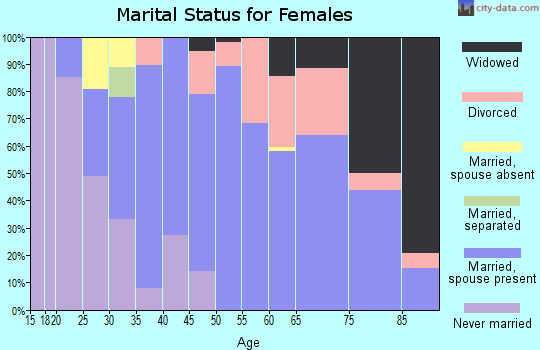
For population 15 years and over in 75855:
Never married: 9.7%
Now married: 70.6%
Separated: 0.5%
Widowed: 8.6%
Divorced: 10.6%
Zip code 75855 compared to state average:
Median household income below state average.
Unemployed percentage significantly below state average.
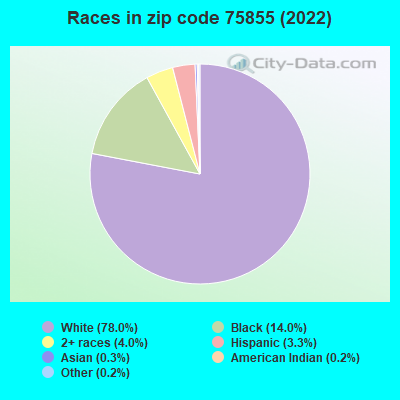
Hispanic race population percentage significantly below state average.
Median age significantly above state average.
Foreign-born population percentage significantly below state average.
Renting percentage significantly below state average.
Length of stay since moving in significantly above state average.
Percentage of population with a bachelor's degree or higher below state average.
Averages for the 2020 tax year for zip code 75855, filed in 2021:
Average Adjusted Gross Income (AGI) in 2020: $49,101 (Individual Income Tax Returns)
Here:
$49,101
State:
$77,054
Salary/wage: $45,692 (reported on 77.2% of returns)
Here:
$45,692
State:
$62,766
(% of AGI for various income ranges: 1229.6% for AGIs below $25k, 3647.4% for AGIs $25k-50k, 5909.0% for AGIs $50k-75k, 7885.0% for AGIs $75k-100k, 16460.0% for AGIs $100k-200k)
Taxable interest for individuals: $700 (reported on 23.8% of returns)
This zip code:
$700
Texas:
$2,665
(% of AGI for various income ranges: 10.7% for AGIs below $25k, 24.8% for AGIs $25k-50k, 38.0% for AGIs $50k-75k, 6.7% for AGIs $75k-100k, 48.8% for AGIs $100k-200k)
Ordinary dividends: $2,355 (reported on 10.9% of returns)
Here:
$2,355
State:
$10,044
(% of AGI for various income ranges: 28.9% for AGIs below $25k, 42.0% for AGIs $50k-75k, 170.0% for AGIs $100k-200k)
Net capital gain/loss in AGI: +$11,864 (reported on 13.9% of returns)
Here:
+$11,864
State:
+$39,590
(% of AGI for various income ranges: 10.0% for AGIs below $25k, 25.7% for AGIs $25k-50k, 187.0% for AGIs $50k-75k, 1733.7% for AGIs $100k-200k)
Profit/loss from business: +$4,671 (reported on 16.8% of returns)
Here:
+$4,671
State:
+$10,888
(% of AGI for various income ranges: 91.4% for AGIs below $25k, 42.2% for AGIs $25k-50k, 100.0% for AGIs $50k-75k, 426.2% for AGIs $100k-200k)
Taxable individual retirement arrangement distribution: $29,100 (reported on 8.9% of returns)
75855:
$29,100
Texas:
$24,740
(% of AGI for various income ranges: 79.3% for AGIs below $25k, 147.0% for AGIs $25k-50k, 636.0% for AGIs $50k-75k, 1778.8% for AGIs $100k-200k)
Total itemized deductions: $30,933 (reported on 5.9% of returns)
Here:
$30,933
State:
$40,428
(% of AGI for various income ranges: 365.7% for AGIs $25k-50k, 1691.7% for AGIs $75k-100k)
Charity contributions: $9,133 (reported on 3.0% of returns)
Here:
$9,133
State:
$18,201
(% of AGI for various income ranges: 274.0% for AGIs $50k-75k)
Taxes paid: $6,275 (reported on 4.0% of returns)
75855:
$6,275
State:
$7,821
(% of AGI for various income ranges: 43.5% for AGIs $25k-50k, 251.7% for AGIs $75k-100k)
Earned income credit: $2,395 (reported on 20.8% of returns)
Here:
$2,395
State:
$2,584
(% of AGI for various income ranges: 118.2% for AGIs below $25k, 74.8% for AGIs $25k-50k)
Percentage of individuals using paid preparers for their 2020 taxes: 93.1%
Here:
93%
State:
92%
(% for various income ranges: 92.1% for AGIs below $25k, 93.3% for AGIs $25k-50k, 92.3% for AGIs $50k-75k, 100.0% for AGIs $75k-100k, 92.3% for AGIs $100k-200k)
Averages for the 2012 tax year for zip code 75855, filed in 2013:
Average Adjusted Gross Income (AGI) in 2012: $41,759 (Individual Income Tax Returns)
Here:
$41,759
State:
$65,384
Salary/wage: $38,528 (reported on 80.6% of returns)
Here:
$38,528
State:
$52,524
(% of AGI for various income ranges: 72.3% for AGIs below $25k, 79.6% for AGIs $25k-50k, 80.4% for AGIs $50k-75k, 77.4% for AGIs $75k-100k, 64.4% for AGIs $100k-200k)
Taxable interest for individuals: $904 (reported on 25.5% of returns)
This zip code:
$904
Texas:
$2,372
(% of AGI for various income ranges: 1.2% for AGIs below $25k, 0.7% for AGIs $25k-50k, 0.8% for AGIs $50k-75k, 0.1% for AGIs $100k-200k)
Ordinary dividends: $980 (reported on 10.2% of returns)
Here:
$980
State:
$9,721
(% of AGI for various income ranges: 0.5% for AGIs below $25k, 0.6% for AGIs $25k-50k, 0.3% for AGIs $75k-100k)
Net capital gain/loss in AGI: +$2,630 (reported on 10.2% of returns)
Here:
+$2,630
State:
+$35,319
(% of AGI for various income ranges: 0.4% for AGIs $25k-50k, 1.2% for AGIs $50k-75k, 2.0% for AGIs $75k-100k)
Profit/loss from business: +$5,662 (reported on 16.3% of returns)
Here:
+$5,662
State:
+$13,732
(% of AGI for various income ranges: 9.1% for AGIs below $25k, 2.2% for AGIs $25k-50k, 2.2% for AGIs $50k-75k)
Taxable individual retirement arrangement distribution: $12,225 (reported on 8.2% of returns)
75855:
$12,225
Texas:
$19,511
Total itemized deductions: $20,394 (30% of AGI, reported on 17.3% of returns)
Here:
$20,394
State:
$24,724
Here:
30.4% of AGI
State:
15.9% of AGI
(% of AGI for various income ranges: 7.4% for AGIs below $25k, 8.7% for AGIs $25k-50k, 10.9% for AGIs $50k-75k, 7.8% for AGIs $75k-100k, 7.3% for AGIs $100k-200k)
Charity contributions: $4,725 (reported on 12.2% of returns)
Here:
$4,725
State:
$6,808
(% of AGI for various income ranges: 1.4% for AGIs $25k-50k, 2.9% for AGIs $50k-75k, 1.6% for AGIs $100k-200k)
Taxes paid: $3,075 (reported on 16.3% of returns)
75855:
$3,075
State:
$6,921
(% of AGI for various income ranges: 0.8% for AGIs below $25k, 1.1% for AGIs $25k-50k, 2.3% for AGIs $50k-75k, 1.2% for AGIs $100k-200k)
Earned income credit: $2,329 (reported on 24.5% of returns)
Here:
$2,329
State:
$2,570
(% of AGI for various income ranges: 7.5% for AGIs below $25k, 1.5% for AGIs $25k-50k)
Percentage of individuals using paid preparers for their 2012 taxes: 61.2%
Here:
61%
State:
51%
(% for various income ranges: 58.1% for AGIs below $25k, 59.3% for AGIs $25k-50k, 64.3% for AGIs $50k-75k, 71.4% for AGIs $75k-100k, 71.4% for AGIs $100k-200k)
Averages for the 2004 tax year for zip code 75855, filed in 2005:
Average Adjusted Gross Income (AGI) in 2004: $29,280 (Individual Income Tax Returns)
Here:
$29,280
State:
$47,881
Salary/wage: $28,761 (reported on 81.7% of returns)
Here:
$28,761
State:
$41,947
(% of AGI for various income ranges: 107.8% for AGIs below $10k, 84.6% for AGIs $10k-25k, 86.7% for AGIs $25k-50k, 84.0% for AGIs $50k-75k, 79.1% for AGIs $75k-100k, 49.5% for AGIs over 100k)
Taxable interest for individuals: $1,514 (reported on 28.3% of returns)
This zip code:
$1,514
Texas:
$2,255
(% of AGI for various income ranges: 11.0% for AGIs below $10k, 2.1% for AGIs $10k-25k, 1.0% for AGIs $25k-50k, 0.7% for AGIs $50k-75k, 0.3% for AGIs $75k-100k, 1.8% for AGIs over 100k)
Taxable dividends: $1,058 (reported on 14.2% of returns)
Here:
$1,058
State:
$4,261
(% of AGI for various income ranges: 2.4% for AGIs below $10k, 0.4% for AGIs $10k-25k, 0.2% for AGIs $25k-50k, 0.6% for AGIs $50k-75k, 0.5% for AGIs $75k-100k, 0.8% for AGIs over 100k)
Net capital gain/loss: +$2,841 (reported on 13.6% of returns)
Here:
+$2,841
State:
+$16,110
(% of AGI for various income ranges: 0.8% for AGIs below $10k, 0.2% for AGIs $10k-25k, 0.2% for AGIs $25k-50k, 1.3% for AGIs $50k-75k, 0.5% for AGIs $75k-100k, 6.1% for AGIs over 100k)
Profit/loss from business: +$517 (reported on 14.7% of returns)
Here:
+$517
State:
+$11,013
(% of AGI for various income ranges: -3.5% for AGIs below $10k, 1.9% for AGIs $10k-25k, 0.1% for AGIs $25k-50k, 1.1% for AGIs $50k-75k, -2.1% for AGIs $75k-100k)
Total itemized deductions: $17,093 (27% of AGI, reported on 13.2% of returns)
Here:
$17,093
State:
$19,631
Here:
27.1% of AGI
State:
18.9% of AGI
(% of AGI for various income ranges: 5.1% for AGIs $10k-25k, 6.6% for AGIs $25k-50k, 10.6% for AGIs $50k-75k, 7.2% for AGIs $75k-100k, 11.5% for AGIs over 100k)
Charity contributions deductions: $4,058 (6% of AGI, reported on 10.7% of returns)
Here:
$4,058
State:
$4,753
Here:
6.1% of AGI
State:
4.2% of AGI
(% of AGI for various income ranges: 1.0% for AGIs $10k-25k, 0.8% for AGIs $25k-50k, 1.6% for AGIs $50k-75k, 2.0% for AGIs $75k-100k, 3.2% for AGIs over 100k)
Total tax: $3,819 (reported on 62.3% of returns)
75855:
$3,819
State:
$9,058
(% of AGI for various income ranges: 2.8% for AGIs below $10k, 2.9% for AGIs $10k-25k, 5.8% for AGIs $25k-50k, 8.7% for AGIs $50k-75k, 12.0% for AGIs $75k-100k, 17.0% for AGIs over 100k)
Earned income credit: $1,962 (reported on 27.3% of returns)
Here:
$1,962
State:
$2,024
Percentage of individuals using paid preparers for their 2004 taxes: 64.9%
Here:
65%
State:
57%
(% for various income ranges: 55.6% for AGIs below $10k, 66.2% for AGIs $10k-25k, 70.1% for AGIs $25k-50k, 66.7% for AGIs $50k-75k, 64.3% for AGIs $75k-100k, 80.8% for AGIs over 100k)
Household received Food Stamps/SNAP in the past 12 months: 175 Household did not receive Food Stamps/SNAP in the past 12 months: 1,064
Women who had a birth in the past 12 months: 12 (12 now married, 0 unmarried) Women who did not have a birth in the past 12 months: 343 (222 now married, 118 unmarried)
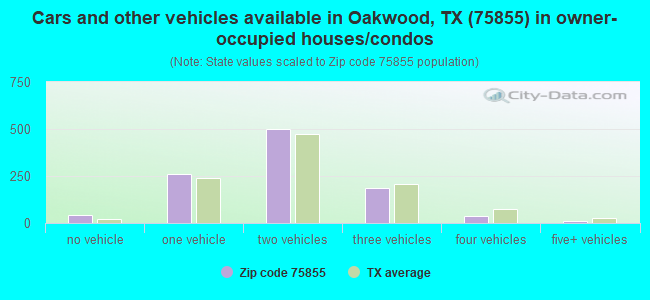
Housing units in zip code 75855 with a mortgage: 166 Houses without a mortgage: 13
Median monthly owner costs for units with a mortgage: $1,289 Median monthly owner costs for units without a mortgage: $567
Residents with income below the poverty level in 2022:
This zip code:
17.0%
Whole state:
14.0%
Residents with income below 50% of the poverty level in 2022:
This zip code:
6.1%
Whole state:
7.4%
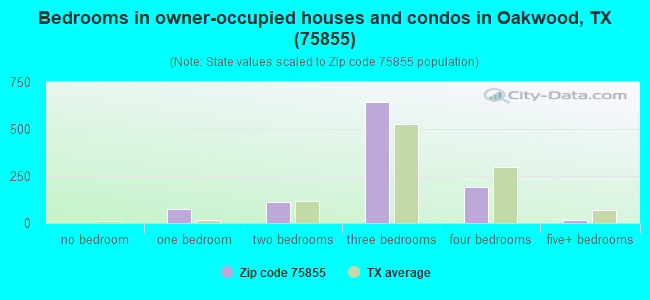
Median number of rooms in houses and condos:
Here:
5.8
State:
6.3
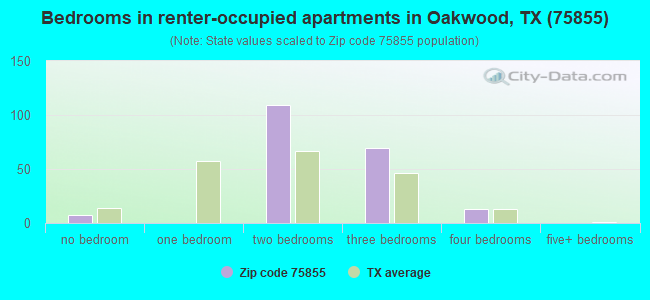
Median number of rooms in apartments:
Here:
4.3
State:
4.0
Notable locations in this zip code not listed on our city pages
Notable locations in zip code 75855: Sand Hill (A), Katy Library (B), East Leon County Fire Department (C), Butler Volunteer Fire Department (D), Daniel Memorial Childrens Home (E). Display/hide their locations on the map
Churches in zip code 75855 include: Owens Chapel (A), Pine Top Church (B), Shiloh Church (C), River Bend Church (D), Rocky Mount Church (E), Pilgrims Rest Church (F), Mount Pisgah Church (G), Mount Pilgrim Church (H), Immanuel Chapel (I). Display/hide their locations on the map
Cemeteries: Maze Cemetery (1), Brooke Cemetery (2), Mount Pisgah Cemetery (3), Lamon Cemetery (4), North Creek Cemetery (5), Bluff Cemetery (6). Display/hide their locations on the map
Lakes and reservoirs: Buzzard Lake (A), Field Lake (B), Wood Lake (C), Clear Lake (D), Zeke Lake (E), Spring Lake (F), Patterson Lake (G), Lake Port (H). Display/hide their locations on the map
Streams, rivers, and creeks: Brook Spring Branch (A), Boons Creek (B), Alum Branch (C), Birch Creek (D), Zuesco Creek (E), Upper Keechi Creek (F), Twin Branch (G), Toms Creek (H), Tan Yard Branch (I). Display/hide their locations on the map
In group quarters: 19 (-1 institutionalized population)
Size of family households: 598 2-persons, 88 3-persons, 99 4-persons, 16 5-persons, 18 6-persons, 13 7-or-more-persons
Size of nonfamily households: 406 1-person, 5 2-persons
247 married couples with children.
85 single-parent households (22 men, 63 women).
99.7% of residents of 75855 zip code speak English at home.
0.7% of residents speak Spanish at home (100% very well).
0.3% of residents speak Asian or Pacific Island language at home (100% well).
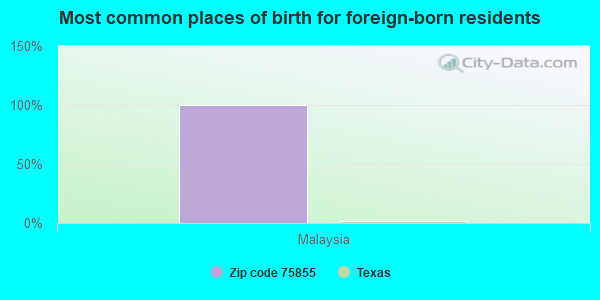
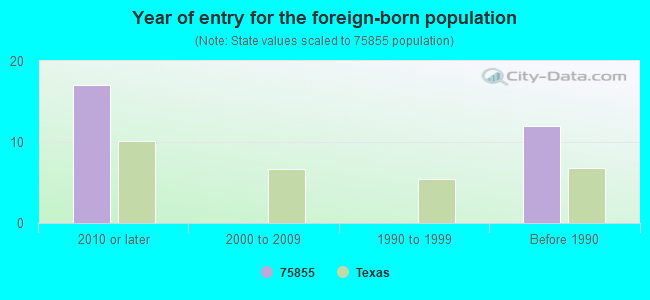
Foreign born population: 8 (0.3%) (100.0% of them are naturalized citizens)
This zip code:
0.3%
Whole state:
17.2%
100%Malaysia
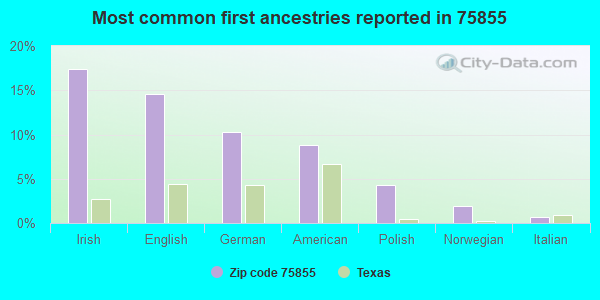
17%Irish
15%English
10%German
9%American
4%Polish
2%Norwegian
1%Italian
Year of entry for the foreign-born population
172010 or later
02000 to 2009
01990 to 1999
12Before 1990
Housing units lacking complete plumbing facilities: 4.4% Housing units lacking complete kitchen facilities: 6.8%
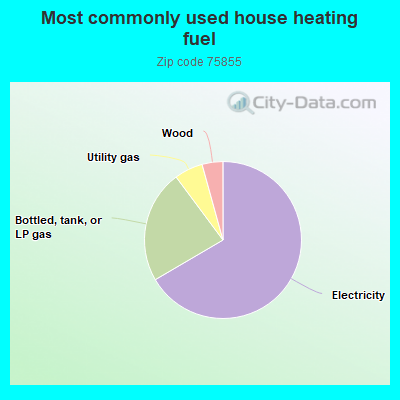
66.7%Electricity
23.3%Bottled, tank, or LP gas
5.9%Utility gas
4.3%Wood
Population in 1990: 2,637.
Place of birth for U.S.-born residents:
This state: 2,216
Northeast: 111
Midwest: 104
South: 122
West: 125
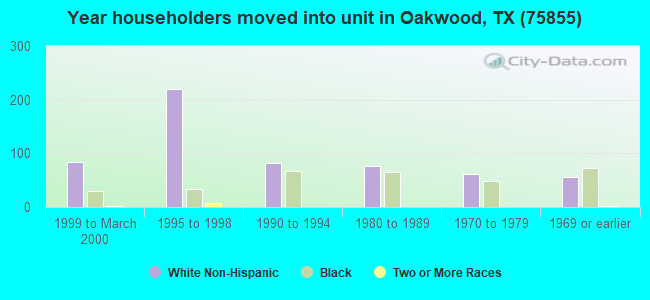
61% of the 75855 zip code residents lived in the same house 5 years ago. Out of people who lived in different houses, 32% lived in this county. Out of people who lived in different counties, 50% lived in Texas.
97% of the 75855 zip code residents lived in the same house 1 year ago. Out of people who lived in different houses, 20% moved from this county. Out of people who lived in different houses, 70% moved from different county within same state. Out of people who lived in different houses, 23% moved from abroad.
Private vs. public school enrollment:
Students in private schools in grades 1 to 8 (elementary and middle school): 4
Here:
1.5%
Texas:
8.8%
Students in private schools in grades 9 to 12 (high school): 6
Here:
19.3%
Texas:
8.0%
Students in private undergraduate colleges:
Here:
0.0%
Texas:
16.2%
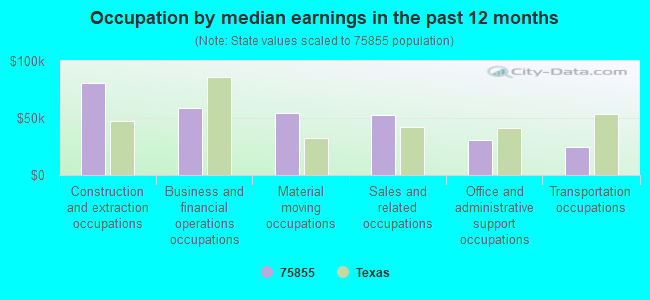
Occupation by median earnings in the past 12 months ($)
80,830Construction and extraction occupations
58,413Business and financial operations occupations
54,550Material moving occupations
52,865Sales and related occupations
31,042Office and administrative support occupations
24,897Transportation occupations
Top industries in this zip code by the number of employees in 2005:
Construction: Oil and Gas Pipeline and Related Structures Construction (100-249 employees: 1 establishment)
Construction: Other Heavy and Civil Engineering Construction (20-49: 1)
Construction: Water and Sewer Line and Related Structures Construction (20-49: 1)
Finance and Insurance: Real Estate Investment Trusts (10-19: 1)
Mining: Support Activities for Oil and Gas Operations (5-9: 1)
Finance and Insurance: Commercial Banking (5-9: 1)
Professional, Scientific, and Technical Services: Engineering Services (1-4: 2)
People in group quarters in 2010:
29 people in group homes for juveniles (non-correctional)
Fatal accident statistics in 2014:
Fatal accident count: 2
Vehicles involved in fatal accidents: 3
Fatal accidents caused by drunken drivers: 0
Fatalities: 3
Persons involved in fatal accidents: 6
Pedestrians involved in fatal accidents: 0
Fatal accident statistics in 2012:
Fatal accident count: 1
Vehicles involved in fatal accidents: 1
Fatal accidents caused by drunken drivers: 0
Fatalities: 1
Persons involved in fatal accidents: 1
Pedestrians involved in fatal accidents: 0
2002 - 2018 National Fire Incident Reporting System (NFIRS) incidents
Based on the data from the years 2002 - 2018 the average number of fire incidents per year is 21. The highest number of fire incidents - 43 took place in 2006, and the least - 3 in 2002. The data has a rising trend.
When looking into fire subcategories, the most incidents belonged to: Outside Fires (62.8%), and Structure Fires (21.7%).
Fire incident types reported to NFIRS in Zip Code 75855


 Nearest zip codes: 75831, 75839, 75833, 75861, 75840, 75846.


 Based on the data from the years 2002 - 2018 the average number of fire incidents per year is 21. The highest number of fire incidents - 43 took place in 2006, and the least - 3 in 2002. The data has a rising trend.
 When looking into fire subcategories, the most incidents belonged to: Outside Fires (62.8%), and Structure Fires (21.7%).