Estimated zip code population in 2022: 8,947 Zip code population in 2010: 7,841 Zip code population in 2000: 5,773
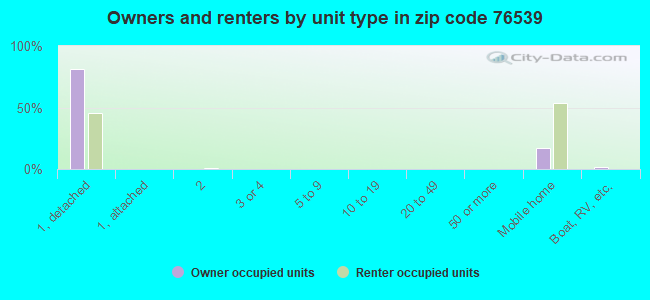
Houses and condos: 3,860 Renter-occupied apartments: 251
% of renters here:
8%
State:
38%
March 2022 cost of living index in zip code 76539: 79.8 (low, U.S. average is 100)
Land area: 137.4 sq. mi. Water area: 0.3 sq. mi.
Population density: 65 people per square mile
(very low).
OSM Map
General Map
Google Map
MSN Map
OSM Map
General Map
Google Map
MSN Map
OSM Map
General Map
Google Map
MSN Map
OSM Map
General Map
Google Map
MSN Map
Please wait while loading the map...
Real estate property taxes paid for housing units in 2022:
This zip code:
1.1% ($2,907)
Texas:
1.5% ($4,050)
Median real estate property taxes paid for housing units with mortgages in 2022: $3,120 (1.1%) Median real estate property taxes paid for housing units with no mortgage in 2022: $2,197 (1.1%)
Averages for the 2020 tax year for zip code 76539, filed in 2021:
Average Adjusted Gross Income (AGI) in 2020: $61,781 (Individual Income Tax Returns)
Here:
$61,781
State:
$77,054
Salary/wage: $52,068 (reported on 76.6% of returns)
Here:
$52,068
State:
$62,766
(% of AGI for various income ranges: 1035.8% for AGIs below $25k, 2940.2% for AGIs $25k-50k, 5373.7% for AGIs $50k-75k, 7881.9% for AGIs $75k-100k, 15280.8% for AGIs $100k-200k, 45310.0% for AGIs over 200k)
Taxable interest for individuals: $670 (reported on 26.8% of returns)
This zip code:
$670
Texas:
$2,665
(% of AGI for various income ranges: 10.9% for AGIs below $25k, 13.5% for AGIs $25k-50k, 22.5% for AGIs $50k-75k, 32.2% for AGIs $75k-100k, 65.2% for AGIs $100k-200k, 130.0% for AGIs over 200k)
Ordinary dividends: $3,357 (reported on 12.8% of returns)
Here:
$3,357
State:
$10,044
(% of AGI for various income ranges: 9.9% for AGIs below $25k, 19.3% for AGIs $25k-50k, 51.9% for AGIs $50k-75k, 58.9% for AGIs $75k-100k, 90.8% for AGIs $100k-200k, 2276.7% for AGIs over 200k)
Net capital gain/loss in AGI: +$10,750 (reported on 12.6% of returns)
Here:
+$10,750
State:
+$39,590
(% of AGI for various income ranges: 3.1% for AGIs below $25k, 20.1% for AGIs $25k-50k, 104.0% for AGIs $50k-75k, 226.7% for AGIs $75k-100k, 391.5% for AGIs $100k-200k, 8233.3% for AGIs over 200k)
Profit/loss from business: +$12,151 (reported on 15.7% of returns)
Here:
+$12,151
State:
+$10,888
(% of AGI for various income ranges: 118.3% for AGIs below $25k, 148.2% for AGIs $25k-50k, 277.1% for AGIs $50k-75k, 280.0% for AGIs $75k-100k, 590.0% for AGIs $100k-200k, 2596.7% for AGIs over 200k)
Taxable individual retirement arrangement distribution: $16,197 (reported on 7.0% of returns)
76539:
$16,197
Texas:
$24,740
(% of AGI for various income ranges: 33.4% for AGIs below $25k, 67.5% for AGIs $25k-50k, 151.3% for AGIs $50k-75k, 267.5% for AGIs $75k-100k, 519.8% for AGIs $100k-200k)
Total itemized deductions: $30,635 (reported on 4.1% of returns)
Here:
$30,635
State:
$40,428
(% of AGI for various income ranges: 76.2% for AGIs $25k-50k, 92.9% for AGIs $50k-75k, 215.3% for AGIs $75k-100k, 607.0% for AGIs $100k-200k, 2940.0% for AGIs over 200k)
Charity contributions: $12,808 (reported on 3.1% of returns)
Here:
$12,808
State:
$18,201
(% of AGI for various income ranges: 61.9% for AGIs $50k-75k, 247.2% for AGIs $100k-200k, 1180.0% for AGIs over 200k)
Taxes paid: $6,235 (reported on 4.1% of returns)
76539:
$6,235
State:
$7,821
(% of AGI for various income ranges: 15.0% for AGIs $25k-50k, 19.2% for AGIs $50k-75k, 51.9% for AGIs $75k-100k, 113.8% for AGIs $100k-200k, 640.0% for AGIs over 200k)
Earned income credit: $2,435 (reported on 15.2% of returns)
Here:
$2,435
State:
$2,584
(% of AGI for various income ranges: 97.2% for AGIs below $25k, 77.0% for AGIs $25k-50k, 2.3% for AGIs $50k-75k)
Percentage of individuals using paid preparers for their 2020 taxes: 93.7%
Here:
94%
State:
92%
(% for various income ranges: 93.9% for AGIs below $25k, 94.1% for AGIs $25k-50k, 93.0% for AGIs $50k-75k, 94.0% for AGIs $75k-100k, 92.6% for AGIs $100k-200k, 100.0% for AGIs over 200k)
Averages for the 2012 tax year for zip code 76539, filed in 2013:
Average Adjusted Gross Income (AGI) in 2012: $53,414 (Individual Income Tax Returns)
Here:
$53,414
State:
$65,384
Salary/wage: $46,434 (reported on 83.5% of returns)
Here:
$46,434
State:
$52,524
(% of AGI for various income ranges: 78.0% for AGIs below $25k, 78.4% for AGIs $25k-50k, 71.2% for AGIs $50k-75k, 74.0% for AGIs $75k-100k, 77.4% for AGIs $100k-200k, 38.7% for AGIs over 200k)
Taxable interest for individuals: $659 (reported on 30.7% of returns)
This zip code:
$659
Texas:
$2,372
(% of AGI for various income ranges: 1.2% for AGIs below $25k, 0.3% for AGIs $25k-50k, 0.4% for AGIs $50k-75k, 0.2% for AGIs $75k-100k, 0.2% for AGIs $100k-200k, 0.6% for AGIs over 200k)
Ordinary dividends: $1,700 (reported on 13.1% of returns)
Here:
$1,700
State:
$9,721
(% of AGI for various income ranges: 0.8% for AGIs below $25k, 0.2% for AGIs $25k-50k, 0.5% for AGIs $50k-75k, 0.4% for AGIs $75k-100k, 0.5% for AGIs $100k-200k)
Net capital gain/loss in AGI: +$10,276 (reported on 9.2% of returns)
Here:
+$10,276
State:
+$35,319
(% of AGI for various income ranges: 0.3% for AGIs $50k-75k, 0.5% for AGIs $75k-100k, 5.7% for AGIs $100k-200k)
Profit/loss from business: +$8,290 (reported on 13.7% of returns)
Here:
+$8,290
State:
+$13,732
(% of AGI for various income ranges: 5.5% for AGIs below $25k, 2.5% for AGIs $25k-50k, 1.6% for AGIs $50k-75k, 1.7% for AGIs $75k-100k, 2.2% for AGIs $100k-200k)
Taxable individual retirement arrangement distribution: $13,200 (reported on 7.0% of returns)
76539:
$13,200
Texas:
$19,511
(% of AGI for various income ranges: 2.2% for AGIs below $25k, 1.7% for AGIs $25k-50k, 1.6% for AGIs $50k-75k, 1.7% for AGIs $75k-100k, 2.2% for AGIs $100k-200k)
Total itemized deductions: $18,477 (20% of AGI, reported on 23.2% of returns)
Here:
$18,477
State:
$24,724
Here:
20.2% of AGI
State:
15.9% of AGI
(% of AGI for various income ranges: 7.8% for AGIs below $25k, 6.1% for AGIs $25k-50k, 8.7% for AGIs $50k-75k, 8.3% for AGIs $75k-100k, 8.8% for AGIs $100k-200k, 7.2% for AGIs over 200k)
Charity contributions: $4,353 (reported on 16.2% of returns)
Here:
$4,353
State:
$6,808
(% of AGI for various income ranges: 0.8% for AGIs below $25k, 0.7% for AGIs $25k-50k, 1.6% for AGIs $50k-75k, 1.3% for AGIs $75k-100k, 1.6% for AGIs $100k-200k, 1.4% for AGIs over 200k)
Taxes paid: $4,879 (reported on 22.9% of returns)
76539:
$4,879
State:
$6,921
(% of AGI for various income ranges: 1.6% for AGIs below $25k, 1.4% for AGIs $25k-50k, 2.1% for AGIs $50k-75k, 2.4% for AGIs $75k-100k, 2.6% for AGIs $100k-200k, 1.6% for AGIs over 200k)
Earned income credit: $2,240 (reported on 17.6% of returns)
Here:
$2,240
State:
$2,570
(% of AGI for various income ranges: 6.4% for AGIs below $25k, 1.4% for AGIs $25k-50k)
Percentage of individuals using paid preparers for their 2012 taxes: 41.6%
Here:
42%
State:
51%
(% for various income ranges: 37.8% for AGIs below $25k, 40.4% for AGIs $25k-50k, 44.1% for AGIs $50k-75k, 45.5% for AGIs $75k-100k, 44.2% for AGIs $100k-200k, 75.0% for AGIs over 200k)
Averages for the 2004 tax year for zip code 76539, filed in 2005:
Average Adjusted Gross Income (AGI) in 2004: $39,122 (Individual Income Tax Returns)
Here:
$39,122
State:
$47,881
Salary/wage: $36,501 (reported on 86.7% of returns)
Here:
$36,501
State:
$41,947
(% of AGI for various income ranges: 172.7% for AGIs below $10k, 78.2% for AGIs $10k-25k, 83.6% for AGIs $25k-50k, 81.5% for AGIs $50k-75k, 82.4% for AGIs $75k-100k, 69.7% for AGIs over 100k)
Taxable interest for individuals: $667 (reported on 37.4% of returns)
This zip code:
$667
Texas:
$2,255
(% of AGI for various income ranges: 5.5% for AGIs below $10k, 1.1% for AGIs $10k-25k, 0.7% for AGIs $25k-50k, 0.6% for AGIs $50k-75k, 0.3% for AGIs $75k-100k, 0.4% for AGIs over 100k)
Taxable dividends: $950 (reported on 15.7% of returns)
Here:
$950
State:
$4,261
(% of AGI for various income ranges: 2.1% for AGIs below $10k, 0.2% for AGIs $10k-25k, 0.1% for AGIs $25k-50k, 0.2% for AGIs $50k-75k, 0.3% for AGIs $75k-100k, 1.0% for AGIs over 100k)
Net capital gain/loss: +$6,668 (reported on 11.3% of returns)
Here:
+$6,668
State:
+$16,110
(% of AGI for various income ranges: 2.3% for AGIs below $10k, 0.3% for AGIs $10k-25k, 0.3% for AGIs $25k-50k, 0.9% for AGIs $50k-75k, 0.8% for AGIs $75k-100k, 7.4% for AGIs over 100k)
Profit/loss from business: +$8,747 (reported on 15.6% of returns)
Here:
+$8,747
State:
+$11,013
(% of AGI for various income ranges: 3.4% for AGIs below $10k, 5.7% for AGIs $10k-25k, 3.7% for AGIs $25k-50k, 1.8% for AGIs $50k-75k, 2.9% for AGIs $75k-100k, 4.9% for AGIs over 100k)
IRA payment deduction: $2,453 (reported on 2.1% of returns)
76539:
$2,453
Texas:
$3,120
Total itemized deductions: $15,044 (22% of AGI, reported on 22.1% of returns)
Here:
$15,044
State:
$19,631
Here:
22.2% of AGI
State:
18.9% of AGI
(% of AGI for various income ranges: 15.6% for AGIs below $10k, 6.6% for AGIs $10k-25k, 8.0% for AGIs $25k-50k, 8.8% for AGIs $50k-75k, 8.9% for AGIs $75k-100k, 9.0% for AGIs over 100k)
Charity contributions deductions: $3,369 (5% of AGI, reported on 17.5% of returns)
Here:
$3,369
State:
$4,753
Here:
4.6% of AGI
State:
4.2% of AGI
(% of AGI for various income ranges: 0.4% for AGIs below $10k, 0.5% for AGIs $10k-25k, 1.3% for AGIs $25k-50k, 1.7% for AGIs $50k-75k, 1.6% for AGIs $75k-100k, 2.0% for AGIs over 100k)
Total tax: $5,078 (reported on 72.8% of returns)
76539:
$5,078
State:
$9,058
(% of AGI for various income ranges: 4.1% for AGIs below $10k, 3.6% for AGIs $10k-25k, 6.4% for AGIs $25k-50k, 8.7% for AGIs $50k-75k, 11.2% for AGIs $75k-100k, 16.1% for AGIs over 100k)
Earned income credit: $1,764 (reported on 18.0% of returns)
Here:
$1,764
State:
$2,024
Percentage of individuals using paid preparers for their 2004 taxes: 52.6%
Here:
53%
State:
57%
(% for various income ranges: 48.0% for AGIs below $10k, 54.3% for AGIs $10k-25k, 54.0% for AGIs $25k-50k, 51.6% for AGIs $50k-75k, 50.2% for AGIs $75k-100k, 63.4% for AGIs over 100k)
Household received Food Stamps/SNAP in the past 12 months: 109 Household did not receive Food Stamps/SNAP in the past 12 months: 3,178
Women who had a birth in the past 12 months: 59 (59 now married, 1 unmarried) Women who did not have a birth in the past 12 months: 1,669 (865 now married, 799 unmarried)
Housing units in zip code 76539 with a mortgage: 1,989 (63 second mortgage, 68 both second mortgage and home equity loan) Median monthly owner costs for units with a mortgage: $1,634 Median monthly owner costs for units without a mortgage: $634
Residents with income below the poverty level in 2022:
This zip code:
6.9%
Whole state:
14.0%
Residents with income below 50% of the poverty level in 2022:
This zip code:
3.6%
Whole state:
7.4%
Median number of rooms in houses and condos:
Here:
6.5
State:
6.3
Median number of rooms in apartments:
Here:
4.8
State:
4.0
Notable locations in this zip code not listed on our city pages
Notable locations in zip code 76539: Kempner Volunteer Fire Department Station 2 (A), Kempner Volunteer Fire Department (B), Capital Ambulance Service (C). Display/hide their locations on the map
Churches in zip code 76539 include: Southern Hills Baptist Church (A), Oak Hills Baptist Church (B), Victory Baptist Church (C), Clay Rock Church (D), Clear Creek Church (E), Grundyville Church (F). Display/hide their locations on the map
Cemeteries: Smith Cemetery (1), Browning Cemetery (2), Ethridge Cemetery (3), Kempner Cemetery (4), Rock Church Cemetery (5), Pickett Cemetery (6), Garner Cemetery (7). Display/hide their locations on the map
Streams, rivers, and creeks: Panther Den Branch (A), Burnet Branch (B), Taylor Creek (C), Sulphur Creek (D), Rocky Creek (E), Road Hollow Creek (F), Mesquite Creek (G), Lucy Creek (H), Fall Creek (I). Display/hide their locations on the map
Size of family households: 1,165 2-persons, 465 3-persons, 387 4-persons, 383 5-persons, 36 6-persons
Size of nonfamily households: 655 1-person, 192 2-persons, 11 3-persons
1,290 married couples with children.
270 single-parent households (21 men, 249 women).
89.9% of residents of 76539 zip code speak English at home.
5.9% of residents speak Spanish at home (88% very well, 2% well, 1% not well, 8% not at all).
3.4% of residents speak other Indo-European language at home (92% very well, 8% well).
0.9% of residents speak Asian or Pacific Island language at home (38% very well, 62% well).
0.3% of residents speak other language at home (100% very well).
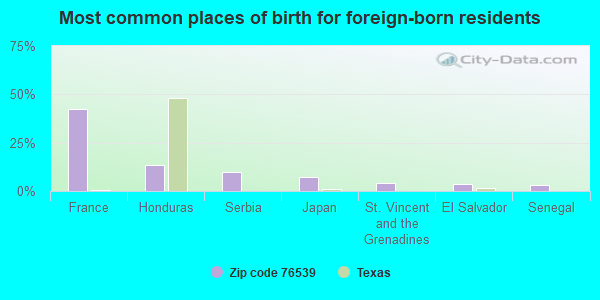
Foreign born population: 643 (7.2%) (58.7% of them are naturalized citizens)
This zip code:
7.2%
Whole state:
17.2%
42%France
13%Honduras
10%Serbia
7%Japan
4%St. Vincent and the Grenadines
4%El Salvador
3%Senegal
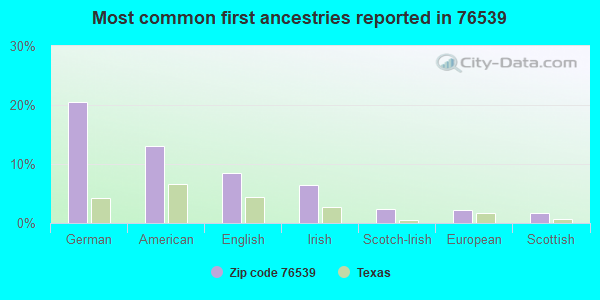
21%German
13%American
9%English
6%Irish
2%Scotch-Irish
2%European
2%Scottish
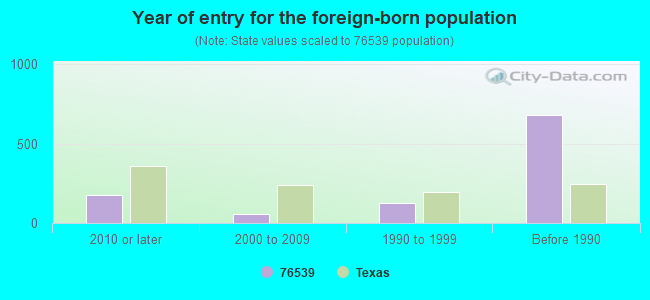
Year of entry for the foreign-born population
1742010 or later
592000 to 2009
1291990 to 1999
681Before 1990
Housing units lacking complete plumbing facilities: 6.6% Housing units lacking complete kitchen facilities: 6.3%
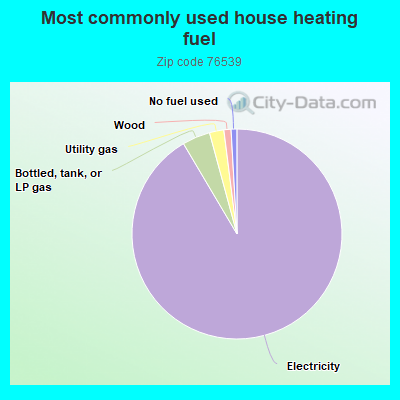
91.4%Electricity
4.3%Bottled, tank, or LP gas
2.2%Utility gas
1.1%Wood
0.9%No fuel used
Population in 1990: 3,884. Population change in the 1990s: +1,889 (+48.6%).
Place of birth for U.S.-born residents:
This state: 3,800
Northeast: 384
Midwest: 1,074
South: 1,340
West: 1,322
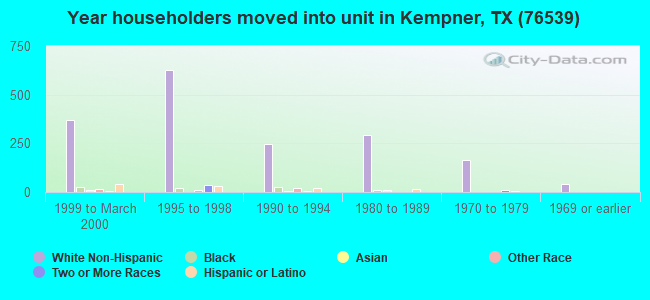
47% of the 76539 zip code residents lived in the same house 5 years ago. Out of people who lived in different houses, 18% lived in this county. Out of people who lived in different counties, 50% lived in Texas.
92% of the 76539 zip code residents lived in the same house 1 year ago. Out of people who lived in different houses, 36% moved from this county. Out of people who lived in different houses, 53% moved from different county within same state. Out of people who lived in different houses, 8% moved from different state. Out of people who lived in different houses, 5% moved from abroad.
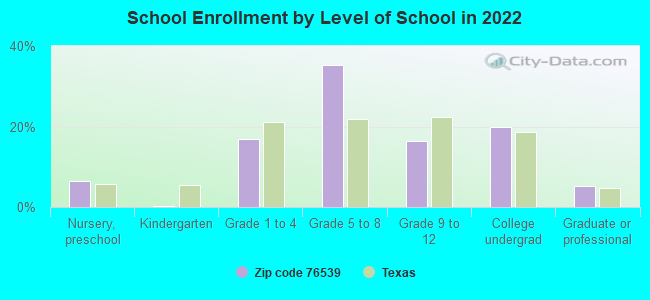
Private vs. public school enrollment:
Students in private schools in grades 1 to 8 (elementary and middle school): 161
Here:
14.8%
Texas:
8.8%
Students in private schools in grades 9 to 12 (high school):
Here:
0.0%
Texas:
8.0%
Students in private undergraduate colleges: 52
Here:
12.7%
Texas:
16.2%
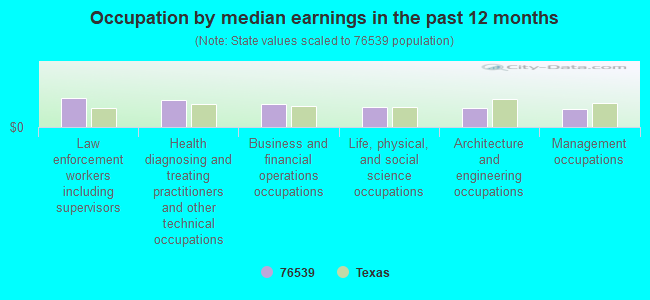
Occupation by median earnings in the past 12 months ($)
109,969Law enforcement workers including supervisors
100,976Health diagnosing and treating practitioners and other technical occupations
86,058Business and financial operations occupations
75,808Life, physical, and social science occupations
69,413Architecture and engineering occupations
67,717Management occupations
Companies with federal contracts located in this zip code (KEMPNER, TX):
MARY ANN & PAUL KING (1807 CR3340; small business) : $74,630 in 12 contractsfrom 2001 to 2006
Contracts for Recreation Site Maintenance Services (non-construction), Operation of Government-Owned Facilities -- Recreation Facilities (Non-Building), Facilities Operations Support Services by U.S. Army Corps of Engineers - civil program financing only, Army Signed by year:2000: $0; 2001: $6,900; 2002: $0; 2003: $10,400; 2004: $20,670; 2005: $18,980; 2006: $17,680.
Biggest contracts:
$10,400 with U.S. Army Corps of Engineers - civil program financing only for Recreation Site Maintenance Services (non-construction). Signed on 2003-02-18. Completion date: 2003-11-06.
$8,840 with Army for Operation of Government-Owned Facilities -- Recreation Facilities (Non-Building). Taking place in AR. Signed on 2006-02-17. Completion date: 2005-11-01.
$8,840, same as above.Signed on 2006-02-13. Completion date: 2005-11-01.
$8,775 with U.S. Army Corps of Engineers - civil program financing only for Operation of Government-Owned Facilities -- Recreation Facilities (Non-Building). Taking place in AR. Signed on 2004-03-03. Completion date: 2004-11-01.
BAR-B PLUMBING CO ,INC (3330 LOIS LN; small business)
$27,500 with Army for Industrial Boilers. Signed on 2003-03-08. Completion date: 2003-04-25.
MACK RUSZKIEWICZ (RT I BOX 1533; small business) : $21,899 in 21 contractsfrom 2001 to 2006
Contracts for Chaplain Services, Care of Remains and/or Funeral Services, Arts/Graphics Services, Other Social Services, and moreby Army Signed by year:2000: $0; 2001: $765; 2002: $5,564; 2003: $11,264; 2004: $4,032; 2005: -$626; 2006: $900.
Biggest contracts:
$5,800 with Army for Chaplain Services. Signed on 2004-10-13. Completion date: 2005-09-30.
$5,068 with Army for Care of Remains and/or Funeral Services. Signed on 2003-10-03. Completion date: 2004-09-30.
$4,588 with Army for Arts/Graphics Services. Signed on 2003-10-02. Completion date: 2004-09-30.
$3,740 with Army for Chaplain Services. Signed on 2002-01-09. Completion date: 2002-09-30.
AIRMAX (2768 BOYS RANCH RD; small business)
$15,220 with Army for Maintenance, Repair or Alteration of Real Property -- Office Buildings. Signed on 2005-08-30. Completion date: 2005-09-30.
DORIS E HYDE (485 COUNTY ROAD 4492; small business) : $9,686 in 8 contractsfrom 2001 to 2004
Contracts for Chaplain Services by Army Signed by year:2000: $0; 2001: $495; 2002: $6,059; 2003: $3,306; 2004: -$174; 2005: $0; 2006: $0.
Biggest contracts:
$3,306 with Army for Chaplain Services. Signed on 2003-10-02. Completion date: 2004-09-30.
$3,306, same as above.Signed on 2002-10-07. Completion date: 2003-09-30.
$2,695, same as above.Signed on 2002-01-09. Completion date: 2002-09-30.
$275, same as above.Signed on 2001-11-30. Completion date: 2002-09-30.
Top industries in this zip code by the number of employees in 2005:
Finance and Insurance: Credit Unions (50-99 employees: 1 establishment)
Construction: Plumbing, Heating, and Air-Conditioning Contractors (5-9: 1, 1-4: 5)
Other Services (except Public Administration): Civic and Social Organizations (10-19: 1, 1-4: 1)
Construction: Poured Concrete Foundation and Structure Contractors (10-19: 1, 1-4: 1)
Utilities: Water Supply and Irrigation Systems (10-19: 1)
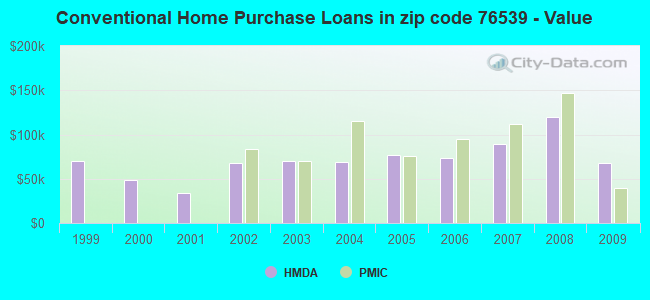
Detailed PMIC statistics for the following Tracts:0108.02
2002 - 2018 National Fire Incident Reporting System (NFIRS) incidents
According to the data from the years 2002 - 2018 the average number of fires per year is 65. The highest number of fire incidents - 108 took place in 2011, and the least - 2 in 2013. The data has an increasing trend.
When looking into fire subcategories, the most incidents belonged to: Outside Fires (68.0%), and Structure Fires (17.2%).
Fire incident types reported to NFIRS in Zip Code 76539


 Nearest zip codes: 76522, 78608, 76549, 76550, 76544, 76542.


 : $74,630 in 12 contracts from 2001 to 2006

 According to the data from the years 2002 - 2018 the average number of fires per year is 65. The highest number of fire incidents - 108 took place in 2011, and the least - 2 in 2013. The data has an increasing trend.
 When looking into fire subcategories, the most incidents belonged to: Outside Fires (68.0%), and Structure Fires (17.2%).