Estimated zip code population in 2022: 3,281 Zip code population in 2010: 3,046 Zip code population in 2000: 2,558
Houses and condos: 1,509 Renter-occupied apartments: 312
% of renters here:
23%
State:
38%
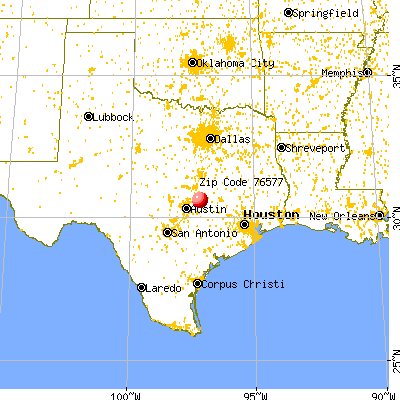
March 2022 cost of living index in zip code 76577: 79.0 (low, U.S. average is 100)
Land area: 151.1 sq. mi. Water area: 1.3 sq. mi.
Population density: 22 people per square mile
(very low).
OSM Map
General Map
Google Map
MSN Map
OSM Map
General Map
Google Map
MSN Map
OSM Map
General Map
Google Map
MSN Map
OSM Map
General Map
Google Map
MSN Map
Please wait while loading the map...
Real estate property taxes paid for housing units in 2022:
This zip code:
0.9% ($1,414)
Texas:
1.5% ($4,050)
Median real estate property taxes paid for housing units with mortgages in 2022: $1,536 (0.7%) Median real estate property taxes paid for housing units with no mortgage in 2022: $1,036 (0.8%)
Averages for the 2020 tax year for zip code 76577, filed in 2021:
Average Adjusted Gross Income (AGI) in 2020: $70,722 (Individual Income Tax Returns)
Here:
$70,722
State:
$77,054
Salary/wage: $63,250 (reported on 80.5% of returns)
Here:
$63,250
State:
$62,766
(% of AGI for various income ranges: 1201.5% for AGIs below $25k, 3610.9% for AGIs $25k-50k, 6766.0% for AGIs $50k-75k, 9436.4% for AGIs $75k-100k, 18471.9% for AGIs $100k-200k, 49983.3% for AGIs over 200k)
Taxable interest for individuals: $882 (reported on 32.1% of returns)
This zip code:
$882
Texas:
$2,665
(% of AGI for various income ranges: 14.8% for AGIs below $25k, 9.1% for AGIs $25k-50k, 42.7% for AGIs $50k-75k, 43.6% for AGIs $75k-100k, 106.9% for AGIs $100k-200k, 293.3% for AGIs over 200k)
Ordinary dividends: $4,243 (reported on 14.5% of returns)
Here:
$4,243
State:
$10,044
(% of AGI for various income ranges: 14.5% for AGIs below $25k, 10.3% for AGIs $25k-50k, 110.0% for AGIs $50k-75k, 100.0% for AGIs $75k-100k, 186.2% for AGIs $100k-200k, 1070.0% for AGIs over 200k)
Net capital gain/loss in AGI: +$18,932 (reported on 15.7% of returns)
Here:
+$18,932
State:
+$39,590
(% of AGI for various income ranges: 8.8% for AGIs below $25k, 53.0% for AGIs $25k-50k, 36.7% for AGIs $50k-75k, 421.8% for AGIs $75k-100k, 565.6% for AGIs $100k-200k, 10350.0% for AGIs over 200k)
Profit/loss from business: +$8,470 (reported on 17.0% of returns)
Here:
+$8,470
State:
+$10,888
(% of AGI for various income ranges: 90.9% for AGIs below $25k, 74.5% for AGIs $25k-50k, 386.0% for AGIs $50k-75k, 233.6% for AGIs $75k-100k, 565.6% for AGIs $100k-200k)
Taxable individual retirement arrangement distribution: $27,708 (reported on 8.2% of returns)
76577:
$27,708
Texas:
$24,740
(% of AGI for various income ranges: 50.0% for AGIs below $25k, 47.6% for AGIs $25k-50k, 188.7% for AGIs $50k-75k, 421.8% for AGIs $75k-100k, 1583.1% for AGIs $100k-200k)
Total itemized deductions: $31,510 (reported on 6.3% of returns)
Here:
$31,510
State:
$40,428
(% of AGI for various income ranges: 621.3% for AGIs $50k-75k, 516.2% for AGIs $100k-200k, 4643.3% for AGIs over 200k)
Charity contributions: $10,767 (reported on 3.8% of returns)
Here:
$10,767
State:
$18,201
(% of AGI for various income ranges: 50.9% for AGIs $25k-50k, 97.5% for AGIs $100k-200k, 1073.3% for AGIs over 200k)
Taxes paid: $6,230 (reported on 6.3% of returns)
76577:
$6,230
State:
$7,821
(% of AGI for various income ranges: 122.7% for AGIs $50k-75k, 128.8% for AGIs $100k-200k, 776.7% for AGIs over 200k)
Earned income credit: $2,368 (reported on 13.8% of returns)
Here:
$2,368
State:
$2,584
(% of AGI for various income ranges: 92.1% for AGIs below $25k, 65.8% for AGIs $25k-50k)
Percentage of individuals using paid preparers for their 2020 taxes: 89.3%
Here:
89%
State:
92%
(% for various income ranges: 89.4% for AGIs below $25k, 90.2% for AGIs $25k-50k, 86.4% for AGIs $50k-75k, 93.3% for AGIs $75k-100k, 88.9% for AGIs $100k-200k, 85.7% for AGIs over 200k)
Averages for the 2012 tax year for zip code 76577, filed in 2013:
Average Adjusted Gross Income (AGI) in 2012: $50,542 (Individual Income Tax Returns)
Here:
$50,542
State:
$65,384
Salary/wage: $44,801 (reported on 83.2% of returns)
Here:
$44,801
State:
$52,524
(% of AGI for various income ranges: 72.3% for AGIs below $25k, 80.4% for AGIs $25k-50k, 76.6% for AGIs $50k-75k, 78.7% for AGIs $75k-100k, 103.5% for AGIs $100k-200k)
Taxable interest for individuals: $951 (reported on 32.8% of returns)
This zip code:
$951
Texas:
$2,372
(% of AGI for various income ranges: 2.2% for AGIs below $25k, 0.7% for AGIs $25k-50k, 0.8% for AGIs $50k-75k, 0.1% for AGIs $75k-100k, 0.5% for AGIs $100k-200k)
Ordinary dividends: $3,932 (reported on 14.5% of returns)
Here:
$3,932
State:
$9,721
(% of AGI for various income ranges: 0.7% for AGIs below $25k, 0.4% for AGIs $25k-50k, 0.1% for AGIs $50k-75k, 0.3% for AGIs $75k-100k, 3.6% for AGIs $100k-200k)
Net capital gain/loss in AGI: +$4,050 (reported on 13.7% of returns)
Here:
+$4,050
State:
+$35,319
(% of AGI for various income ranges: 6.5% for AGIs below $25k, 0.9% for AGIs $25k-50k, 0.3% for AGIs $50k-75k, 3.4% for AGIs $100k-200k)
Profit/loss from business: +$6,439 (reported on 17.6% of returns)
Here:
+$6,439
State:
+$13,732
(% of AGI for various income ranges: 4.5% for AGIs below $25k, 3.3% for AGIs $25k-50k, 1.9% for AGIs $50k-75k, 2.1% for AGIs $75k-100k, 2.2% for AGIs $100k-200k)
Taxable individual retirement arrangement distribution: $14,850 (reported on 9.2% of returns)
76577:
$14,850
Texas:
$19,511
(% of AGI for various income ranges: 2.7% for AGIs below $25k, 2.7% for AGIs $25k-50k, 2.5% for AGIs $50k-75k, 9.9% for AGIs $75k-100k)
Total itemized deductions: $17,896 (19% of AGI, reported on 17.6% of returns)
Here:
$17,896
State:
$24,724
Here:
18.6% of AGI
State:
15.9% of AGI
(% of AGI for various income ranges: 5.0% for AGIs below $25k, 4.1% for AGIs $25k-50k, 6.4% for AGIs $50k-75k, 6.6% for AGIs $75k-100k, 11.0% for AGIs $100k-200k)
Charity contributions: $4,244 (reported on 12.2% of returns)
Here:
$4,244
State:
$6,808
(% of AGI for various income ranges: 0.7% for AGIs $25k-50k, 1.1% for AGIs $50k-75k, 1.3% for AGIs $75k-100k, 1.9% for AGIs $100k-200k)
Taxes paid: $4,517 (reported on 17.6% of returns)
76577:
$4,517
State:
$6,921
(% of AGI for various income ranges: 0.9% for AGIs below $25k, 1.0% for AGIs $25k-50k, 1.5% for AGIs $50k-75k, 1.8% for AGIs $75k-100k, 3.0% for AGIs $100k-200k)
Earned income credit: $2,021 (reported on 18.3% of returns)
Here:
$2,021
State:
$2,570
(% of AGI for various income ranges: 5.8% for AGIs below $25k, 1.3% for AGIs $25k-50k)
Percentage of individuals using paid preparers for their 2012 taxes: 55.7%
Here:
56%
State:
51%
(% for various income ranges: 50.0% for AGIs below $25k, 54.3% for AGIs $25k-50k, 60.0% for AGIs $50k-75k, 66.7% for AGIs $75k-100k, 71.4% for AGIs $100k-200k)
Averages for the 2004 tax year for zip code 76577, filed in 2005:
Average Adjusted Gross Income (AGI) in 2004: $38,885 (Individual Income Tax Returns)
Here:
$38,885
State:
$47,881
Salary/wage: $37,779 (reported on 81.8% of returns)
Here:
$37,779
State:
$41,947
(% of AGI for various income ranges: 75.5% for AGIs below $10k, 73.9% for AGIs $10k-25k, 81.1% for AGIs $25k-50k, 84.1% for AGIs $50k-75k, 82.6% for AGIs $75k-100k, 69.4% for AGIs over 100k)
Taxable interest for individuals: $1,659 (reported on 43.8% of returns)
This zip code:
$1,659
Texas:
$2,255
(% of AGI for various income ranges: 7.7% for AGIs below $10k, 2.9% for AGIs $10k-25k, 1.9% for AGIs $25k-50k, 1.1% for AGIs $50k-75k, 2.5% for AGIs $75k-100k, 0.8% for AGIs over 100k)
Taxable dividends: $895 (reported on 17.6% of returns)
Here:
$895
State:
$4,261
(% of AGI for various income ranges: 1.4% for AGIs below $10k, 0.5% for AGIs $10k-25k, 0.5% for AGIs $25k-50k, 0.2% for AGIs $50k-75k, 0.5% for AGIs $75k-100k, 0.3% for AGIs over 100k)
Net capital gain/loss: +$2,785 (reported on 15.5% of returns)
Here:
+$2,785
State:
+$16,110
(% of AGI for various income ranges: -1.0% for AGIs below $10k, 0.6% for AGIs $10k-25k, 0.4% for AGIs $25k-50k, 0.4% for AGIs $50k-75k, 3.7% for AGIs $75k-100k, 1.0% for AGIs over 100k)
Profit/loss from business: +$3,340 (reported on 17.3% of returns)
Here:
+$3,340
State:
+$11,013
(% of AGI for various income ranges: 4.1% for AGIs below $10k, 3.5% for AGIs $10k-25k, 1.6% for AGIs $25k-50k, 1.8% for AGIs $50k-75k, 0.2% for AGIs $75k-100k, 0.5% for AGIs over 100k)
IRA payment deduction: $2,706 (reported on 1.5% of returns)
76577:
$2,706
Texas:
$3,120
Total itemized deductions: $15,325 (23% of AGI, reported on 14.8% of returns)
Here:
$15,325
State:
$19,631
Here:
23.0% of AGI
State:
18.9% of AGI
(% of AGI for various income ranges: 4.3% for AGIs $10k-25k, 5.4% for AGIs $25k-50k, 5.8% for AGIs $50k-75k, 7.7% for AGIs $75k-100k, 6.2% for AGIs over 100k)
Charity contributions deductions: $2,937 (4% of AGI, reported on 11.1% of returns)
Here:
$2,937
State:
$4,753
Here:
4.2% of AGI
State:
4.2% of AGI
(% of AGI for various income ranges: 0.8% for AGIs $25k-50k, 0.9% for AGIs $50k-75k, 1.2% for AGIs $75k-100k, 1.0% for AGIs over 100k)
Total tax: $4,700 (reported on 75.8% of returns)
76577:
$4,700
State:
$9,058
(% of AGI for various income ranges: 2.5% for AGIs below $10k, 4.3% for AGIs $10k-25k, 6.9% for AGIs $25k-50k, 8.6% for AGIs $50k-75k, 10.0% for AGIs $75k-100k, 16.9% for AGIs over 100k)
Earned income credit: $1,906 (reported on 15.8% of returns)
Here:
$1,906
State:
$2,024
Percentage of individuals using paid preparers for their 2004 taxes: 61.8%
Here:
62%
State:
57%
(% for various income ranges: 58.3% for AGIs below $10k, 66.1% for AGIs $10k-25k, 60.1% for AGIs $25k-50k, 59.3% for AGIs $50k-75k, 67.3% for AGIs $75k-100k, 63.3% for AGIs over 100k)
Likely homosexual households (counted as self-reported same-sex unmarried-partner households)
Lesbian couples: 0.0% of all households
Gay men: 0.5% of all households
Household received Food Stamps/SNAP in the past 12 months: 171 Household did not receive Food Stamps/SNAP in the past 12 months: 1,163
Women who had a birth in the past 12 months: 74 (75 now married, 0 unmarried) Women who did not have a birth in the past 12 months: 562 (301 now married, 259 unmarried)
Housing units in zip code 76577 with a mortgage: 494 (19 second mortgage, 21 both second mortgage and home equity loan) Houses without a mortgage: 24
Median monthly owner costs for units with a mortgage: $1,272 Median monthly owner costs for units without a mortgage: $410
Residents with income below the poverty level in 2022:
This zip code:
10.9%
Whole state:
14.0%
Residents with income below 50% of the poverty level in 2022:
This zip code:
3.5%
Whole state:
7.4%
Median number of rooms in houses and condos:
Here:
5.8
State:
6.3
Median number of rooms in apartments:
Here:
4.8
State:
4.0
Notable locations in this zip code not listed on our city pages
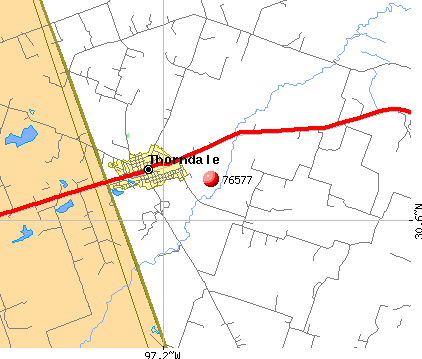
Notable locations in zip code 76577: Watson Branch (A), Thorndale Volunteer Fire Department (B), Thorndale Volunteer Emergency Medical Services (C). Display/hide their locations on the map
Churches in zip code 76577 include: Pleasant Retreat Church (A), Springfield Church (B), Lilac Church (C), Saint John Church (D), Saint Johns Church (E). Display/hide their locations on the map
Cemeteries: Bingham Cemetery (1), Laughlin Cemetery (2), Locklin Cemetery (3), Liberty Hill Cemetery (4), San Andres Cemetery (5), Felton Cemetery (6), Thorndale Cemetery (7). Display/hide their locations on the map
Lakes and reservoirs: Jackson Lake (A), Ellett Camp and Glaser Lake (B), Site Number Twentyfour (C), Soil Conservation Service Site 10 Reservoir (D), Soil Conservation Service Site 24 Reservoir (E), City Lake Number Two (F), Alcoa Lake (G). Display/hide their locations on the map
Streams, rivers, and creeks: Berry Branch (A), Wolf Branch (B), Sandy Creek (C), Schoolhouse Branch (D), Salty Creek (E), Pecan Creek (F), Knight Branch (G), Holynok Creek (H), Turkey Creek (I). Display/hide their locations on the map
Size of family households: 435 2-persons, 193 3-persons, 179 4-persons, 142 5-persons, 3 6-persons
Size of nonfamily households: 301 1-person, 62 2-persons, 13 3-persons
419 married couples with children.
198 single-parent households (45 men, 153 women).
86.5% of residents of 76577 zip code speak English at home.
12.9% of residents speak Spanish at home (84% very well, 8% well, 7% not well).
0.7% of residents speak other Indo-European language at home (100% very well).
Foreign born population: 57 (1.7%) (27.0% of them are naturalized citizens)
This zip code:
1.7%
Whole state:
17.2%
76%Honduras
9%United Kingdom, excluding England and Scotland
9%France
7%Sweden
21%German
15%American
7%English
6%Irish
4%European
3%African
3%Czech
Year of entry for the foreign-born population
02010 or later
22000 to 2009
291990 to 1999
34Before 1990
Facilities with environmental interests located in this zip code:
ANDERSON CLAYTON HEXANE EXTRACTION (U.S. HIGHWAY 79 in THORNDALE, TX)
AIR MAJOR (AIRS/AFS) Business SIC classification: COTTONSEED OIL MILLS
Housing units lacking complete plumbing facilities: 5.1% Housing units lacking complete kitchen facilities: 4.7%
57.5%Electricity
25.8%Utility gas
10.8%Bottled, tank, or LP gas
6.0%Other fuel
Population in 1990: 2,279. Population change in the 1990s: +279 (+12.2%).
Place of birth for U.S.-born residents:
This state: 2,642
Northeast: 112
Midwest: 139
South: 105
West: 188
64% of the 76577 zip code residents lived in the same house 5 years ago. Out of people who lived in different houses, 34% lived in this county. Out of people who lived in different counties, 50% lived in Texas.
92% of the 76577 zip code residents lived in the same house 1 year ago. Out of people who lived in different houses, 64% moved from this county. Out of people who lived in different houses, 32% moved from different county within same state. Out of people who lived in different houses, 2% moved from different state.
Private vs. public school enrollment:
Students in private schools in grades 1 to 8 (elementary and middle school): 79
Here:
25.9%
Texas:
8.8%
Students in private schools in grades 9 to 12 (high school):
Here:
0.0%
Texas:
8.0%
Students in private undergraduate colleges: 10
Here:
15.2%
Texas:
16.2%
Occupation by median earnings in the past 12 months ($)
93,898Business and financial operations occupations
87,975Computer and mathematical occupations
65,178Building and grounds cleaning and maintenance occupations
61,797Law enforcement workers including supervisors
55,436Production occupations
54,586Management occupations
Top industries in this zip code by the number of employees in 2005:
Other Services (except Public Administration): Religious Organizations (10-19 employees: 1 establishment, 1-4 employees: 3 establishments)
Finance and Insurance: Commercial Banking (10-19: 1)
Real Estate and Rental and Leasing: Lessors of Residential Buildings and Dwellings (1-4: 4)
Administrative and Support and Waste Management and Remediation Services: Security Guards and Patrol Services (5-9: 1)
Wholesale Trade: Grain and Field Bean Merchant Wholesalers (5-9: 1)
Fatal accident statistics in 2010:
Fatal accident count: 1
Vehicles involved in fatal accidents: 1
Fatal accidents caused by drunken drivers: 1
Fatalities: 1
Persons involved in fatal accidents: 1
Pedestrians involved in fatal accidents: 0
2004 - 2018 National Fire Incident Reporting System (NFIRS) incidents
According to the data from the years 2004 - 2018 the average number of fires per year is 7. The highest number of fires - 31 took place in 2016, and the least - 0 in 2008. The data has a growing trend.
When looking into fire subcategories, the most incidents belonged to: Outside Fires (73.6%), and Structure Fires (19.1%).
Fire incident types reported to NFIRS in Zip Code 76577


 Nearest zip codes: 76578, 76567, 76523, 76574, 76518, 78947.


 According to the data from the years 2004 - 2018 the average number of fires per year is 7. The highest number of fires - 31 took place in 2016, and the least - 0 in 2008. The data has a growing trend.
 When looking into fire subcategories, the most incidents belonged to: Outside Fires (73.6%), and Structure Fires (19.1%).