Estimated zip code population in 2022: 5,007 Zip code population in 2010: 4,670 Zip code population in 2000: 4,654
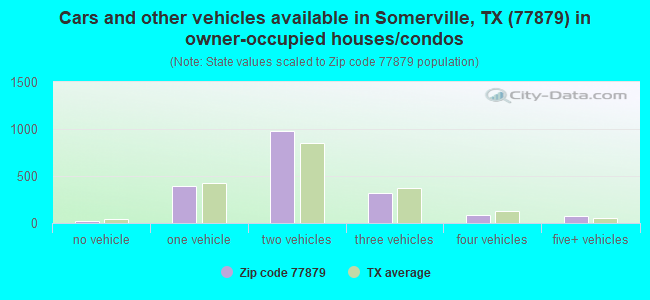
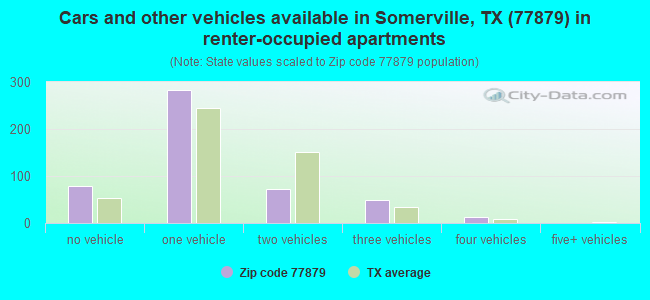
Houses and condos: 3,289 Renter-occupied apartments: 492
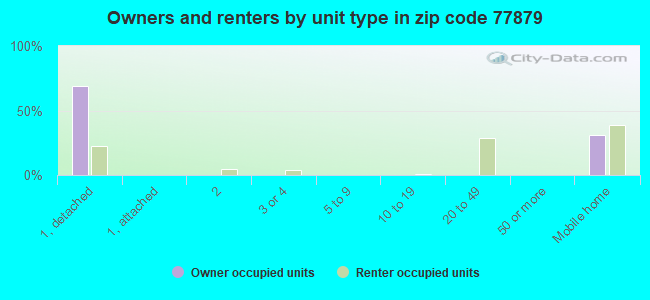
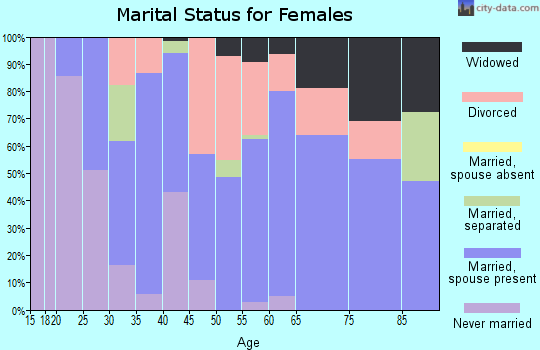
% of renters here:
21%
State:
38%
March 2022 cost of living index in zip code 77879: 78.6 (low, U.S. average is 100)
Land area: 187.5 sq. mi. Water area: 11.7 sq. mi.
Population density: 27 people per square mile
(very low).
OSM Map
General Map
Google Map
MSN Map
OSM Map
General Map
Google Map
MSN Map
OSM Map
General Map
Google Map
MSN Map
OSM Map
General Map
Google Map
MSN Map
Please wait while loading the map...
Real estate property taxes paid for housing units in 2022:
This zip code:
1.1% ($1,626)
Texas:
1.5% ($4,050)
Median real estate property taxes paid for housing units with mortgages in 2022: $1,967 (1.2%) Median real estate property taxes paid for housing units with no mortgage in 2022: $1,571 (1.1%)
Averages for the 2020 tax year for zip code 77879, filed in 2021:
Average Adjusted Gross Income (AGI) in 2020: $51,980 (Individual Income Tax Returns)
Here:
$51,980
State:
$77,054
Salary/wage: $47,412 (reported on 77.4% of returns)
Here:
$47,412
State:
$62,766
(% of AGI for various income ranges: 1180.8% for AGIs below $25k, 3427.3% for AGIs $25k-50k, 5986.8% for AGIs $50k-75k, 8312.0% for AGIs $75k-100k, 12899.4% for AGIs $100k-200k)
Taxable interest for individuals: $1,240 (reported on 23.9% of returns)
This zip code:
$1,240
Texas:
$2,665
(% of AGI for various income ranges: 16.2% for AGIs below $25k, 14.9% for AGIs $25k-50k, 30.8% for AGIs $50k-75k, 54.0% for AGIs $75k-100k, 121.8% for AGIs $100k-200k)
Ordinary dividends: $3,767 (reported on 11.7% of returns)
Here:
$3,767
State:
$10,044
(% of AGI for various income ranges: 9.7% for AGIs below $25k, 16.9% for AGIs $25k-50k, 41.6% for AGIs $50k-75k, 70.0% for AGIs $75k-100k, 127.1% for AGIs $100k-200k)
Net capital gain/loss in AGI: +$9,608 (reported on 10.4% of returns)
Here:
+$9,608
State:
+$39,590
(% of AGI for various income ranges: 10.0% for AGIs below $25k, 15.7% for AGIs $25k-50k, 65.2% for AGIs $50k-75k, 71.3% for AGIs $75k-100k, 441.2% for AGIs $100k-200k)
Profit/loss from business: +$5,734 (reported on 16.5% of returns)
Here:
+$5,734
State:
+$10,888
(% of AGI for various income ranges: 79.8% for AGIs below $25k, 103.3% for AGIs $25k-50k, 82.4% for AGIs $50k-75k, 66.0% for AGIs $75k-100k, 518.2% for AGIs $100k-200k)
Taxable individual retirement arrangement distribution: $23,058 (reported on 8.3% of returns)
77879:
$23,058
Texas:
$24,740
(% of AGI for various income ranges: 74.1% for AGIs below $25k, 103.7% for AGIs $25k-50k, 170.0% for AGIs $50k-75k, 604.0% for AGIs $75k-100k, 1229.4% for AGIs $100k-200k)
Total itemized deductions: $33,056 (reported on 3.9% of returns)
Here:
$33,056
State:
$40,428
(% of AGI for various income ranges: 90.2% for AGIs below $25k, 461.2% for AGIs $50k-75k, 748.2% for AGIs $100k-200k)
Charity contributions: $12,086 (reported on 3.0% of returns)
Here:
$12,086
State:
$18,201
(% of AGI for various income ranges: 172.4% for AGIs $50k-75k, 244.1% for AGIs $100k-200k)
Taxes paid: $5,711 (reported on 3.9% of returns)
77879:
$5,711
State:
$7,821
(% of AGI for various income ranges: 14.3% for AGIs below $25k, 65.6% for AGIs $50k-75k, 154.7% for AGIs $100k-200k)
Earned income credit: $2,485 (reported on 20.4% of returns)
Here:
$2,485
State:
$2,584
(% of AGI for various income ranges: 126.2% for AGIs below $25k, 81.2% for AGIs $25k-50k)
Percentage of individuals using paid preparers for their 2020 taxes: 92.2%
Here:
92%
State:
92%
(% for various income ranges: 90.7% for AGIs below $25k, 93.4% for AGIs $25k-50k, 93.9% for AGIs $50k-75k, 90.5% for AGIs $75k-100k, 91.7% for AGIs $100k-200k, 100.0% for AGIs over 200k)
Averages for the 2012 tax year for zip code 77879, filed in 2013:
Average Adjusted Gross Income (AGI) in 2012: $44,759 (Individual Income Tax Returns)
Here:
$44,759
State:
$65,384
Salary/wage: $42,428 (reported on 79.9% of returns)
Here:
$42,428
State:
$52,524
(% of AGI for various income ranges: 73.4% for AGIs below $25k, 81.3% for AGIs $25k-50k, 75.5% for AGIs $50k-75k, 77.3% for AGIs $75k-100k, 70.5% for AGIs $100k-200k, 74.5% for AGIs over 200k)
Taxable interest for individuals: $1,196 (reported on 26.3% of returns)
This zip code:
$1,196
Texas:
$2,372
(% of AGI for various income ranges: 0.7% for AGIs below $25k, 0.6% for AGIs $25k-50k, 0.7% for AGIs $50k-75k, 0.4% for AGIs $75k-100k, 0.6% for AGIs $100k-200k, 1.2% for AGIs over 200k)
Ordinary dividends: $4,510 (reported on 10.8% of returns)
Here:
$4,510
State:
$9,721
(% of AGI for various income ranges: 0.1% for AGIs below $25k, 0.7% for AGIs $25k-50k, 0.6% for AGIs $50k-75k, 0.2% for AGIs $75k-100k, 4.7% for AGIs $100k-200k)
Net capital gain/loss in AGI: +$4,882 (reported on 8.8% of returns)
Here:
+$4,882
State:
+$35,319
(% of AGI for various income ranges: 0.4% for AGIs below $25k, 0.3% for AGIs $25k-50k, 0.5% for AGIs $50k-75k, 0.8% for AGIs $75k-100k, 3.9% for AGIs $100k-200k)
Profit/loss from business: +$6,273 (reported on 15.5% of returns)
Here:
+$6,273
State:
+$13,732
(% of AGI for various income ranges: 9.2% for AGIs below $25k, 1.4% for AGIs $25k-50k, 1.0% for AGIs $50k-75k, 0.4% for AGIs $75k-100k, 2.7% for AGIs $100k-200k)
Taxable individual retirement arrangement distribution: $11,886 (reported on 7.2% of returns)
77879:
$11,886
Texas:
$19,511
(% of AGI for various income ranges: 1.3% for AGIs below $25k, 1.4% for AGIs $25k-50k, 3.3% for AGIs $50k-75k, 5.8% for AGIs $75k-100k)
Total itemized deductions: $20,637 (20% of AGI, reported on 13.9% of returns)
Here:
$20,637
State:
$24,724
Here:
19.8% of AGI
State:
15.9% of AGI
(% of AGI for various income ranges: 4.1% for AGIs below $25k, 7.1% for AGIs $25k-50k, 8.3% for AGIs $50k-75k, 5.2% for AGIs $75k-100k, 7.3% for AGIs $100k-200k, 5.2% for AGIs over 200k)
Charity contributions: $6,029 (reported on 8.8% of returns)
Here:
$6,029
State:
$6,808
(% of AGI for various income ranges: 1.5% for AGIs $25k-50k, 0.9% for AGIs $50k-75k, 1.1% for AGIs $75k-100k, 3.2% for AGIs $100k-200k)
Taxes paid: $4,023 (reported on 13.4% of returns)
77879:
$4,023
State:
$6,921
(% of AGI for various income ranges: 0.6% for AGIs below $25k, 1.1% for AGIs $25k-50k, 1.6% for AGIs $50k-75k, 1.0% for AGIs $75k-100k, 1.5% for AGIs $100k-200k, 1.2% for AGIs over 200k)
Earned income credit: $2,416 (reported on 25.8% of returns)
Here:
$2,416
State:
$2,570
(% of AGI for various income ranges: 9.3% for AGIs below $25k, 1.0% for AGIs $25k-50k)
Percentage of individuals using paid preparers for their 2012 taxes: 56.2%
Here:
56%
State:
51%
(% for various income ranges: 54.0% for AGIs below $25k, 51.9% for AGIs $25k-50k, 59.3% for AGIs $50k-75k, 64.3% for AGIs $75k-100k, 63.6% for AGIs $100k-200k, 100.0% for AGIs over 200k)
Averages for the 2004 tax year for zip code 77879, filed in 2005:
Average Adjusted Gross Income (AGI) in 2004: $30,346 (Individual Income Tax Returns)
Here:
$30,346
State:
$47,881
Salary/wage: $28,817 (reported on 82.2% of returns)
Here:
$28,817
State:
$41,947
(% of AGI for various income ranges: 123.6% for AGIs below $10k, 75.7% for AGIs $10k-25k, 79.3% for AGIs $25k-50k, 79.3% for AGIs $50k-75k, 82.6% for AGIs $75k-100k, 61.9% for AGIs over 100k)
Taxable interest for individuals: $1,403 (reported on 31.6% of returns)
This zip code:
$1,403
Texas:
$2,255
(% of AGI for various income ranges: 4.2% for AGIs below $10k, 2.0% for AGIs $10k-25k, 1.4% for AGIs $25k-50k, 1.2% for AGIs $50k-75k, 0.8% for AGIs $75k-100k, 1.3% for AGIs over 100k)
Taxable dividends: $1,865 (reported on 13.0% of returns)
Here:
$1,865
State:
$4,261
(% of AGI for various income ranges: 1.1% for AGIs below $10k, 0.7% for AGIs $10k-25k, 0.5% for AGIs $25k-50k, 1.0% for AGIs $50k-75k, 0.5% for AGIs $75k-100k, 1.6% for AGIs over 100k)
Net capital gain/loss: +$3,954 (reported on 10.8% of returns)
Here:
+$3,954
State:
+$16,110
(% of AGI for various income ranges: -1.4% for AGIs below $10k, 0.1% for AGIs $10k-25k, 1.4% for AGIs $25k-50k, 1.3% for AGIs $50k-75k, 1.0% for AGIs $75k-100k, 4.6% for AGIs over 100k)
Profit/loss from business: +$2,474 (reported on 14.9% of returns)
Here:
+$2,474
State:
+$11,013
(% of AGI for various income ranges: 14.6% for AGIs below $10k, 4.8% for AGIs $10k-25k, -0.6% for AGIs $25k-50k, 0.2% for AGIs $50k-75k, 0.1% for AGIs $75k-100k, 0.3% for AGIs over 100k)
IRA payment deduction: $2,429 (reported on 1.2% of returns)
77879:
$2,429
Texas:
$3,120
Total itemized deductions: $15,510 (26% of AGI, reported on 10.7% of returns)
Here:
$15,510
State:
$19,631
Here:
26.4% of AGI
State:
18.9% of AGI
(% of AGI for various income ranges: 4.8% for AGIs $10k-25k, 5.8% for AGIs $25k-50k, 5.5% for AGIs $50k-75k, 5.5% for AGIs $75k-100k, 6.6% for AGIs over 100k)
Charity contributions deductions: $3,881 (6% of AGI, reported on 7.9% of returns)
Here:
$3,881
State:
$4,753
Here:
6.1% of AGI
State:
4.2% of AGI
(% of AGI for various income ranges: 0.7% for AGIs $10k-25k, 0.9% for AGIs $25k-50k, 1.0% for AGIs $50k-75k, 0.8% for AGIs $75k-100k, 2.1% for AGIs over 100k)
Total tax: $3,821 (reported on 68.6% of returns)
77879:
$3,821
State:
$9,058
(% of AGI for various income ranges: 4.4% for AGIs below $10k, 3.7% for AGIs $10k-25k, 6.5% for AGIs $25k-50k, 8.7% for AGIs $50k-75k, 11.8% for AGIs $75k-100k, 19.1% for AGIs over 100k)
Earned income credit: $1,870 (reported on 25.0% of returns)
Here:
$1,870
State:
$2,024
Percentage of individuals using paid preparers for their 2004 taxes: 62.0%
Here:
62%
State:
57%
(% for various income ranges: 56.6% for AGIs below $10k, 62.7% for AGIs $10k-25k, 62.2% for AGIs $25k-50k, 68.0% for AGIs $50k-75k, 62.2% for AGIs $75k-100k, 69.2% for AGIs over 100k)
Household received Food Stamps/SNAP in the past 12 months: 242 Household did not receive Food Stamps/SNAP in the past 12 months: 2,113
Women who had a birth in the past 12 months: 56 (5 now married, 49 unmarried) Women who did not have a birth in the past 12 months: 919 (558 now married, 356 unmarried)
Housing units in zip code 77879 with a mortgage: 547 Median monthly owner costs for units with a mortgage: $1,179 Median monthly owner costs for units without a mortgage: $494
Residents with income below the poverty level in 2022:
This zip code:
16.2%
Whole state:
14.0%
Residents with income below 50% of the poverty level in 2022:
This zip code:
8.2%
Whole state:
7.4%
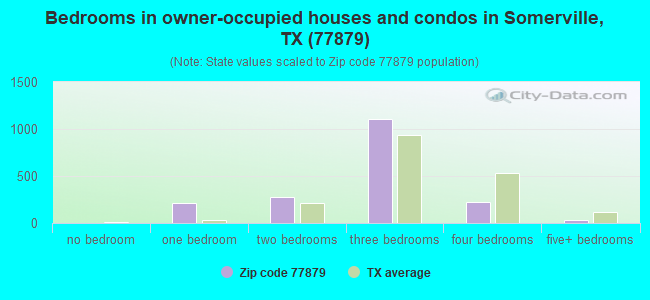
Median number of rooms in houses and condos:
Here:
5.4
State:
6.3
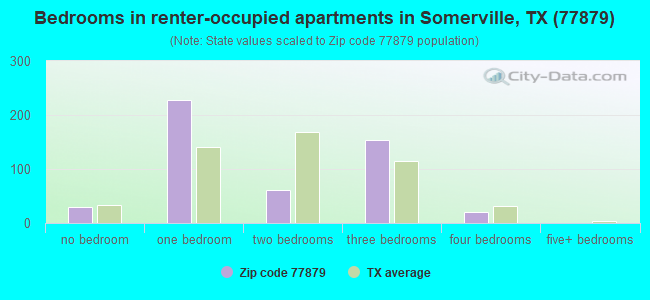
Median number of rooms in apartments:
Here:
3.6
State:
4.0
Notable locations in this zip code not listed on our city pages
Notable locations in zip code 77879: Center Line (A), Chances Store (B), Little Flock (C), Somerville Historical Museum (D), Sommerville Volunteer Fire Department (E), Birch Creek Area Volunteer Fire Department (F), Medic 22 (G). Display/hide their locations on the map
Churches in zip code 77879 include: Sweet Home Church (A), Bare Branch Church (B), Czech Church (C), Lone Oak Church (D). Display/hide their locations on the map
Cemeteries: Schoppe Cemetery (1), Birch Cemetery (2), Clay Cemetery (3), Thomas Cemetery (4), Lawrence Cemetery (5), Oak Lawn Cemetery (6), Graveyard Crossing Cemetery (7). Display/hide their locations on the map
Lakes and reservoirs: Middle Bayou (A), Lamb Lake (B), Schlindler Lake (C), Giesensclag Lake (D), Ward Lake (E), Newman Lake (F), Gerland Lake (G), Edwards Lake (H). Display/hide their locations on the map
Streams, rivers, and creeks: Berry Creek (A), Bell Creek (B), Bare Branch (C), Birch Creek (D), Wolf Creek (E), Big Creek (F), Yegua Creek (G), White Creek (H), Hickory Creek (I). Display/hide their locations on the map
Parks in zip code 77879 include: Lake Somerville State Park (1), Welch Park (2), Rocky Park (3), Birch Creek State Park (4), Big Creek Park (5). Display/hide their locations on the map
In group quarters: 28 (-1 institutionalized population)
Size of family households: 734 2-persons, 224 3-persons, 200 4-persons, 56 5-persons, 78 6-persons, 60 7-or-more-persons
Size of nonfamily households: 798 1-person, 226 2-persons
439 married couples with children.
211 single-parent households (134 men, 77 women).
81.8% of residents of 77879 zip code speak English at home.
17.4% of residents speak Spanish at home (37% very well, 14% well, 10% not well, 39% not at all).
0.2% of residents speak other Indo-European language at home (100% very well).
1.4% of residents speak Asian or Pacific Island language at home (47% very well, 17% well, 36% not well).
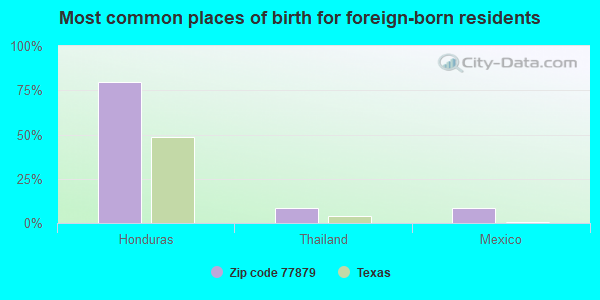
Foreign born population: 392 (7.8%) (5.1% of them are naturalized citizens)
This zip code:
7.8%
Whole state:
17.2%
80%Honduras
9%Thailand
9%Mexico
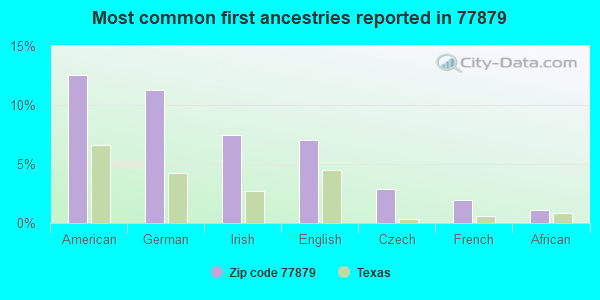
13%American
11%German
7%Irish
7%English
3%Czech
2%French
1%African
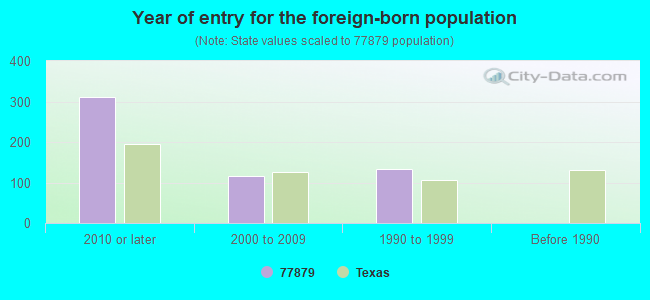
Year of entry for the foreign-born population
3102010 or later
1162000 to 2009
1331990 to 1999
0Before 1990
Facilities with environmental interests located in this zip code:
ATSF RAILWAY (PO BOX 489 HWY 39 N in SOMERVILLE, TX)
COMPLIANCE ACTIVITY (Tracking inspections of insecticide, fungicide, and rodenticide, and toxic substances) Business SIC classification: RAILROADS, LINE-HAUL OPERATING
Housing units lacking complete plumbing facilities: 5.0% Housing units lacking complete kitchen facilities: 2.6%
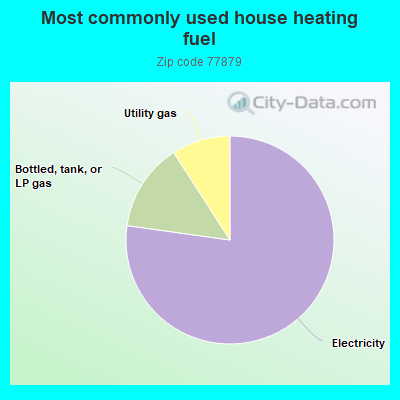
77.3%Electricity
13.7%Bottled, tank, or LP gas
9.1%Utility gas
Population in 1990: 5,752.
Place of birth for U.S.-born residents:
This state: 3,565
Northeast: 225
Midwest: 202
South: 340
West: 116
63% of the 77879 zip code residents lived in the same house 5 years ago. Out of people who lived in different houses, 47% lived in this county. Out of people who lived in different counties, 50% lived in Texas.
95% of the 77879 zip code residents lived in the same house 1 year ago. Out of people who lived in different houses, 38% moved from this county. Out of people who lived in different houses, 23% moved from different county within same state. Out of people who lived in different houses, 9% moved from different state. Out of people who lived in different houses, 38% moved from abroad.
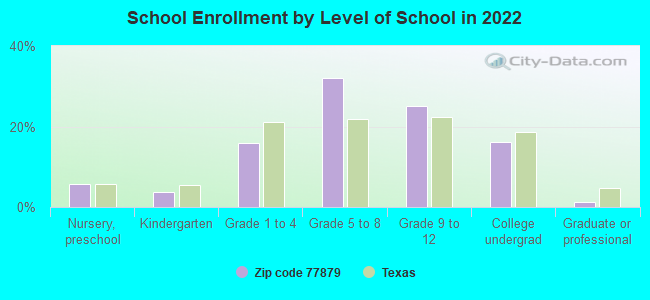
Private vs. public school enrollment:
Students in private schools in grades 1 to 8 (elementary and middle school): 18
Here:
5.0%
Texas:
8.8%
Students in private schools in grades 9 to 12 (high school):
Here:
0.0%
Texas:
8.0%
Students in private undergraduate colleges: 13
Here:
10.7%
Texas:
16.2%
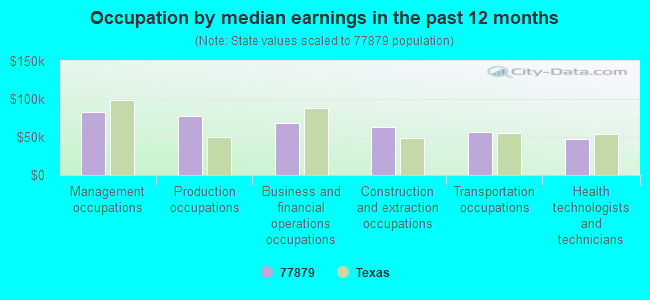
Occupation by median earnings in the past 12 months ($)
83,282Management occupations
77,890Production occupations
68,909Business and financial operations occupations
62,730Construction and extraction occupations
56,239Transportation occupations
46,827Health technologists and technicians
Companies with federal contracts located in this zip code (SOMERVILLE, TX):
DENNIS ANDERSON (2700 FM 1361; small business) : $1,164,986 in 44 contractsfrom 2001 to 2006
Contracts for Custodial Janitorial Services, Landscaping/Groundskeeping Services by Army, U.S. Army Corps of Engineers - civil program financing only Signed by year:2000: $0; 2001: $67,018; 2002: $81,834; 2003: $88,987; 2004: $453,094; 2005: $311,288; 2006: $162,765.
Biggest contracts:
$111,440 with Army for Custodial Janitorial Services. Taking place in OK. Signed on 2004-02-25. Completion date: 2005-02-28.
$111,440 with U.S. Army Corps of Engineers - civil program financing only for Custodial Janitorial Services. Taking place in OK. Signed on 2004-02-25. Completion date: 2005-02-28.
$106,876 with Army for Custodial Janitorial Services. Taking place in OK. Signed on 2006-02-16. Completion date: 2007-02-28.
$101,787 with U.S. Army Corps of Engineers - civil program financing only for Custodial Janitorial Services. Taking place in OK. Signed on 2005-03-01. Completion date: 2005-02-28.
M&R CLEANING SERVICES (513 10TH STREET; small business) : $1,029,766 in 50 contractsfrom 2002 to 2006
Contracts for Landscaping/Groundskeeping Services by Army, U.S. Army Corps of Engineers - civil program financing only Signed by year:2000: $0; 2001: $0; 2002: $73,163; 2003: $368,290; 2004: $495,916; 2005: $29,478; 2006: $62,919.
Biggest contracts:
$340,433 with Army for Landscaping/Groundskeeping Services. Signed on 2004-02-04. Completion date: 2007-09-30.
$241,768 with U.S. Army Corps of Engineers - civil program financing only for Landscaping/Groundskeeping Services. Signed on 2003-05-01. Completion date: 2007-09-30.
$43,163, same as above.Signed on 2002-12-27. Completion date: 2007-09-30.
$30,000, same as above.Signed on 2002-11-04. Completion date: 2007-09-30.
LENIS INTERNATIONAL (P O BOX 1053; small business) : $50,634 in 3 contractsfrom 2001 to 2003
$27,634 with U.S. Army Corps of Engineers - civil program financing only for Custodial Janitorial Services. Signed on 2003-04-08. Completion date: 2002-09-30.
$22,000 with Forest Service (disused code: now 12C2) for Custodial Janitorial Services. Taking place in SD. Signed on 2001-10-15. Completion date: 2002-09-15.
$1,000, same as above.Signed on 2002-06-15. Completion date: 2002-09-15.
SHOWERS CLEANING SERVICE (610 SWEETGUM; small business) : $28,992 in 3 contractsfrom 2004 to 2005
$14,518 with Army for Custodial Janitorial Services. Signed on 2005-09-27. Completion date: 2005-10-01.
$14,474, same as above.Signed on 2004-02-12. Completion date: 2004-08-19.
$0, same as above.Signed on 2004-02-12. Completion date: 2004-08-19.
OVERALL LUMBER AND HARDWARE IN (1409 HWY 36 NORTH; small business)
$11,476 with Army for Debt Collection Services. Signed on 2005-09-27. Completion date: 2005-10-01.
HARGROVE, GUY L (16770 PRIVATE RD 4004; small business) : $5,000 in 2 contractsin 2006
$5,000 with Army for Mineral Construction Materials, Bulk. Signed on 2006-06-29. Completion date: 2006-07-06.
$0, same as above.Signed on 2006-07-05. Completion date: 2006-07-06.
Top industries in this zip code by the number of employees in 2005:
Finance and Insurance: Commercial Banking (50-99 employees: 1 establishment)
Construction: Oil and Gas Pipeline and Related Structures Construction (50-99: 1)
Construction: Commercial and Institutional Building Construction (10-19: 2)
Other Services (except Public Administration): Religious Organizations (10-19: 1, 1-4: 5)
Administrative and Support and Waste Management and Remediation Services: Janitorial Services (10-19: 1, 1-4: 2)
Educational Services: Professional and Management Development Training (10-19: 1)
Accommodation and Food Services: Limited-Service Restaurants (10-19: 1)
Fatal accident statistics in 2013:
Fatal accident count: 1
Vehicles involved in fatal accidents: 1
Fatal accidents caused by drunken drivers: 0
Fatalities: 1
Persons involved in fatal accidents: 1
Pedestrians involved in fatal accidents: 0
Fatal accident statistics in 2012:
Fatal accident count: 3
Vehicles involved in fatal accidents: 4
Fatal accidents caused by drunken drivers: 0
Fatalities: 3
Persons involved in fatal accidents: 5
Pedestrians involved in fatal accidents: 0
2002 - 2018 National Fire Incident Reporting System (NFIRS) incidents
Based on the data from the years 2002 - 2018 the average number of fires per year is 14. The highest number of fire incidents - 32 took place in 2003, and the least - 6 in 2016. The data has a dropping trend.
When looking into fire subcategories, the most incidents belonged to: Outside Fires (50.0%), and Structure Fires (37.0%).
Fire incident types reported to NFIRS in Zip Code 77879


 Nearest zip codes: 77878, 77833, 77835, 77836, 77840, 77801.


 Based on the data from the years 2002 - 2018 the average number of fires per year is 14. The highest number of fire incidents - 32 took place in 2003, and the least - 6 in 2016. The data has a dropping trend.
 When looking into fire subcategories, the most incidents belonged to: Outside Fires (50.0%), and Structure Fires (37.0%).