Estimated zip code population in 2022: 28,924
Zip code population in 2010: 26,387
Zip code population in 2000: 23,633
Houses and condos: 11,008
Renter-occupied apartments: 3,256
% of renters here:
32%State:
38%
March 2022 cost of living index in zip code 78410: 86.3
(less than average, U.S. average is 100)
Land area: 22.8
sq. mi.
Water area: 0.4
sq. mi.
Population density: 1,268 people per square mile (low).
OSM Map
General Map
Google Map
MSN Map
OSM Map
General Map
Google Map
MSN Map
OSM Map
General Map
Google Map
MSN Map
OSM Map
General Map
Google Map
MSN Map
Please wait while loading the map...
Real estate property taxes paid for housing units in 2022:
This zip code:
1.7% ($4,040)Texas:
1.5% ($4,050)
Median real estate property taxes paid for housing units with mortgages in 2022: $4,618 (1.8%)
Median real estate property taxes paid for housing units with no mortgage in 2022: $3,254 (1.5%)
Profiles of local businesses
Business Search - 14 Million verified businesses
Males: 14,272 Females: 14,651
For population 25 years and over in 78410:
High school or higher: 88.6%Bachelor's degree or higher: 22.1%Graduate or professional degree: 5.2%Unemployed: 3.9%Mean travel time to work (commute): 20.3 minutes
For population 15 years and over in 78410:
Never married: 34.0%Now married: 49.9%Separated: 1.5%Widowed: 4.0%Divorced: 10.6%
Zip code 78410 compared to state average:
Black race population percentage significantly below state average. Foreign-born population percentage significantly below state average. Length of stay since moving in significantly above state average. Percentage of population with a bachelor's degree or higher below state average. 18,660 64.5% Hispanic or Latino 9,594 33.2% White 309 1.1% Black 313 1.1% Two or more races 31 0.1% Asian 15 0.05% American Indian
Data:
Median household income ($)
Median household income (% change since 2000)
Household income diversity
Ratio of average income to average house value (%)
Ratio of average income to average rent
Median household income ($) - White
Median household income ($) - Black or African American
Median household income ($) - Asian
Median household income ($) - Hispanic or Latino
Median household income ($) - American Indian and Alaska Native
Median household income ($) - Multirace
Median household income ($) - Other Race
Median household income for houses/condos with a mortgage ($)
Median household income for apartments without a mortgage ($)
Races - White alone (%)
Races - White alone (% change since 2000)
Races - Black alone (%)
Races - Black alone (% change since 2000)
Races - American Indian alone (%)
Races - American Indian alone (% change since 2000)
Races - Asian alone (%)
Races - Asian alone (% change since 2000)
Races - Hispanic (%)
Races - Hispanic (% change since 2000)
Races - Native Hawaiian and Other Pacific Islander alone (%)
Races - Native Hawaiian and Other Pacific Islander alone (% change since 2000)
Races - Two or more races (%)
Races - Two or more races (% change since 2000)
Races - Other race alone (%)
Races - Other race alone (% change since 2000)
Racial diversity
Unemployment (%)
Unemployment (% change since 2000)
Unemployment (%) - White
Unemployment (%) - Black or African American
Unemployment (%) - Asian
Unemployment (%) - Hispanic or Latino
Unemployment (%) - American Indian and Alaska Native
Unemployment (%) - Multirace
Unemployment (%) - Other Race
Population density (people per square mile)
Population - Males (%)
Population - Females (%)
Population - Males (%) - White
Population - Males (%) - Black or African American
Population - Males (%) - Asian
Population - Males (%) - Hispanic or Latino
Population - Males (%) - American Indian and Alaska Native
Population - Males (%) - Multirace
Population - Males (%) - Other Race
Population - Females (%) - White
Population - Females (%) - Black or African American
Population - Females (%) - Asian
Population - Females (%) - Hispanic or Latino
Population - Females (%) - American Indian and Alaska Native
Population - Females (%) - Multirace
Population - Females (%) - Other Race
Coronavirus confirmed cases (May 11, 2024)
Deaths caused by coronavirus (May 11, 2024)
Coronavirus confirmed cases (per 100k population) (May 11, 2024)
Deaths caused by coronavirus (per 100k population) (May 11, 2024)
Daily increase in number of cases (May 11, 2024)
Weekly increase in number of cases (May 11, 2024)
Cases doubled (in days) (May 11, 2024)
Hospitalized patients (Apr 18, 2022)
Negative test results (Apr 18, 2022)
Total test results (Apr 18, 2022)
COVID Vaccine doses distributed (per 100k population) (Sep 19, 2023)
COVID Vaccine doses administered (per 100k population) (Sep 19, 2023)
COVID Vaccine doses distributed (Sep 19, 2023)
COVID Vaccine doses administered (Sep 19, 2023)
Likely homosexual households (%)
Likely homosexual households (% change since 2000)
Likely homosexual households - Lesbian couples (%)
Likely homosexual households - Lesbian couples (% change since 2000)
Likely homosexual households - Gay men (%)
Likely homosexual households - Gay men (% change since 2000)
Cost of living index
Median gross rent ($)
Median contract rent ($)
Median monthly housing costs ($)
Median house or condo value ($)
Median house or condo value ($ change since 2000)
Mean house or condo value by units in structure - 1, detached ($)
Mean house or condo value by units in structure - 1, attached ($)
Mean house or condo value by units in structure - 2 ($)
Mean house or condo value by units in structure by units in structure - 3 or 4 ($)
Mean house or condo value by units in structure - 5 or more ($)
Mean house or condo value by units in structure - Boat, RV, van, etc. ($)
Mean house or condo value by units in structure - Mobile home ($)
Median house or condo value ($) - White
Median house or condo value ($) - Black or African American
Median house or condo value ($) - Asian
Median house or condo value ($) - Hispanic or Latino
Median house or condo value ($) - American Indian and Alaska Native
Median house or condo value ($) - Multirace
Median house or condo value ($) - Other Race
Median resident age
Resident age diversity
Median resident age - Males
Median resident age - Females
Median resident age - White
Median resident age - Black or African American
Median resident age - Asian
Median resident age - Hispanic or Latino
Median resident age - American Indian and Alaska Native
Median resident age - Multirace
Median resident age - Other Race
Median resident age - Males - White
Median resident age - Males - Black or African American
Median resident age - Males - Asian
Median resident age - Males - Hispanic or Latino
Median resident age - Males - American Indian and Alaska Native
Median resident age - Males - Multirace
Median resident age - Males - Other Race
Median resident age - Females - White
Median resident age - Females - Black or African American
Median resident age - Females - Asian
Median resident age - Females - Hispanic or Latino
Median resident age - Females - American Indian and Alaska Native
Median resident age - Females - Multirace
Median resident age - Females - Other Race
Commute - mean travel time to work (minutes)
Travel time to work - Less than 5 minutes (%)
Travel time to work - Less than 5 minutes (% change since 2000)
Travel time to work - 5 to 9 minutes (%)
Travel time to work - 5 to 9 minutes (% change since 2000)
Travel time to work - 10 to 19 minutes (%)
Travel time to work - 10 to 19 minutes (% change since 2000)
Travel time to work - 20 to 29 minutes (%)
Travel time to work - 20 to 29 minutes (% change since 2000)
Travel time to work - 30 to 39 minutes (%)
Travel time to work - 30 to 39 minutes (% change since 2000)
Travel time to work - 40 to 59 minutes (%)
Travel time to work - 40 to 59 minutes (% change since 2000)
Travel time to work - 60 to 89 minutes (%)
Travel time to work - 60 to 89 minutes (% change since 2000)
Travel time to work - 90 or more minutes (%)
Travel time to work - 90 or more minutes (% change since 2000)
Marital status - Never married (%)
Marital status - Now married (%)
Marital status - Separated (%)
Marital status - Widowed (%)
Marital status - Divorced (%)
Median family income ($)
Median family income (% change since 2000)
Median non-family income ($)
Median non-family income (% change since 2000)
Median per capita income ($)
Median per capita income (% change since 2000)
Median family income ($) - White
Median family income ($) - Black or African American
Median family income ($) - Asian
Median family income ($) - Hispanic or Latino
Median family income ($) - American Indian and Alaska Native
Median family income ($) - Multirace
Median family income ($) - Other Race
Median year house/condo built
Median year apartment built
Year house built - Built 2005 or later (%)
Year house built - Built 2000 to 2004 (%)
Year house built - Built 1990 to 1999 (%)
Year house built - Built 1980 to 1989 (%)
Year house built - Built 1970 to 1979 (%)
Year house built - Built 1960 to 1969 (%)
Year house built - Built 1950 to 1959 (%)
Year house built - Built 1940 to 1949 (%)
Year house built - Built 1939 or earlier (%)
Average household size
Household density (households per square mile)
Average household size - White
Average household size - Black or African American
Average household size - Asian
Average household size - Hispanic or Latino
Average household size - American Indian and Alaska Native
Average household size - Multirace
Average household size - Other Race
Occupied housing units (%)
Vacant housing units (%)
Owner occupied housing units (%)
Renter occupied housing units (%)
Vacancy status - For rent (%)
Vacancy status - For sale only (%)
Vacancy status - Rented or sold, not occupied (%)
Vacancy status - For seasonal, recreational, or occasional use (%)
Vacancy status - For migrant workers (%)
Vacancy status - Other vacant (%)
Residents with income below the poverty level (%)
Residents with income below 50% of the poverty level (%)
Children below poverty level (%)
Poor families by family type - Married-couple family (%)
Poor families by family type - Male, no wife present (%)
Poor families by family type - Female, no husband present (%)
Poverty status for native-born residents (%)
Poverty status for foreign-born residents (%)
Poverty among high school graduates not in families (%)
Poverty among people who did not graduate high school not in families (%)
Residents with income below the poverty level (%) - White
Residents with income below the poverty level (%) - Black or African American
Residents with income below the poverty level (%) - Asian
Residents with income below the poverty level (%) - Hispanic or Latino
Residents with income below the poverty level (%) - American Indian and Alaska Native
Residents with income below the poverty level (%) - Multirace
Residents with income below the poverty level (%) - Other Race
Air pollution - Air Quality Index (AQI)
Air pollution - CO
Air pollution - NO2
Air pollution - SO2
Air pollution - Ozone
Air pollution - PM10
Air pollution - PM25
Air pollution - Pb
Crime - Murders per 100,000 population
Crime - Rapes per 100,000 population
Crime - Robberies per 100,000 population
Crime - Assaults per 100,000 population
Crime - Burglaries per 100,000 population
Crime - Thefts per 100,000 population
Crime - Auto thefts per 100,000 population
Crime - Arson per 100,000 population
Crime - City-data.com crime index
Crime - Violent crime index
Crime - Property crime index
Crime - Murders per 100,000 population (5 year average)
Crime - Rapes per 100,000 population (5 year average)
Crime - Robberies per 100,000 population (5 year average)
Crime - Assaults per 100,000 population (5 year average)
Crime - Burglaries per 100,000 population (5 year average)
Crime - Thefts per 100,000 population (5 year average)
Crime - Auto thefts per 100,000 population (5 year average)
Crime - Arson per 100,000 population (5 year average)
Crime - City-data.com crime index (5 year average)
Crime - Violent crime index (5 year average)
Crime - Property crime index (5 year average)
1996 Presidential Elections Results (%) - Democratic Party (Clinton)
1996 Presidential Elections Results (%) - Republican Party (Dole)
1996 Presidential Elections Results (%) - Other
2000 Presidential Elections Results (%) - Democratic Party (Gore)
2000 Presidential Elections Results (%) - Republican Party (Bush)
2000 Presidential Elections Results (%) - Other
2004 Presidential Elections Results (%) - Democratic Party (Kerry)
2004 Presidential Elections Results (%) - Republican Party (Bush)
2004 Presidential Elections Results (%) - Other
2008 Presidential Elections Results (%) - Democratic Party (Obama)
2008 Presidential Elections Results (%) - Republican Party (McCain)
2008 Presidential Elections Results (%) - Other
2012 Presidential Elections Results (%) - Democratic Party (Obama)
2012 Presidential Elections Results (%) - Republican Party (Romney)
2012 Presidential Elections Results (%) - Other
2016 Presidential Elections Results (%) - Democratic Party (Clinton)
2016 Presidential Elections Results (%) - Republican Party (Trump)
2016 Presidential Elections Results (%) - Other
2020 Presidential Elections Results (%) - Democratic Party (Biden)
2020 Presidential Elections Results (%) - Republican Party (Trump)
2020 Presidential Elections Results (%) - Other
Ancestries Reported - Arab (%)
Ancestries Reported - Czech (%)
Ancestries Reported - Danish (%)
Ancestries Reported - Dutch (%)
Ancestries Reported - English (%)
Ancestries Reported - French (%)
Ancestries Reported - French Canadian (%)
Ancestries Reported - German (%)
Ancestries Reported - Greek (%)
Ancestries Reported - Hungarian (%)
Ancestries Reported - Irish (%)
Ancestries Reported - Italian (%)
Ancestries Reported - Lithuanian (%)
Ancestries Reported - Norwegian (%)
Ancestries Reported - Polish (%)
Ancestries Reported - Portuguese (%)
Ancestries Reported - Russian (%)
Ancestries Reported - Scotch-Irish (%)
Ancestries Reported - Scottish (%)
Ancestries Reported - Slovak (%)
Ancestries Reported - Subsaharan African (%)
Ancestries Reported - Swedish (%)
Ancestries Reported - Swiss (%)
Ancestries Reported - Ukrainian (%)
Ancestries Reported - United States (%)
Ancestries Reported - Welsh (%)
Ancestries Reported - West Indian (%)
Ancestries Reported - Other (%)
Educational Attainment - No schooling completed (%)
Educational Attainment - Less than high school (%)
Educational Attainment - High school or equivalent (%)
Educational Attainment - Less than 1 year of college (%)
Educational Attainment - 1 or more years of college (%)
Educational Attainment - Associate degree (%)
Educational Attainment - Bachelor's degree (%)
Educational Attainment - Master's degree (%)
Educational Attainment - Professional school degree (%)
Educational Attainment - Doctorate degree (%)
School Enrollment - Nursery, preschool (%)
School Enrollment - Kindergarten (%)
School Enrollment - Grade 1 to 4 (%)
School Enrollment - Grade 5 to 8 (%)
School Enrollment - Grade 9 to 12 (%)
School Enrollment - College undergrad (%)
School Enrollment - Graduate or professional (%)
School Enrollment - Not enrolled in school (%)
School enrollment - Public schools (%)
School enrollment - Private schools (%)
School enrollment - Not enrolled (%)
Median number of rooms in houses and condos
Median number of rooms in apartments
Housing units lacking complete plumbing facilities (%)
Housing units lacking complete kitchen facilities (%)
Density of houses
Urban houses (%)
Rural houses (%)
Households with people 60 years and over (%)
Households with people 65 years and over (%)
Households with people 75 years and over (%)
Households with one or more nonrelatives (%)
Households with no nonrelatives (%)
Population in households (%)
Family households (%)
Nonfamily households (%)
Population in families (%)
Family households with own children (%)
Median number of bedrooms in owner occupied houses
Mean number of bedrooms in owner occupied houses
Median number of bedrooms in renter occupied houses
Mean number of bedrooms in renter occupied houses
Median number of vehichles in owner occupied houses
Mean number of vehichles in owner occupied houses
Median number of vehichles in renter occupied houses
Mean number of vehichles in renter occupied houses
Mortgage status - with mortgage (%)
Mortgage status - with second mortgage (%)
Mortgage status - with home equity loan (%)
Mortgage status - with both second mortgage and home equity loan (%)
Mortgage status - without a mortgage (%)
Average family size
Average family size - White
Average family size - Black or African American
Average family size - Asian
Average family size - Hispanic or Latino
Average family size - American Indian and Alaska Native
Average family size - Multirace
Average family size - Other Race
Geographical mobility - Same house 1 year ago (%)
Geographical mobility - Moved within same county (%)
Geographical mobility - Moved from different county within same state (%)
Geographical mobility - Moved from different state (%)
Geographical mobility - Moved from abroad (%)
Place of birth - Born in state of residence (%)
Place of birth - Born in other state (%)
Place of birth - Native, outside of US (%)
Place of birth - Foreign born (%)
Housing units in structures - 1, detached (%)
Housing units in structures - 1, attached (%)
Housing units in structures - 2 (%)
Housing units in structures - 3 or 4 (%)
Housing units in structures - 5 to 9 (%)
Housing units in structures - 10 to 19 (%)
Housing units in structures - 20 to 49 (%)
Housing units in structures - 50 or more (%)
Housing units in structures - Mobile home (%)
Housing units in structures - Boat, RV, van, etc. (%)
House/condo owner moved in on average (years ago)
Renter moved in on average (years ago)
Year householder moved into unit - Moved in 1999 to March 2000 (%)
Year householder moved into unit - Moved in 1995 to 1998 (%)
Year householder moved into unit - Moved in 1990 to 1994 (%)
Year householder moved into unit - Moved in 1980 to 1989 (%)
Year householder moved into unit - Moved in 1970 to 1979 (%)
Year householder moved into unit - Moved in 1969 or earlier (%)
Means of transportation to work - Drove car alone (%)
Means of transportation to work - Carpooled (%)
Means of transportation to work - Public transportation (%)
Means of transportation to work - Bus or trolley bus (%)
Means of transportation to work - Streetcar or trolley car (%)
Means of transportation to work - Subway or elevated (%)
Means of transportation to work - Railroad (%)
Means of transportation to work - Ferryboat (%)
Means of transportation to work - Taxicab (%)
Means of transportation to work - Motorcycle (%)
Means of transportation to work - Bicycle (%)
Means of transportation to work - Walked (%)
Means of transportation to work - Other means (%)
Working at home (%)
Industry diversity
Most Common Industries - Agriculture, forestry, fishing and hunting, and mining (%)
Most Common Industries - Agriculture, forestry, fishing and hunting (%)
Most Common Industries - Mining, quarrying, and oil and gas extraction (%)
Most Common Industries - Construction (%)
Most Common Industries - Manufacturing (%)
Most Common Industries - Wholesale trade (%)
Most Common Industries - Retail trade (%)
Most Common Industries - Transportation and warehousing, and utilities (%)
Most Common Industries - Transportation and warehousing (%)
Most Common Industries - Utilities (%)
Most Common Industries - Information (%)
Most Common Industries - Finance and insurance, and real estate and rental and leasing (%)
Most Common Industries - Finance and insurance (%)
Most Common Industries - Real estate and rental and leasing (%)
Most Common Industries - Professional, scientific, and management, and administrative and waste management services (%)
Most Common Industries - Professional, scientific, and technical services (%)
Most Common Industries - Management of companies and enterprises (%)
Most Common Industries - Administrative and support and waste management services (%)
Most Common Industries - Educational services, and health care and social assistance (%)
Most Common Industries - Educational services (%)
Most Common Industries - Health care and social assistance (%)
Most Common Industries - Arts, entertainment, and recreation, and accommodation and food services (%)
Most Common Industries - Arts, entertainment, and recreation (%)
Most Common Industries - Accommodation and food services (%)
Most Common Industries - Other services, except public administration (%)
Most Common Industries - Public administration (%)
Occupation diversity
Most Common Occupations - Management, business, science, and arts occupations (%)
Most Common Occupations - Management, business, and financial occupations (%)
Most Common Occupations - Management occupations (%)
Most Common Occupations - Business and financial operations occupations (%)
Most Common Occupations - Computer, engineering, and science occupations (%)
Most Common Occupations - Computer and mathematical occupations (%)
Most Common Occupations - Architecture and engineering occupations (%)
Most Common Occupations - Life, physical, and social science occupations (%)
Most Common Occupations - Education, legal, community service, arts, and media occupations (%)
Most Common Occupations - Community and social service occupations (%)
Most Common Occupations - Legal occupations (%)
Most Common Occupations - Education, training, and library occupations (%)
Most Common Occupations - Arts, design, entertainment, sports, and media occupations (%)
Most Common Occupations - Healthcare practitioners and technical occupations (%)
Most Common Occupations - Health diagnosing and treating practitioners and other technical occupations (%)
Most Common Occupations - Health technologists and technicians (%)
Most Common Occupations - Service occupations (%)
Most Common Occupations - Healthcare support occupations (%)
Most Common Occupations - Protective service occupations (%)
Most Common Occupations - Fire fighting and prevention, and other protective service workers including supervisors (%)
Most Common Occupations - Law enforcement workers including supervisors (%)
Most Common Occupations - Food preparation and serving related occupations (%)
Most Common Occupations - Building and grounds cleaning and maintenance occupations (%)
Most Common Occupations - Personal care and service occupations (%)
Most Common Occupations - Sales and office occupations (%)
Most Common Occupations - Sales and related occupations (%)
Most Common Occupations - Office and administrative support occupations (%)
Most Common Occupations - Natural resources, construction, and maintenance occupations (%)
Most Common Occupations - Farming, fishing, and forestry occupations (%)
Most Common Occupations - Construction and extraction occupations (%)
Most Common Occupations - Installation, maintenance, and repair occupations (%)
Most Common Occupations - Production, transportation, and material moving occupations (%)
Most Common Occupations - Production occupations (%)
Most Common Occupations - Transportation occupations (%)
Most Common Occupations - Material moving occupations (%)
People in Group quarters - Institutionalized population (%)
People in Group quarters - Correctional institutions (%)
People in Group quarters - Federal prisons and detention centers (%)
People in Group quarters - Halfway houses (%)
People in Group quarters - Local jails and other confinement facilities (including police lockups) (%)
People in Group quarters - Military disciplinary barracks (%)
People in Group quarters - State prisons (%)
People in Group quarters - Other types of correctional institutions (%)
People in Group quarters - Nursing homes (%)
People in Group quarters - Hospitals/wards, hospices, and schools for the handicapped (%)
People in Group quarters - Hospitals/wards and hospices for chronically ill (%)
People in Group quarters - Hospices or homes for chronically ill (%)
People in Group quarters - Military hospitals or wards for chronically ill (%)
People in Group quarters - Other hospitals or wards for chronically ill (%)
People in Group quarters - Hospitals or wards for drug/alcohol abuse (%)
People in Group quarters - Mental (Psychiatric) hospitals or wards (%)
People in Group quarters - Schools, hospitals, or wards for the mentally retarded (%)
People in Group quarters - Schools, hospitals, or wards for the physically handicapped (%)
People in Group quarters - Institutions for the deaf (%)
People in Group quarters - Institutions for the blind (%)
People in Group quarters - Orthopedic wards and institutions for the physically handicapped (%)
People in Group quarters - Wards in general hospitals for patients who have no usual home elsewhere (%)
People in Group quarters - Wards in military hospitals for patients who have no usual home elsewhere (%)
People in Group quarters - Juvenile institutions (%)
People in Group quarters - Long-term care (%)
People in Group quarters - Homes for abused, dependent, and neglected children (%)
People in Group quarters - Residential treatment centers for emotionally disturbed children (%)
People in Group quarters - Training schools for juvenile delinquents (%)
People in Group quarters - Short-term care, detention or diagnostic centers for delinquent children (%)
People in Group quarters - Type of juvenile institution unknown (%)
People in Group quarters - Noninstitutionalized population (%)
People in Group quarters - College dormitories (includes college quarters off campus) (%)
People in Group quarters - Military quarters (%)
People in Group quarters - On base (%)
People in Group quarters - Barracks, unaccompanied personnel housing (UPH), (Enlisted/Officer), ;and similar group living quarters for military personnel (%)
People in Group quarters - Transient quarters for temporary residents (%)
People in Group quarters - Military ships (%)
People in Group quarters - Group homes (%)
People in Group quarters - Homes or halfway houses for drug/alcohol abuse (%)
People in Group quarters - Homes for the mentally ill (%)
People in Group quarters - Homes for the mentally retarded (%)
People in Group quarters - Homes for the physically handicapped (%)
People in Group quarters - Other group homes (%)
People in Group quarters - Religious group quarters (%)
People in Group quarters - Dormitories (%)
People in Group quarters - Agriculture workers' dormitories on farms (%)
People in Group quarters - Job Corps and vocational training facilities (%)
People in Group quarters - Other workers' dormitories (%)
People in Group quarters - Crews of maritime vessels (%)
People in Group quarters - Other nonhousehold living situations (%)
People in Group quarters - Other noninstitutional group quarters (%)
Residents speaking English at home (%)
Residents speaking English at home - Born in the United States (%)
Residents speaking English at home - Native, born elsewhere (%)
Residents speaking English at home - Foreign born (%)
Residents speaking Spanish at home (%)
Residents speaking Spanish at home - Born in the United States (%)
Residents speaking Spanish at home - Native, born elsewhere (%)
Residents speaking Spanish at home - Foreign born (%)
Residents speaking other language at home (%)
Residents speaking other language at home - Born in the United States (%)
Residents speaking other language at home - Native, born elsewhere (%)
Residents speaking other language at home - Foreign born (%)
Class of Workers - Employee of private company (%)
Class of Workers - Self-employed in own incorporated business (%)
Class of Workers - Private not-for-profit wage and salary workers (%)
Class of Workers - Local government workers (%)
Class of Workers - State government workers (%)
Class of Workers - Federal government workers (%)
Class of Workers - Self-employed workers in own not incorporated business and Unpaid family workers (%)
House heating fuel used in houses and condos - Utility gas (%)
House heating fuel used in houses and condos - Bottled, tank, or LP gas (%)
House heating fuel used in houses and condos - Electricity (%)
House heating fuel used in houses and condos - Fuel oil, kerosene, etc. (%)
House heating fuel used in houses and condos - Coal or coke (%)
House heating fuel used in houses and condos - Wood (%)
House heating fuel used in houses and condos - Solar energy (%)
House heating fuel used in houses and condos - Other fuel (%)
House heating fuel used in houses and condos - No fuel used (%)
House heating fuel used in apartments - Utility gas (%)
House heating fuel used in apartments - Bottled, tank, or LP gas (%)
House heating fuel used in apartments - Electricity (%)
House heating fuel used in apartments - Fuel oil, kerosene, etc. (%)
House heating fuel used in apartments - Coal or coke (%)
House heating fuel used in apartments - Wood (%)
House heating fuel used in apartments - Solar energy (%)
House heating fuel used in apartments - Other fuel (%)
House heating fuel used in apartments - No fuel used (%)
Armed forces status - In Armed Forces (%)
Armed forces status - Civilian (%)
Armed forces status - Civilian - Veteran (%)
Armed forces status - Civilian - Nonveteran (%)
Fatal accidents locations in years 2005-2021
Fatal accidents locations in 2005
Fatal accidents locations in 2006
Fatal accidents locations in 2007
Fatal accidents locations in 2008
Fatal accidents locations in 2009
Fatal accidents locations in 2010
Fatal accidents locations in 2011
Fatal accidents locations in 2012
Fatal accidents locations in 2013
Fatal accidents locations in 2014
Fatal accidents locations in 2015
Fatal accidents locations in 2016
Fatal accidents locations in 2017
Fatal accidents locations in 2018
Fatal accidents locations in 2019
Fatal accidents locations in 2020
Fatal accidents locations in 2021
Alcohol use - People drinking some alcohol every month (%)
Alcohol use - People not drinking at all (%)
Alcohol use - Average days/month drinking alcohol
Alcohol use - Average drinks/week
Alcohol use - Average days/year people drink much
Audiometry - Average condition of hearing (%)
Audiometry - People that can hear a whisper from across a quiet room (%)
Audiometry - People that can hear normal voice from across a quiet room (%)
Audiometry - Ears ringing, roaring, buzzing (%)
Audiometry - Had a job exposure to loud noise (%)
Audiometry - Had off-work exposure to loud noise (%)
Blood Pressure & Cholesterol - Has high blood pressure (%)
Blood Pressure & Cholesterol - Checking blood pressure at home (%)
Blood Pressure & Cholesterol - Frequently checking blood cholesterol (%)
Blood Pressure & Cholesterol - Has high cholesterol level (%)
Consumer Behavior - Money monthly spent on food at supermarket/grocery store
Consumer Behavior - Money monthly spent on food at other stores
Consumer Behavior - Money monthly spent on eating out
Consumer Behavior - Money monthly spent on carryout/delivered foods
Consumer Behavior - Income spent on food at supermarket/grocery store (%)
Consumer Behavior - Income spent on food at other stores (%)
Consumer Behavior - Income spent on eating out (%)
Consumer Behavior - Income spent on carryout/delivered foods (%)
Current Health Status - General health condition (%)
Current Health Status - Blood donors (%)
Current Health Status - Has blood ever tested for HIV virus (%)
Current Health Status - Left-handed people (%)
Dermatology - People using sunscreen (%)
Diabetes - Diabetics (%)
Diabetes - Had a blood test for high blood sugar (%)
Diabetes - People taking insulin (%)
Diet Behavior & Nutrition - Diet health (%)
Diet Behavior & Nutrition - Milk product consumption (# of products/month)
Diet Behavior & Nutrition - Meals not home prepared (#/week)
Diet Behavior & Nutrition - Meals from fast food or pizza place (#/week)
Diet Behavior & Nutrition - Ready-to-eat foods (#/month)
Diet Behavior & Nutrition - Frozen meals/pizza (#/month)
Drug Use - People that ever used marijuana or hashish (%)
Drug Use - Ever used hard drugs (%)
Drug Use - Ever used any form of cocaine (%)
Drug Use - Ever used heroin (%)
Drug Use - Ever used methamphetamine (%)
Health Insurance - People covered by health insurance (%)
Kidney Conditions-Urology - Avg. # of times urinating at night
Medical Conditions - People with asthma (%)
Medical Conditions - People with anemia (%)
Medical Conditions - People with psoriasis (%)
Medical Conditions - People with overweight (%)
Medical Conditions - Elderly people having difficulties in thinking or remembering (%)
Medical Conditions - People who ever received blood transfusion (%)
Medical Conditions - People having trouble seeing even with glass/contacts (%)
Medical Conditions - People with arthritis (%)
Medical Conditions - People with gout (%)
Medical Conditions - People with congestive heart failure (%)
Medical Conditions - People with coronary heart disease (%)
Medical Conditions - People with angina pectoris (%)
Medical Conditions - People who ever had heart attack (%)
Medical Conditions - People who ever had stroke (%)
Medical Conditions - People with emphysema (%)
Medical Conditions - People with thyroid problem (%)
Medical Conditions - People with chronic bronchitis (%)
Medical Conditions - People with any liver condition (%)
Medical Conditions - People who ever had cancer or malignancy (%)
Mental Health - People who have little interest in doing things (%)
Mental Health - People feeling down, depressed, or hopeless (%)
Mental Health - People who have trouble sleeping or sleeping too much (%)
Mental Health - People feeling tired or having little energy (%)
Mental Health - People with poor appetite or overeating (%)
Mental Health - People feeling bad about themself (%)
Mental Health - People who have trouble concentrating on things (%)
Mental Health - People moving or speaking slowly or too fast (%)
Mental Health - People having thoughts they would be better off dead (%)
Oral Health - Average years since last visit a dentist
Oral Health - People embarrassed because of mouth (%)
Oral Health - People with gum disease (%)
Oral Health - General health of teeth and gums (%)
Oral Health - Average days a week using dental floss/device
Oral Health - Average days a week using mouthwash for dental problem
Oral Health - Average number of teeth
Pesticide Use - Households using pesticides to control insects (%)
Pesticide Use - Households using pesticides to kill weeds (%)
Physical Activity - People doing vigorous-intensity work activities (%)
Physical Activity - People doing moderate-intensity work activities (%)
Physical Activity - People walking or bicycling (%)
Physical Activity - People doing vigorous-intensity recreational activities (%)
Physical Activity - People doing moderate-intensity recreational activities (%)
Physical Activity - Average hours a day doing sedentary activities
Physical Activity - Average hours a day watching TV or videos
Physical Activity - Average hours a day using computer
Physical Functioning - People having limitations keeping them from working (%)
Physical Functioning - People limited in amount of work they can do (%)
Physical Functioning - People that need special equipment to walk (%)
Physical Functioning - People experiencing confusion/memory problems (%)
Physical Functioning - People requiring special healthcare equipment (%)
Prescription Medications - Average number of prescription medicines taking
Preventive Aspirin Use - Adults 40+ taking low-dose aspirin (%)
Reproductive Health - Vaginal deliveries (%)
Reproductive Health - Cesarean deliveries (%)
Reproductive Health - Deliveries resulted in a live birth (%)
Reproductive Health - Pregnancies resulted in a delivery (%)
Reproductive Health - Women breastfeeding newborns (%)
Reproductive Health - Women that had a hysterectomy (%)
Reproductive Health - Women that had both ovaries removed (%)
Reproductive Health - Women that have ever taken birth control pills (%)
Reproductive Health - Women taking birth control pills (%)
Reproductive Health - Women that have ever used Depo-Provera or injectables (%)
Reproductive Health - Women that have ever used female hormones (%)
Sexual Behavior - People 18+ that ever had sex (vaginal, anal, or oral) (%)
Sexual Behavior - Males 18+ that ever had vaginal sex with a woman (%)
Sexual Behavior - Males 18+ that ever performed oral sex on a woman (%)
Sexual Behavior - Males 18+ that ever had anal sex with a woman (%)
Sexual Behavior - Males 18+ that ever had any sex with a man (%)
Sexual Behavior - Females 18+ that ever had vaginal sex with a man (%)
Sexual Behavior - Females 18+ that ever performed oral sex on a man (%)
Sexual Behavior - Females 18+ that ever had anal sex with a man (%)
Sexual Behavior - Females 18+ that ever had any kind of sex with a woman (%)
Sexual Behavior - Average age people first had sex
Sexual Behavior - Average number of female sex partners in lifetime (males 18+)
Sexual Behavior - Average number of female vaginal sex partners in lifetime (males 18+)
Sexual Behavior - Average age people first performed oral sex on a woman (18+)
Sexual Behavior - Average number of woman performed oral sex on in lifetime (18+)
Sexual Behavior - Average number of male sex partners in lifetime (males 18+)
Sexual Behavior - Average number of male anal sex partners in lifetime (males 18+)
Sexual Behavior - Average age people first performed oral sex on a man (18+)
Sexual Behavior - Average number of male oral sex partners in lifetime (18+)
Sexual Behavior - People using protection when performing oral sex (%)
Sexual Behavior - Average number of times people have vaginal or anal sex a year
Sexual Behavior - People having sex without condom (%)
Sexual Behavior - Average number of male sex partners in lifetime (females 18+)
Sexual Behavior - Average number of male vaginal sex partners in lifetime (females 18+)
Sexual Behavior - Average number of female sex partners in lifetime (females 18+)
Sexual Behavior - Circumcised males 18+ (%)
Sleep Disorders - Average hours sleeping at night
Sleep Disorders - People that has trouble sleeping (%)
Smoking-Cigarette Use - People smoking cigarettes (%)
Taste & Smell - People 40+ having problems with smell (%)
Taste & Smell - People 40+ having problems with taste (%)
Taste & Smell - People 40+ that ever had wisdom teeth removed (%)
Taste & Smell - People 40+ that ever had tonsils teeth removed (%)
Taste & Smell - People 40+ that ever had a loss of consciousness because of a head injury (%)
Taste & Smell - People 40+ that ever had a broken nose or other serious injury to face or skull (%)
Taste & Smell - People 40+ that ever had two or more sinus infections (%)
Weight - Average height (inches)
Weight - Average weight (pounds)
Weight - Average BMI
Weight - People that are obese (%)
Weight - People that ever were obese (%)
Weight - People trying to lose weight (%)
Urban population: 28,376
Rural population: 547
Estimated median house/condo value in 2022: $240,454
78410:
$240,454Texas:
$275,400
According to our research of Texas and other state lists, there were 48 registered sex offenders living in 78410 zip code as of May 11, 2024 . The ratio of all residents to sex offenders in zip code 78410 is 565 to 1.The ratio of registered sex offenders to all residents in this zip code is lower than the state average.
Median resident age: This zip code:
33.4 yearsTexas median age:
35.6 years
Average household size: This zip code:
2.8 peopleTexas:
2.6 people
Averages for the 2020 tax year for zip code 78410, filed in 2021:
Average Adjusted Gross Income (AGI) in 2020: $63,645 (Individual Income Tax Returns) Here:
$63,645State:
$77,054
Salary/wage: $56,338 (reported on 86.6% of returns )Here:
$56,338State:
$62,766
(% of AGI for various income ranges: 1185.3% for AGIs below $25k , 3539.8% for AGIs $25k-50k , 6407.9% for AGIs $50k-75k , 9530.8% for AGIs $75k-100k , 17065.0% for AGIs $100k-200k , 55044.6% for AGIs over 200k ) Taxable interest for individuals: $1,411 (reported on 22.5% of returns )This zip code:
$1,411Texas:
$2,665
(% of AGI for various income ranges: 10.9% for AGIs below $25k , 17.3% for AGIs $25k-50k , 31.8% for AGIs $50k-75k , 46.7% for AGIs $75k-100k , 78.0% for AGIs $100k-200k , 965.4% for AGIs over 200k ) Ordinary dividends: $5,308 (reported on 9.8% of returns )(% of AGI for various income ranges: 8.3% for AGIs below $25k , 10.0% for AGIs $25k-50k , 36.2% for AGIs $50k-75k , 51.5% for AGIs $75k-100k , 97.1% for AGIs $100k-200k , 2856.9% for AGIs over 200k ) Net capital gain/loss in AGI: +$17,918 (reported on 9.4% of returns )Here:
+$17,918State:
+$39,590
(% of AGI for various income ranges: 5.8% for AGIs below $25k , 14.0% for AGIs $25k-50k , 48.1% for AGIs $50k-75k , 69.3% for AGIs $75k-100k , 203.3% for AGIs $100k-200k , 12821.5% for AGIs over 200k ) Profit/loss from business: +$5,776 (reported on 16.4% of returns )Here:
+$5,776State:
+$10,888
(% of AGI for various income ranges: 77.9% for AGIs below $25k , 34.0% for AGIs $25k-50k , 62.8% for AGIs $50k-75k , 85.5% for AGIs $75k-100k , 175.8% for AGIs $100k-200k , 3436.9% for AGIs over 200k ) Taxable individual retirement arrangement distribution: $20,104 (reported on 5.8% of returns )78410:
$20,104Texas:
$24,740
(% of AGI for various income ranges: 29.2% for AGIs below $25k , 51.6% for AGIs $25k-50k , 143.2% for AGIs $50k-75k , 243.6% for AGIs $75k-100k , 432.6% for AGIs $100k-200k , 1612.3% for AGIs over 200k ) Self-employed (Keogh) retirement plans: $17,200 (reported on 0.2% of returns )78410:
$17,200Texas:
$29,298
(% of AGI for various income ranges: 25.9% for AGIs $100k-200k ) Total itemized deductions: $34,919 (reported on 5.4% of returns )Here:
$34,919State:
$40,428
(% of AGI for various income ranges: 12.4% for AGIs below $25k , 96.3% for AGIs $25k-50k , 241.2% for AGIs $50k-75k , 354.0% for AGIs $75k-100k , 672.6% for AGIs $100k-200k , 3957.7% for AGIs over 200k ) Charity contributions: $11,898 (reported on 3.9% of returns )Here:
$11,898State:
$18,201
(% of AGI for various income ranges: 16.5% for AGIs $25k-50k , 32.1% for AGIs $50k-75k , 50.9% for AGIs $75k-100k , 150.4% for AGIs $100k-200k , 1952.3% for AGIs over 200k ) Taxes paid: $6,655 (reported on 5.1% of returns )(% of AGI for various income ranges: 19.8% for AGIs $25k-50k , 45.4% for AGIs $50k-75k , 67.0% for AGIs $75k-100k , 123.8% for AGIs $100k-200k , 635.4% for AGIs over 200k ) Earned income credit: $2,602 (reported on 20.6% of returns )(% of AGI for various income ranges: 134.1% for AGIs below $25k , 90.9% for AGIs $25k-50k , 1.8% for AGIs $50k-75k ) Percentage of individuals using paid preparers for their 2020 taxes: 92.6%(% for various income ranges: 92.6% for AGIs below $25k , 93.2% for AGIs $25k-50k , 93.3% for AGIs $50k-75k , 91.4% for AGIs $75k-100k , 92.0% for AGIs $100k-200k , 91.7% for AGIs over 200k )
Averages for the 2012 tax year for zip code 78410, filed in 2013:
Average Adjusted Gross Income (AGI) in 2012: $65,776 (Individual Income Tax Returns) Here:
$65,776State:
$65,384
Salary/wage: $55,012 (reported on 88.3% of returns )Here:
$55,012State:
$52,524
(% of AGI for various income ranges: 81.7% for AGIs below $25k , 85.0% for AGIs $25k-50k , 84.6% for AGIs $50k-75k , 85.3% for AGIs $75k-100k , 85.7% for AGIs $100k-200k , 41.7% for AGIs over 200k ) Taxable interest for individuals: $1,444 (reported on 27.4% of returns )This zip code:
$1,444Texas:
$2,372
(% of AGI for various income ranges: 0.9% for AGIs below $25k , 0.6% for AGIs $25k-50k , 0.6% for AGIs $50k-75k , 0.4% for AGIs $75k-100k , 0.5% for AGIs $100k-200k , 0.8% for AGIs over 200k ) Ordinary dividends: $6,504 (reported on 11.7% of returns )(% of AGI for various income ranges: 0.8% for AGIs below $25k , 0.6% for AGIs $25k-50k , 0.6% for AGIs $50k-75k , 0.3% for AGIs $75k-100k , 0.8% for AGIs $100k-200k , 2.7% for AGIs over 200k ) Net capital gain/loss in AGI: +$12,487 (reported on 9.0% of returns )Here:
+$12,487State:
+$35,319
(% of AGI for various income ranges: 0.2% for AGIs below $25k , 0.1% for AGIs $50k-75k , 0.5% for AGIs $75k-100k , 0.8% for AGIs $100k-200k , 5.5% for AGIs over 200k ) Profit/loss from business: +$12,826 (reported on 15.6% of returns )Here:
+$12,826State:
+$13,732
(% of AGI for various income ranges: 7.3% for AGIs below $25k , 2.1% for AGIs $25k-50k , 1.8% for AGIs $50k-75k , 1.7% for AGIs $75k-100k , 2.2% for AGIs $100k-200k , 4.7% for AGIs over 200k ) Taxable individual retirement arrangement distribution: $14,948 (reported on 6.9% of returns )78410:
$14,948Texas:
$19,511
(% of AGI for various income ranges: 1.6% for AGIs below $25k , 1.2% for AGIs $25k-50k , 1.8% for AGIs $50k-75k , 2.2% for AGIs $75k-100k , 1.8% for AGIs $100k-200k , 1.0% for AGIs over 200k ) Self-employment retirement plans: $17,067 (reported on 0.3% of returns )78410:
$17,067Texas:
$23,938
Total itemized deductions: $20,537 (15% of AGI, reported on 25.2% of returns )Here:
$20,537State:
$24,724
Here:
14.7% of AGIState:
15.9% of AGI
(% of AGI for various income ranges: 4.1% for AGIs below $25k , 7.2% for AGIs $25k-50k , 9.8% for AGIs $50k-75k , 9.9% for AGIs $75k-100k , 9.6% for AGIs $100k-200k , 5.0% for AGIs over 200k ) Charity contributions: $4,953 (reported on 20.2% of returns )(% of AGI for various income ranges: 0.4% for AGIs below $25k , 0.8% for AGIs $25k-50k , 1.4% for AGIs $50k-75k , 1.4% for AGIs $75k-100k , 1.9% for AGIs $100k-200k , 1.8% for AGIs over 200k ) Taxes paid: $5,523 (reported on 24.6% of returns )(% of AGI for various income ranges: 0.7% for AGIs below $25k , 1.6% for AGIs $25k-50k , 2.3% for AGIs $50k-75k , 2.5% for AGIs $75k-100k , 2.9% for AGIs $100k-200k , 1.4% for AGIs over 200k ) Earned income credit: $2,498 (reported on 20.6% of returns )(% of AGI for various income ranges: 9.0% for AGIs below $25k , 1.5% for AGIs $25k-50k ) Percentage of individuals using paid preparers for their 2012 taxes: 52.3%(% for various income ranges: 48.2% for AGIs below $25k , 49.4% for AGIs $25k-50k , 54.3% for AGIs $50k-75k , 54.2% for AGIs $75k-100k , 58.1% for AGIs $100k-200k , 81.2% for AGIs over 200k )
Averages for the 2004 tax year for zip code 78410, filed in 2005:
Average Adjusted Gross Income (AGI) in 2004: $44,463 (Individual Income Tax Returns) Here:
$44,463State:
$47,881
Salary/wage: $40,976 (reported on 88.9% of returns )Here:
$40,976State:
$41,947
(% of AGI for various income ranges: 116.7% for AGIs below $10k , 82.9% for AGIs $10k-25k , 85.1% for AGIs $25k-50k , 86.5% for AGIs $50k-75k , 87.7% for AGIs $75k-100k , 71.5% for AGIs over 100k ) Taxable interest for individuals: $1,397 (reported on 33.0% of returns )This zip code:
$1,397Texas:
$2,255
(% of AGI for various income ranges: 2.8% for AGIs below $10k , 1.2% for AGIs $10k-25k , 0.8% for AGIs $25k-50k , 1.1% for AGIs $50k-75k , 0.6% for AGIs $75k-100k , 1.2% for AGIs over 100k ) Taxable dividends: $1,911 (reported on 15.1% of returns )(% of AGI for various income ranges: 1.5% for AGIs below $10k , 0.6% for AGIs $10k-25k , 0.4% for AGIs $25k-50k , 0.4% for AGIs $50k-75k , 0.6% for AGIs $75k-100k , 0.9% for AGIs over 100k ) Net capital gain/loss: +$7,029 (reported on 12.4% of returns )Here:
+$7,029State:
+$16,110
(% of AGI for various income ranges: -1.3% for AGIs below $10k , 0.4% for AGIs $10k-25k , 0.2% for AGIs $25k-50k , 0.7% for AGIs $50k-75k , 0.9% for AGIs $75k-100k , 5.1% for AGIs over 100k ) Profit/loss from business: +$8,574 (reported on 15.5% of returns )Here:
+$8,574State:
+$11,013
(% of AGI for various income ranges: 7.3% for AGIs below $10k , 4.5% for AGIs $10k-25k , 1.9% for AGIs $25k-50k , 1.7% for AGIs $50k-75k , 0.9% for AGIs $75k-100k , 5.0% for AGIs over 100k ) IRA payment deduction: $3,096 (reported on 2.3% of returns )(% of AGI for various income ranges: 0.2% for AGIs $10k-25k , 0.2% for AGIs $25k-50k , 0.2% for AGIs $50k-75k , 0.1% for AGIs $75k-100k , 0.2% for AGIs over 100k ) Self-employed pension: $8,907 (reported on 0.4% of returns )Total itemized deductions: $16,043 (20% of AGI, reported on 24.5% of returns )Here:
$16,043State:
$19,631
Here:
19.5% of AGIState:
18.9% of AGI
(% of AGI for various income ranges: 4.9% for AGIs below $10k , 5.0% for AGIs $10k-25k , 8.1% for AGIs $25k-50k , 10.2% for AGIs $50k-75k , 10.3% for AGIs $75k-100k , 8.8% for AGIs over 100k ) Charity contributions deductions: $3,127 (4% of AGI, reported on 20.8% of returns )Here:
3.6% of AGIState:
4.2% of AGI
(% of AGI for various income ranges: 0.3% for AGIs below $10k , 0.5% for AGIs $10k-25k , 0.9% for AGIs $25k-50k , 1.4% for AGIs $50k-75k , 1.8% for AGIs $75k-100k , 2.0% for AGIs over 100k ) Total tax: $6,819 (reported on 72.3% of returns )(% of AGI for various income ranges: 2.9% for AGIs below $10k , 3.5% for AGIs $10k-25k , 6.4% for AGIs $25k-50k , 8.5% for AGIs $50k-75k , 10.4% for AGIs $75k-100k , 18.6% for AGIs over 100k ) Earned income credit: $1,999 (reported on 19.9% of returns )Percentage of individuals using paid preparers for their 2004 taxes: 54.1%(% for various income ranges: 47.6% for AGIs below $10k , 56.9% for AGIs $10k-25k , 55.2% for AGIs $25k-50k , 55.3% for AGIs $50k-75k , 51.9% for AGIs $75k-100k , 59.8% for AGIs over 100k )
Estimated median household income in 2022: This zip code:
$81,619Texas:
$72,284
Nearest zip codes: 78409 ,
78406 ,
78370 ,
78352 ,
78380 ,
78408 .
Corpus Christi Zip Code Map
Percentage of family households: This zip code:
55.9%Texas:
50.5%
Percentage of households with unmarried partners: This zip code:
7.0%Texas:
48.7%
No gay or lesbian households reported
Household received Food Stamps/SNAP in the past 12 months: 1,351Household did not receive Food Stamps/SNAP in the past 12 months: 8,852
Women who had a birth in the past 12 months: 276 (158 now married , 116 unmarried) Women who did not have a birth in the past 12 months: 6,670 (3,038 now married , 3,628 unmarried)
Housing units in zip code 78410 with a mortgage: 4,452 (108
second mortgage , 75
both second mortgage and home equity loan )
Median monthly owner costs for units with a mortgage: $1,774
Median monthly owner costs for units without a mortgage: $716
Residents with income below the poverty level in 2022:
This zip code:
11.8%Whole state:
14.0%
Residents with income below 50% of the poverty level in 2022:
This zip code:
7.0%Whole state:
7.4%
Median number of rooms in houses and condos: Median number of rooms in apartments: Notable locations in this zip code not listed on our city pages
Click to draw/clear zip code borders Notable locations in zip code 78410: (A) , Lon C Hill Powerplant (B) , River Hills Country Club (C) , Corpus Christi Fire Department Station 2 (D) , Annaville Volunteer Fire Department Central Station (E) , Mercury Emergency Medical Service (F) . Display/hide their locations on the map
Shopping Centers: (1) , Stonewall Mall Shopping Center (2) . Display/hide their locations on the map
Churches in zip code 78410 include: (A) , Bring Your Bible Baptist Church (B) , Saint Marys Catholic Church (C) , Zion Memorial Baptist Church (D) , Primitive Baptist Church (E) , Resurrection Lutheran Church (F) , Saint Andrews Episcopal Church (G) , Arlington Heights Community Church (H) , Annaville Seventh Day Adventist Church (I) . Display/hide their locations on the map
Reservoir: (A) . Display/hide its location on the map
Parks in zip code 78410 include: (1) , Jackson Woods Park (2) , West Guth Park (3) , Paterson Park (4) , Oil Belt Park (5) , Wind Rock Park (6) , Labonte Park (7) , Bear Stadium (8) , Jackie Eden Field (9) . Display/hide their locations on the map
Tourist attraction (not listed on the city page) : (1) . Display/hide its approximate location on the map
Year house built (houses)
62 2020 or later1,789 2010 to 20191,503 2000 to 20091,383 1990 to 19992,688 1980 to 19891,545 1970 to 1979968 1960 to 1969627 1950 to 195932 1940 to 194935 1939 or earlier
Zip code 78410 household income distribution in 2022 329 Less than $10,000316 $10,000 to $14,999168 $15,000 to $19,999447 $20,000 to $24,999379 $25,000 to $29,999226 $30,000 to $34,999298 $35,000 to $39,999195 $40,000 to $44,999272 $45,000 to $49,999768 $50,000 to $59,9991,214 $60,000 to $74,9991,622 $75,000 to $99,9991,191 $100,000 to $124,999759 $125,000 to $149,9991,022 $150,000 to $199,999955 $200,000 or moreEstimate of home value of owner-occupied houses/condos in 2022 in zip code 78410 50 Less than $10,0004 $10,000 to $14,99965 $15,000 to $19,9999 $20,000 to $24,99913 $30,000 to $34,99946 $50,000 to $59,999138 $60,000 to $69,999100 $70,000 to $79,99974 $80,000 to $89,99928 $90,000 to $99,999289 $100,000 to $124,999424 $125,000 to $149,999782 $150,000 to $174,999610 $175,000 to $199,9991,445 $200,000 to $249,9991,057 $250,000 to $299,999651 $300,000 to $399,999335 $400,000 to $499,999196 $500,000 to $749,99910 $750,000 to $999,99947 $1,000,000 to $1,499,999Rent paid by renters in 2022 in zip code 78410 125 $150 to $19925 $200 to $24936 $250 to $29971 $300 to $34987 $350 to $39976 $400 to $449121 $450 to $49954 $500 to $54937 $550 to $59960 $600 to $64936 $650 to $69975 $700 to $749216 $750 to $799174 $800 to $899500 $900 to $999592 $1,000 to $1,249338 $1,250 to $1,499257 $1,500 to $1,999174 $2,000 to $2,49967 No cash rent
Median gross rent in 2022: $1,198.
Median price asked for vacant for-sale houses and condos in 2022: $1,394,104.
Estimated median house (or condo) value in 2022 for: White Non-Hispanic householders: $246,937Black or African American householders: $263,438American Indian or Alaska Native householders: $323,257Asian householders: $250,473Some other race householders: $218,648Two or more races householders: $244,285Hispanic or Latino householders: $222,479Estimated median house or condo value in 2022: $240,454
78410:
$240,454Texas:
$275,400
Lower value quartile - upper value quartile: $180,442 - $303,343
Mean price in 2022: Detached houses: $283,757Here:
$283,757State:
$369,058
Townhouses or other attached units: $304,388Here:
$304,388State:
$327,631
In 5-or-more-unit structures: $597,676Here:
$597,676State:
$413,944
Mobile homes: $15,354Here:
$15,354State:
$124,413
Housing units in structures:
One, detached: 7,616One, attached: 136Two: 2343 or 4: 5785 to 9: 82310 to 19: 64720 to 49: 15650 or more: 151Mobile homes: 576Unemployment : 3.9%
Means of transportation to work in zip code 78410 84.6% 11,337 Drove a car alone6.6% 882 Carpooled0.2% 32 Motorcycle0.7% 90 Walked0.8% 104 Other means3.8% 504 Worked at homeTravel time to work (commute) in zip code 78410 202 Less than 5 minutes971 5 to 9 minutes1,948 10 to 14 minutes3,972 15 to 19 minutes2,453 20 to 24 minutes659 25 to 29 minutes1,110 30 to 34 minutes165 35 to 39 minutes211 40 to 44 minutes453 45 to 59 minutes254 60 to 89 minutes100 90 or more minutes
Percentage of zip code residents living and working in this county: 88.2%
Household type by relationship:
Households: 28,924
Male householders: 4,777 (1,081 living alone ), Female householders: 5,427 (1,247 living alone )4,998 spouses (4,882 opposite-sex spouses ), 766 unmarried partners , (726 opposite-sex unmarried partners ), 8,801 children (8,201 natural , 89 adopted , 511 stepchildren ), 1,145 grandchildren , 834 brothers or sisters , 568 parents , 0 foster children , 1,085 other relatives , 409 non-relatives In group quarters: 93 (-1 institutionalized population )
Size of family households: 2,693 2-persons , 1,689 3-persons , 1,639 4-persons , 702 5-persons , 264 6-persons , 347 7-or-more-persons
Size of nonfamily households: 2,328 1-person , 487 2-persons , 26 3-persons
4,073 married couples with children. single-parent households (442 men , 1,811 women ).
70.0% of residents of 78410 zip code speak English at home. of residents speak Spanish at home (88% very well, 9% well, 2% not well ).of residents speak other Indo-European language at home (58% very well, 42% well ).of residents speak other language at home (100% well ).
Foreign born population: 1,702 (5.9%)
(32.2%
of them are naturalized citizens )
This zip code:
5.9%Whole state:
17.2%
81% Honduras 3% Costa Rica 2% Nicaragua 2% Guatemala 1% Barbados 1% Chile 1% North Macedonia (Macedonia) 9% German 5% Irish 3% English 3% American 0% Polish 0% Czech 0% Italian
Year of entry for the foreign-born population
931 2010 or later 454 2000 to 2009 521 1990 to 1999 532 Before 1990
There are
82 Medical Specialists in Zip Code 78410 .
Facilities with environmental interests located in this zip code:
ANNAVILLE EL (3901 CLIFF CRENSHAW ST in CORPUS CHRISTI, TX)
(National Center for Education Statistics) - STATE ID-178903101 Organizations: CALALLEN ISD (SCHOOL DISTRICT)
AEP TEXAS CENTRAL COMPANY (3701 CALLICOATTE RD in CORPUS CHRISTI, TX)
(Resource Conservation and Recovery Act (tracking hazardous waste)) Business NAICS classification: ELECTRIC POWER DISTRIBUTION.Alternative names: CENTRAL GARAGE
AMBASSADOR PETROCHEMICAL SVS (6364 HOPKINS RD in CORPUS CHRISTI, TX)
(Resource Conservation and Recovery Act (tracking hazardous waste)) Alternative names: AMBASSADOR PETROCHEMICAL SERVICES
Housing units lacking complete plumbing facilities: 1.2%
Housing units lacking complete kitchen facilities: 1.4%
84.6% Electricity 14.4% Utility gas 0.6% No fuel used
Population in 1990: 20,860. Population change in the 1990s: +2,773 (+13.3%).
Place of birth for U.S.-born residents:
This state: 22,247Northeast: 254Midwest: 1,090South: 1,286West: 1,462
51% of the 78410 zip code residents lived in the same house 5 years ago.
Out of people who lived in different houses, 67% lived in this county.
Out of people who lived in different counties, 50% lived in Texas.
88% of the 78410 zip code residents lived in the same house 1 year ago.
Out of people who lived in different houses, 68% moved from this county.
Out of people who lived in different houses, 18% moved from different county within same state.
Out of people who lived in different houses, 9% moved from different state.
Out of people who lived in different houses, 2% moved from abroad.
Private vs. public school enrollment:
Students in private schools in grades 1 to 8 (elementary and middle school): 237
Students in private schools in grades 9 to 12 (high school): 107
Students in private undergraduate colleges: 59
Occupation by median earnings in the past 12 months ($)
269,524 Legal occupations 119,762 Computer and mathematical occupations 88,890 Architecture and engineering occupations 87,439 Life, physical, and social science occupations 81,805 Management occupations 76,673 Production occupations
Companies with federal contracts located in this zip code (CORPUS CHRISTI, TX):
GEMINI LABORATORIES, INC (3425 TWIN RIVER BLVD; small business) in 10 contracts from 2000 to 2005
Contracts for Chemical/Biological Studies and Analyses, Environmental Studies and Assessments, Laboratory Testing Services, Medical and Surgical Instruments, Equipment, and Supplies by ArmySigned by year: 2000: $27,900; 2001: $0; 2002: $48,655; 2003: $39,625; 2004: $39,000; 2005: $31,000; 2006: $0.
Biggest contracts: with Army for Chemical/Biological Studies and Analyses. Signed on 2002-08-27. Completion date: 2003-09-30.
, same as above. Signed on 2003-07-28. Completion date: 2004-09-30.
, same as above. Signed on 2005-08-17. Completion date: 2006-09-30.
, same as above. Signed on 2004-08-16. Completion date: 2004-09-30.
R E RABALAIS CONTRACTORS LTD (11200 UP RIVER RD) in 2 contracts in 2005
$99,000 with Army for Miscellaneous Communication Equipment. Signed on 2005-06-28. Completion date: 2005-08-15.
with Navy for Maintenance, Repair or Alteration of Real Property -- Other Utilities. Signed on 2005-06-14. Completion date: 2005-07-14.
HORIZON CLEANING & RESTORATION (14601 SPRING CREEK CIRCLE; small business)
$26,653 with Army for Hazardous Substance Removal, Cleanup, and Disposal Services and Operational Support. Signed on 2003-03-20. Completion date: 2003-04-04.
E J J MICKLEY ENTERPRISES (4457 CHURCH ST; small business) in 2 contracts in 2005
$6,403 with Army for Signs, Advertising Displays, and Identification Plates. Taking place in NJ. Signed on 2005-08-23. Completion date: 2005-08-19.
, same as above. Signed on 2005-08-25. Completion date: 2005-08-19.
MERCURY EMS L L C (4366 STARLITE LN; small business)
$5,426 with Navy for Lease or Rental of Equipment -- Fire Fighting, Rescue, and Safety Equipment; and Environmental Protection Equipment and Materials. Signed on 2005-04-12. Completion date: 2005-04-10.
ANZALDUA CONSTRUCTION (3221 FAIR OAKS DRIVE; small business)
$3,625 with Navy for Maintenance, Repair or Alteration of Real Property -- Office Buildings. Signed on 2000-03-23. Completion date: 2000-04-03.
Top industries in this zip code by the number of employees in 2005:
Accommodation and Food Services: Limited-Service Restaurants (50-99 employees: 1 establishment, 20-49 employees: 9 establishments, 10-19 employees: 10 establishments, 5-9 employees: 1 establishment, 1-4 employees: 2 establishments)Construction: Electrical Contractors (250-499: 1, 10-19: 1, 5-9: 2, 1-4: 3)Health Care and Social Assistance: General Medical and Surgical Hospitals (250-499: 1)Accommodation and Food Services: Full-Service Restaurants (20-49: 3, 10-19: 5, 5-9: 7, 1-4: 7)Other Services (except Public Administration): Religious Organizations (20-49: 3, 10-19: 3, 5-9: 5, 1-4: 6)Health Care and Social Assistance: All Other Miscellaneous Ambulatory Health Care Services (100-249: 1)Health Care and Social Assistance: Offices of Physicians (except Mental Health Specialists) (10-19: 2, 5-9: 10, 1-4: 19)
People in group quarters in 2010:
111 people in nursing facilities/skilled-nursing facilities
39 people in other noninstitutional facilities
5 people in group homes intended for adults
People in group quarters in 2000:
141 people in nursing homes
47 people in homes for the mentally retarded
22 people in religious group quarters
13 people in hospitals/wards and hospices for chronically ill
13 people in hospices or homes for chronically ill
6 people in other nonhousehold living situations
Fatal accident statistics in 2014:
Fatal accident count: 2Vehicles involved in fatal accidents: 2Fatal accidents caused by drunken drivers: 1Fatalities: 2Persons involved in fatal accidents: 3Pedestrians involved in fatal accidents: 0
Fatal accident statistics in 2013:
Fatal accident count: 2Vehicles involved in fatal accidents: 3Fatal accidents caused by drunken drivers: 0Fatalities: 2Persons involved in fatal accidents: 17Pedestrians involved in fatal accidents: 0
Home Mortgage Disclosure Act Aggregated Statistics For Year 2009(Based on 7 full and 4 partial tracts) A) FHA, FSA/RHS & VA B) Conventional C) Refinancings D) Home Improvement Loans E) Loans on Dwellings For 5+ Families F) Non-occupant Loans on G) Loans On Manufactured Number Average Value Number Average Value Number Average Value Number Average Value Number Average Value Number Average Value Number Average Value
LOANS ORIGINATED 255 $130,253 126 $129,824 320 $114,814 51 $39,578 4 $1,419,680 51 $101,623 2 $166,485 APPLICATIONS APPROVED, NOT ACCEPTED 26 $135,845 9 $139,118 31 $103,869 10 $72,793 0 $0 2 $103,180 0 $0 APPLICATIONS DENIED 51 $130,688 65 $94,023 181 $104,188 67 $35,386 0 $0 20 $81,213 0 $0 APPLICATIONS WITHDRAWN 30 $116,432 37 $113,290 113 $108,223 17 $41,575 0 $0 2 $89,720 1 $54,250 FILES CLOSED FOR INCOMPLETENESS 5 $135,712 0 $0 21 $134,884 2 $89,720 0 $0 1 $62,000 0 $0
Aggregated Statistics For Year 2008(Based on 7 full and 4 partial tracts) A) FHA, FSA/RHS & VA B) Conventional C) Refinancings D) Home Improvement Loans E) Loans on Dwellings For 5+ Families F) Non-occupant Loans on G) Loans On Manufactured Number Average Value Number Average Value Number Average Value Number Average Value Number Average Value Number Average Value Number Average Value
LOANS ORIGINATED 225 $130,910 202 $123,054 243 $100,122 78 $36,995 2 $1,256,095 56 $75,320 2 $32,875 APPLICATIONS APPROVED, NOT ACCEPTED 16 $123,436 34 $85,561 41 $115,527 19 $44,435 3 $190,223 7 $59,844 8 $56,099 APPLICATIONS DENIED 39 $116,998 98 $96,599 269 $100,452 164 $41,122 2 $837,395 20 $88,008 17 $53,944 APPLICATIONS WITHDRAWN 21 $125,276 38 $131,264 92 $105,106 18 $67,367 0 $0 10 $70,616 0 $0 FILES CLOSED FOR INCOMPLETENESS 10 $128,047 6 $106,005 17 $69,682 3 $112,510 0 $0 2 $70,000 0 $0
Aggregated Statistics For Year 2007(Based on 7 full and 4 partial tracts) A) FHA, FSA/RHS & VA B) Conventional C) Refinancings D) Home Improvement Loans F) Non-occupant Loans on G) Loans On Manufactured Number Average Value Number Average Value Number Average Value Number Average Value Number Average Value Number Average Value
LOANS ORIGINATED 146 $124,441 486 $107,677 265 $102,098 96 $38,905 86 $74,213 8 $70,858 APPLICATIONS APPROVED, NOT ACCEPTED 14 $100,341 63 $102,234 44 $99,570 24 $45,438 13 $65,624 8 $44,672 APPLICATIONS DENIED 25 $110,996 135 $90,867 363 $103,043 137 $49,983 28 $115,433 29 $67,397 APPLICATIONS WITHDRAWN 19 $116,681 78 $107,987 194 $97,644 21 $56,229 9 $53,730 0 $0 FILES CLOSED FOR INCOMPLETENESS 5 $91,262 18 $112,895 41 $118,435 6 $68,835 1 $22,770 0 $0
Aggregated Statistics For Year 2006(Based on 7 full and 4 partial tracts) A) FHA, FSA/RHS & VA B) Conventional C) Refinancings D) Home Improvement Loans E) Loans on Dwellings For 5+ Families F) Non-occupant Loans on G) Loans On Manufactured Number Average Value Number Average Value Number Average Value Number Average Value Number Average Value Number Average Value Number Average Value
LOANS ORIGINATED 144 $116,512 794 $86,497 293 $86,927 93 $38,692 2 $3,037,045 91 $68,794 4 $39,985 APPLICATIONS APPROVED, NOT ACCEPTED 11 $101,036 107 $78,586 64 $86,663 10 $20,825 0 $0 23 $68,656 12 $46,083 APPLICATIONS DENIED 20 $97,971 177 $78,121 282 $86,073 115 $36,280 2 $877,270 34 $75,004 32 $52,457 APPLICATIONS WITHDRAWN 12 $91,277 96 $95,535 248 $91,534 22 $68,071 0 $0 9 $77,286 1 $18,750 FILES CLOSED FOR INCOMPLETENESS 0 $0 28 $101,711 59 $89,676 2 $29,975 0 $0 1 $38,180 0 $0
Aggregated Statistics For Year 2005(Based on 7 full and 4 partial tracts) A) FHA, FSA/RHS & VA B) Conventional C) Refinancings D) Home Improvement Loans E) Loans on Dwellings For 5+ Families F) Non-occupant Loans on G) Loans On Manufactured Number Average Value Number Average Value Number Average Value Number Average Value Number Average Value Number Average Value Number Average Value
LOANS ORIGINATED 122 $105,087 694 $80,306 325 $86,396 107 $56,862 5 $458,586 92 $77,621 9 $59,677 APPLICATIONS APPROVED, NOT ACCEPTED 16 $98,764 107 $69,384 46 $72,280 16 $64,641 0 $0 3 $68,833 22 $34,362 APPLICATIONS DENIED 14 $88,176 192 $67,231 400 $79,242 111 $34,287 0 $0 41 $71,740 30 $43,348 APPLICATIONS WITHDRAWN 12 $83,518 82 $86,440 229 $93,309 61 $168,625 0 $0 10 $61,030 1 $40,860 FILES CLOSED FOR INCOMPLETENESS 4 $99,192 33 $82,650 94 $100,219 4 $69,770 0 $0 8 $79,325 0 $0
Aggregated Statistics For Year 2004(Based on 7 full and 4 partial tracts) A) FHA, FSA/RHS & VA B) Conventional C) Refinancings D) Home Improvement Loans E) Loans on Dwellings For 5+ Families F) Non-occupant Loans on G) Loans On Manufactured Number Average Value Number Average Value Number Average Value Number Average Value Number Average Value Number Average Value Number Average Value
LOANS ORIGINATED 189 $96,949 489 $87,558 498 $77,446 85 $45,779 0 $0 72 $64,497 11 $42,057 APPLICATIONS APPROVED, NOT ACCEPTED 3 $93,450 75 $77,991 93 $73,435 11 $47,776 1 $815,000 11 $82,731 11 $66,464 APPLICATIONS DENIED 21 $90,451 162 $60,811 495 $77,741 123 $31,127 0 $0 38 $86,354 56 $50,909 APPLICATIONS WITHDRAWN 33 $96,502 68 $84,495 303 $83,515 23 $52,728 0 $0 21 $69,313 5 $39,280 FILES CLOSED FOR INCOMPLETENESS 3 $86,880 21 $67,965 160 $85,661 4 $49,880 0 $0 7 $116,534 0 $0
Aggregated Statistics For Year 2003(Based on 7 full and 4 partial tracts) A) FHA, FSA/RHS & VA B) Conventional C) Refinancings D) Home Improvement Loans E) Loans on Dwellings For 5+ Families F) Non-occupant Loans on Number Average Value Number Average Value Number Average Value Number Average Value Number Average Value Number Average Value
LOANS ORIGINATED 152 $92,464 406 $84,760 932 $75,869 77 $21,775 5 $596,278 83 $59,452 APPLICATIONS APPROVED, NOT ACCEPTED 9 $84,311 81 $84,299 91 $76,634 13 $47,365 0 $0 11 $70,654 APPLICATIONS DENIED 4 $71,142 106 $71,923 336 $73,483 91 $22,540 0 $0 22 $54,088 APPLICATIONS WITHDRAWN 15 $91,131 71 $73,963 373 $83,073 3 $21,997 0 $0 8 $94,909 FILES CLOSED FOR INCOMPLETENESS 6 $67,680 22 $85,029 34 $93,349 0 $0 0 $0 4 $62,255
Aggregated Statistics For Year 2002(Based on 7 full and 4 partial tracts) A) FHA, FSA/RHS & VA B) Conventional C) Refinancings D) Home Improvement Loans E) Loans on Dwellings For 5+ Families F) Non-occupant Loans on Number Average Value Number Average Value Number Average Value Number Average Value Number Average Value Number Average Value
LOANS ORIGINATED 172 $84,169 303 $82,733 498 $74,249 81 $24,312 2 $837,395 53 $55,846 APPLICATIONS APPROVED, NOT ACCEPTED 6 $76,057 68 $73,035 50 $66,636 9 $46,112 0 $0 6 $62,767 APPLICATIONS DENIED 18 $100,300 118 $53,446 198 $56,602 41 $20,706 0 $0 8 $40,418 APPLICATIONS WITHDRAWN 19 $78,329 42 $72,874 211 $67,673 5 $11,306 0 $0 5 $54,998 FILES CLOSED FOR INCOMPLETENESS 4 $91,852 9 $82,097 67 $75,031 5 $25,576 0 $0 8 $85,945
Aggregated Statistics For Year 2001(Based on 7 full and 4 partial tracts) A) FHA, FSA/RHS & VA B) Conventional C) Refinancings D) Home Improvement Loans F) Non-occupant Loans on Number Average Value Number Average Value Number Average Value Number Average Value Number Average Value
LOANS ORIGINATED 232 $81,145 309 $88,829 318 $72,585 85 $18,293 55 $72,410 APPLICATIONS APPROVED, NOT ACCEPTED 24 $78,214 56 $62,145 44 $67,005 12 $28,448 8 $57,881 APPLICATIONS DENIED 19 $78,193 105 $52,416 191 $56,469 65 $18,027 15 $63,448 APPLICATIONS WITHDRAWN 23 $81,900 52 $88,278 133 $62,793 12 $16,407 10 $60,791 FILES CLOSED FOR INCOMPLETENESS 2 $111,035 15 $72,571 37 $72,314 1 $34,000 4 $84,238
Aggregated Statistics For Year 2000(Based on 7 full and 4 partial tracts) A) FHA, FSA/RHS & VA B) Conventional C) Refinancings D) Home Improvement Loans E) Loans on Dwellings For 5+ Families F) Non-occupant Loans on Number Average Value Number Average Value Number Average Value Number Average Value Number Average Value Number Average Value
LOANS ORIGINATED 213 $79,387 290 $75,687 122 $71,063 80 $21,887 1 $850,000 43 $37,887 APPLICATIONS APPROVED, NOT ACCEPTED 16 $51,808 56 $62,633 36 $71,520 21 $18,890 0 $0 4 $32,548 APPLICATIONS DENIED 22 $59,477 162 $53,260 118 $60,696 43 $13,234 0 $0 6 $43,963 APPLICATIONS WITHDRAWN 15 $87,482 24 $72,003 80 $66,134 3 $15,310 0 $0 5 $47,890 FILES CLOSED FOR INCOMPLETENESS 1 $61,000 10 $89,110 67 $63,386 0 $0 0 $0 0 $0
Aggregated Statistics For Year 1999(Based on 4 full and 2 partial tracts) A) FHA, FSA/RHS & VA B) Conventional C) Refinancings D) Home Improvement Loans F) Non-occupant Loans on Number Average Value Number Average Value Number Average Value Number Average Value Number Average Value
LOANS ORIGINATED 126 $74,372 132 $74,013 146 $64,661 58 $14,049 32 $38,489 APPLICATIONS APPROVED, NOT ACCEPTED 3 $77,710 41 $50,729 23 $51,303 13 $14,252 6 $39,865 APPLICATIONS DENIED 6 $65,788 179 $44,765 68 $64,616 42 $14,310 10 $36,684 APPLICATIONS WITHDRAWN 15 $71,455 22 $74,662 88 $69,041 4 $17,728 1 $44,000 FILES CLOSED FOR INCOMPLETENESS 5 $85,944 11 $93,333 38 $55,545 1 $9,630 2 $45,105
Private Mortgage Insurance Companies Aggregated Statistics For Year 2009(Based on 7 full and 4 partial tracts) A) Conventional B) Refinancings C) Non-occupant Loans on Number Average Value Number Average Value Number Average Value
LOANS ORIGINATED 16 $152,849 9 $154,789 0 $0 APPLICATIONS APPROVED, NOT ACCEPTED 7 $156,421 5 $166,504 0 $0 APPLICATIONS DENIED 1 $101,810 2 $91,715 1 $101,810 APPLICATIONS WITHDRAWN 1 $178,170 2 $142,870 0 $0 FILES CLOSED FOR INCOMPLETENESS 1 $142,670 0 $0 0 $0
Aggregated Statistics For Year 2008(Based on 7 full and 4 partial tracts) A) Conventional B) Refinancings C) Non-occupant Loans on Number Average Value Number Average Value Number Average Value
LOANS ORIGINATED 100 $121,518 8 $143,929 13 $78,782 APPLICATIONS APPROVED, NOT ACCEPTED 20 $107,451 3 $173,907 4 $100,115 APPLICATIONS DENIED 4 $110,785 0 $0 2 $108,660 APPLICATIONS WITHDRAWN 5 $139,774 3 $173,907 0 $0 FILES CLOSED FOR INCOMPLETENESS 1 $95,000 0 $0 0 $0
Aggregated Statistics For Year 2007(Based on 7 full and 4 partial tracts) A) Conventional B) Refinancings C) Non-occupant Loans on Number Average Value Number Average Value Number Average Value
LOANS ORIGINATED 195 $117,892 17 $178,221 18 $87,416 APPLICATIONS APPROVED, NOT ACCEPTED 22 $112,735 0 $0 6 $60,953 APPLICATIONS DENIED 3 $111,513 0 $0 0 $0 APPLICATIONS WITHDRAWN 15 $109,775 0 $0 2 $122,470 FILES CLOSED FOR INCOMPLETENESS 0 $0 0 $0 0 $0
Aggregated Statistics For Year 2006(Based on 7 full and 4 partial tracts) A) Conventional B) Refinancings C) Non-occupant Loans on Number Average Value Number Average Value Number Average Value
LOANS ORIGINATED 141 $119,121 11 $179,084 9 $84,446 APPLICATIONS APPROVED, NOT ACCEPTED 22 $105,979 2 $196,630 1 $93,100 APPLICATIONS DENIED 4 $160,192 0 $0 0 $0 APPLICATIONS WITHDRAWN 7 $138,339 0 $0 0 $0 FILES CLOSED FOR INCOMPLETENESS 0 $0 0 $0 0 $0
Aggregated Statistics For Year 2005(Based on 7 full and 4 partial tracts) A) Conventional B) Refinancings C) Non-occupant Loans on Number Average Value Number Average Value Number Average Value
LOANS ORIGINATED 137 $108,616 17 $131,088 20 $78,922 APPLICATIONS APPROVED, NOT ACCEPTED 22 $88,626 3 $68,743 6 $48,295 APPLICATIONS DENIED 5 $106,386 0 $0 2 $69,785 APPLICATIONS WITHDRAWN 3 $149,717 1 $150,040 0 $0 FILES CLOSED FOR INCOMPLETENESS 1 $83,000 0 $0 0 $0
Aggregated Statistics For Year 2004(Based on 7 full and 4 partial tracts) A) Conventional B) Refinancings C) Non-occupant Loans on Number Average Value Number Average Value Number Average Value
LOANS ORIGINATED 111 $107,921 24 $115,702 11 $72,829 APPLICATIONS APPROVED, NOT ACCEPTED 9 $111,776 11 $109,000 0 $0 APPLICATIONS DENIED 3 $194,747 0 $0 2 $105,250 APPLICATIONS WITHDRAWN 8 $93,440 1 $224,380 3 $72,477 FILES CLOSED FOR INCOMPLETENESS 0 $0 1 $179,510 0 $0
Aggregated Statistics For Year 2003(Based on 7 full and 4 partial tracts) A) Conventional B) Refinancings C) Non-occupant Loans on Number Average Value Number Average Value Number Average Value
LOANS ORIGINATED 162 $98,561 79 $100,706 30 $68,652 APPLICATIONS APPROVED, NOT ACCEPTED 17 $92,922 7 $81,684 0 $0 APPLICATIONS DENIED 4 $79,705 0 $0 0 $0 APPLICATIONS WITHDRAWN 5 $87,888 1 $179,510 0 $0 FILES CLOSED FOR INCOMPLETENESS 0 $0 0 $0 0 $0
Aggregated Statistics For Year 2002(Based on 7 full and 4 partial tracts) A) Conventional B) Refinancings C) Non-occupant Loans on Number Average Value Number Average Value Number Average Value
LOANS ORIGINATED 93 $95,693 38 $102,157 9 $116,959 APPLICATIONS APPROVED, NOT ACCEPTED 10 $105,858 7 $76,134 2 $45,925 APPLICATIONS DENIED 0 $0 0 $0 0 $0 APPLICATIONS WITHDRAWN 12 $89,890 2 $147,680 0 $0 FILES CLOSED FOR INCOMPLETENESS 0 $0 0 $0 0 $0
Aggregated Statistics For Year 2001(Based on 7 full and 4 partial tracts) A) Conventional B) Refinancings C) Non-occupant Loans on Number Average Value Number Average Value Number Average Value
LOANS ORIGINATED 84 $91,935 15 $94,966 4 $59,800 APPLICATIONS APPROVED, NOT ACCEPTED 11 $111,585 5 $120,358 1 $271,270 APPLICATIONS DENIED 4 $82,435 0 $0 2 $82,935 APPLICATIONS WITHDRAWN 0 $0 0 $0 0 $0 FILES CLOSED FOR INCOMPLETENESS 2 $62,805 0 $0 0 $0
Aggregated Statistics For Year 2000(Based on 7 full and 4 partial tracts) A) Conventional B) Refinancings C) Non-occupant Loans on Number Average Value Number Average Value Number Average Value
LOANS ORIGINATED 75 $97,952 12 $141,974 2 $117,380 APPLICATIONS APPROVED, NOT ACCEPTED 2 $115,315 3 $61,093 2 $43,055 APPLICATIONS DENIED 3 $88,880 0 $0 0 $0 APPLICATIONS WITHDRAWN 1 $61,620 0 $0 0 $0 FILES CLOSED FOR INCOMPLETENESS 0 $0 0 $0 0 $0
Aggregated Statistics For Year 1999(Based on 4 full and 2 partial tracts) A) Conventional B) Refinancings C) Non-occupant Loans on Number Average Value Number Average Value Number Average Value
LOANS ORIGINATED 35 $96,185 9 $107,538 2 $82,000 APPLICATIONS APPROVED, NOT ACCEPTED 2 $131,530 0 $0 0 $0 APPLICATIONS DENIED 0 $0 2 $63,725 0 $0 APPLICATIONS WITHDRAWN 0 $0 1 $66,710 0 $0 FILES CLOSED FOR INCOMPLETENESS 1 $99,000 2 $64,335 0 $0
2002 - 2018 National Fire Incident Reporting System (NFIRS) incidents See full 2006 National Fire Incident Reporting System statistics for zip code 78410, Texas
Most common first names in zip code 78410 among deceased individuals Name Count Lived (average)
Mary 63 79.1 years William 60 71.2 years James 59 69.8 years John 55 71.3 years Robert 37 71.5 years Charles 34 71.1 years George 31 71.2 years Dorothy 25 77.7 years Maria 23 72.9 years Juan 19 74.3 years
Most common last names in zip code 78410 among deceased individuals Last name Count Lived (average)
Smith 36 74.1 years Garcia 33 65.3 years Jones 20 72.7 years Scott 17 75.5 years Johnson 15 75.2 years Anderson 15 76.3 years Brown 15 76.1 years Wilson 14 75.1 years Williams 14 71.6 years Moore 13 69.6 years
Businesses in zip code 78410
Name Count Name Count
AT&T 1 Holiday Inn 1 Ace Hardware 1 Home Depot 1 Advance Auto Parts 1 Jones New York 1 AutoZone 2 KFC 1 Best Western 1 La Quinta 1 Blockbuster 1 Lane Furniture 1 Burger King 1 Little Caesars Pizza 1 CVS 1 Long John Silver's 1 ColorTyme 1 McDonald's 2 Comfort Inn 1 Papa John's Pizza 1 Cricket Wireless 4 Payless 1 Curves 1 Pizza Hut 2 Dairy Queen 1 Popeyes 1 Dennys 1 RadioShack 1 Discount Tire 1 SONIC Drive-In 2 Domino's Pizza 1 Sprint Nextel 1 FedEx 4 T-Mobile 1 Firestone Complete Auto Care 1 Taco Bell 1 GNC 1 U-Haul 1 GameStop 1 UPS 1 Goodwill 2 Walgreens 1 H&R Block 1 Walmart 1 Hobby Lobby 1

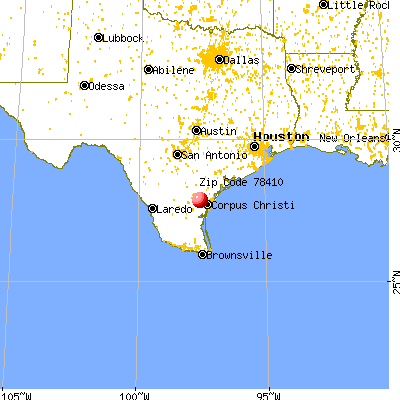


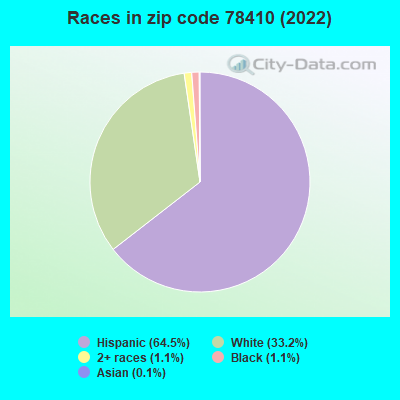


 Nearest zip codes: 78409, 78406, 78370, 78352, 78380, 78408.
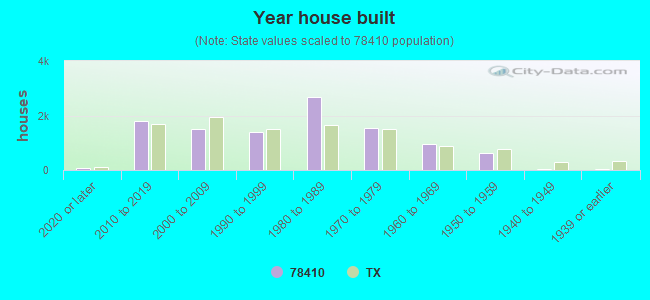
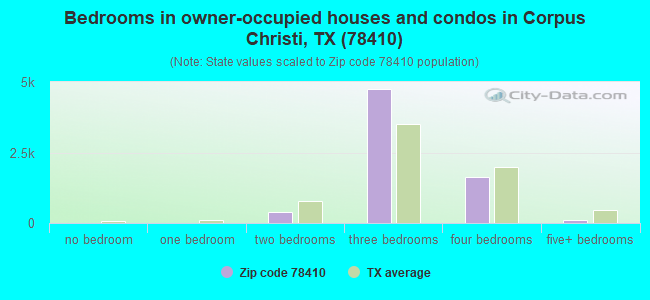


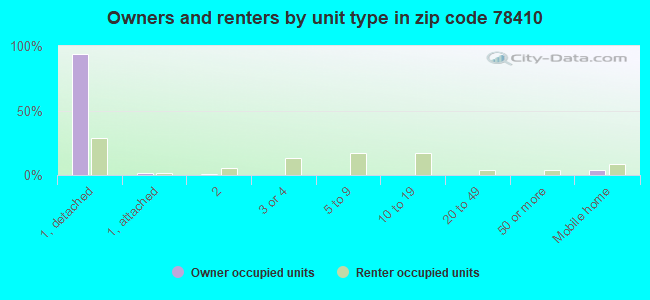


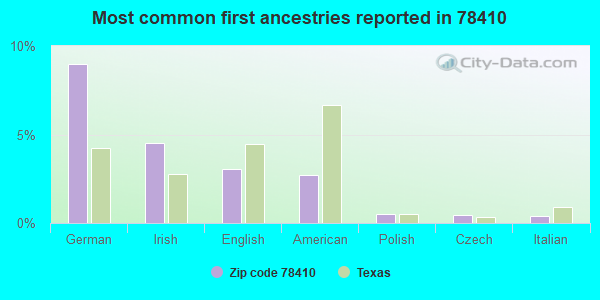
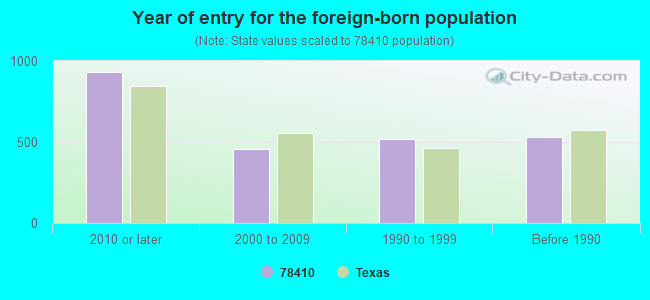


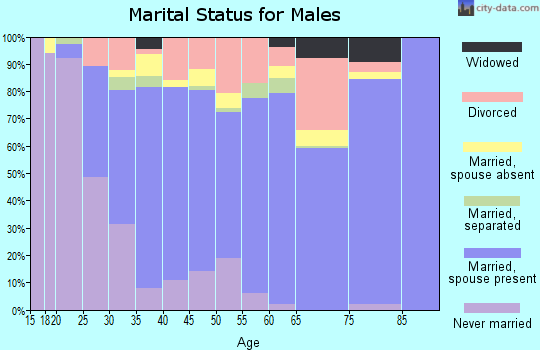
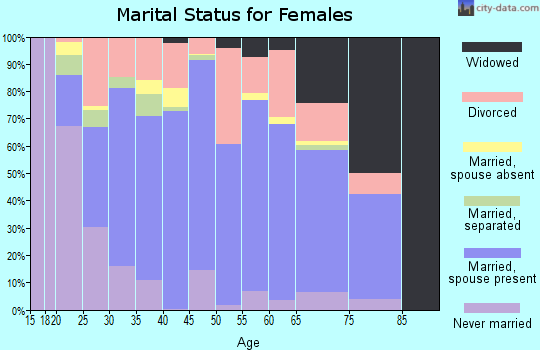


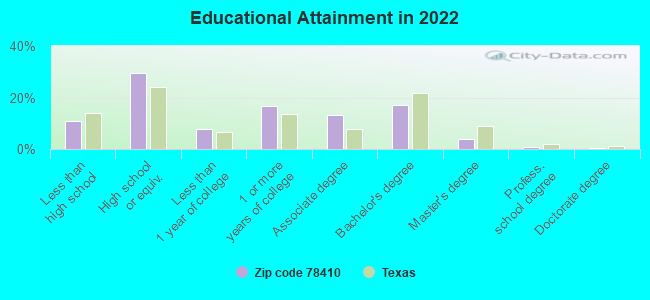

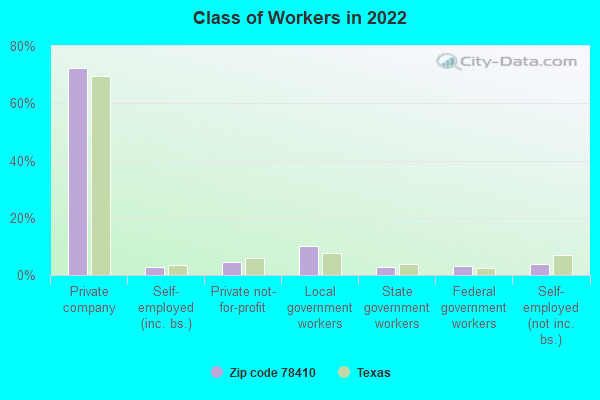
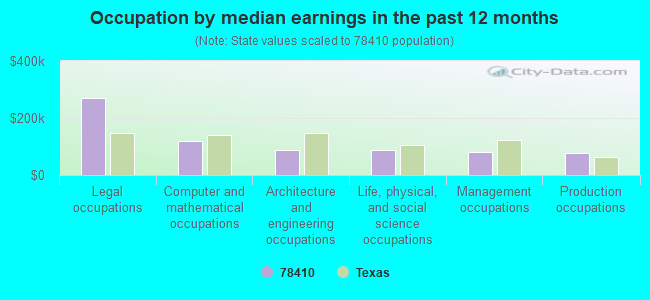
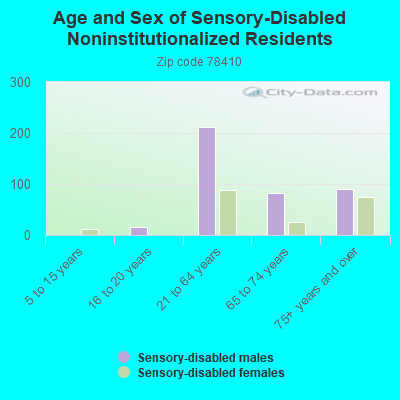
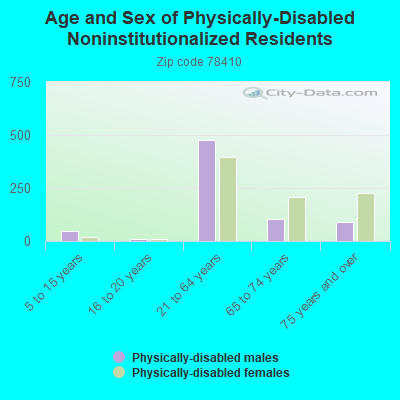
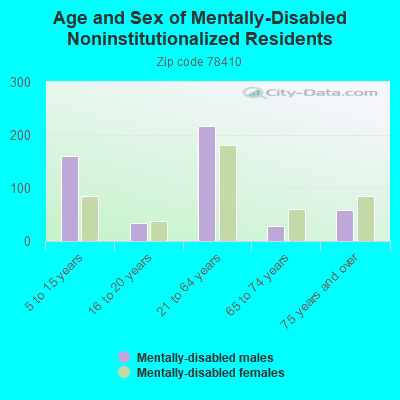
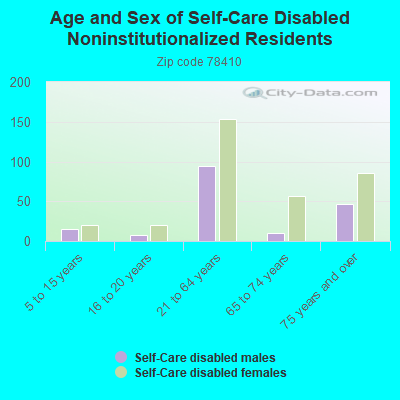
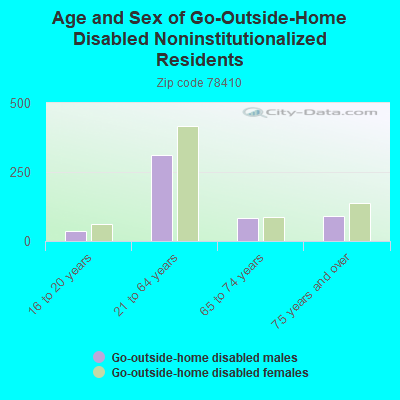

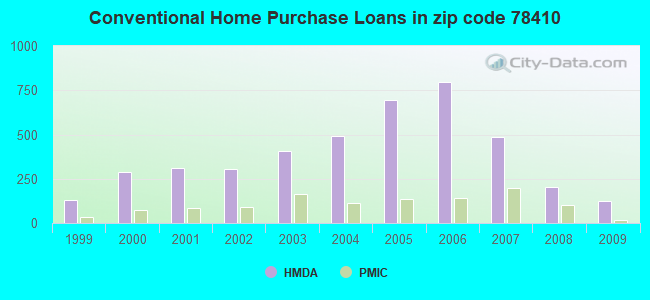
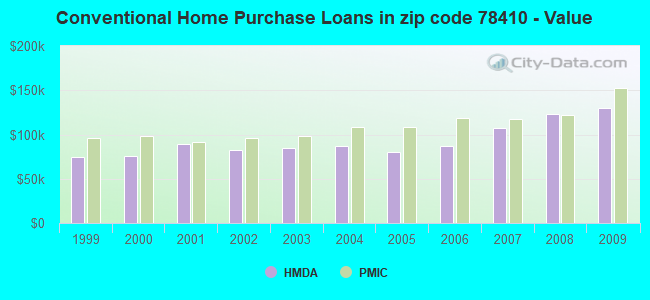
 According to the data from the years 2002 - 2018 the average number of fire incidents per year is 157. The highest number of fires - 302 took place in 2005, and the least - 109 in 2007. The data has an increasing trend.
 When looking into fire subcategories, the most reports belonged to: Outside Fires (51.3%), and Structure Fires (28.9%).