Estimated zip code population in 2022: 15,732
Zip code population in 2010: 12,602
Zip code population in 2000: 9,164
Houses and condos: 7,605
Renter-occupied apartments: 1,364
% of renters here:
20%State:
38%
March 2022 cost of living index in zip code 78676: 83.1
(low, U.S. average is 100)
Land area: 169.0
sq. mi.
Water area: 0.1
sq. mi.
Population density: 93 people per square mile (very low).
OSM Map
General Map
Google Map
MSN Map
OSM Map
General Map
Google Map
MSN Map
OSM Map
General Map
Google Map
MSN Map
OSM Map
General Map
Google Map
MSN Map
Please wait while loading the map...
Real estate property taxes paid for housing units in 2022:
This zip code:
1.2% ($6,210)Texas:
1.5% ($4,050)
Median real estate property taxes paid for housing units with mortgages in 2022: $6,368 (1.3%)
Median real estate property taxes paid for housing units with no mortgage in 2022: $6,131 (1.0%)
Profiles of local businesses
Business Search - 14 Million verified businesses
Males: 8,262 Females: 7,471
For population 25 years and over in 78676:
High school or higher: 94.2%Bachelor's degree or higher: 51.6%Graduate or professional degree: 18.6%Unemployed: 9.4%Mean travel time to work (commute): 31.3 minutes
For population 15 years and over in 78676:
Never married: 25.8%Now married: 56.6%Separated: 0.5%Widowed: 5.4%Divorced: 11.7%
Zip code 78676 compared to state average:
Median house value above state average. Unemployed percentage above state average. Black race population percentage significantly below state average. Hispanic race population percentage below state average. Median age significantly above state average. Foreign-born population percentage significantly below state average. Renting percentage below state average. Length of stay since moving in significantly above state average. House age below state average. Number of college students below state average. Percentage of population with a bachelor's degree or higher above state average. 12,855 81.7% White 2,298 14.6% Hispanic or Latino 158 1.0% Two or more races 144 0.9% Black 79 0.5% Native Hawaiian and Other 78 0.5% Some other race 64 0.4% Asian 54 0.3% American Indian
Data:
Median household income ($)
Median household income (% change since 2000)
Household income diversity
Ratio of average income to average house value (%)
Ratio of average income to average rent
Median household income ($) - White
Median household income ($) - Black or African American
Median household income ($) - Asian
Median household income ($) - Hispanic or Latino
Median household income ($) - American Indian and Alaska Native
Median household income ($) - Multirace
Median household income ($) - Other Race
Median household income for houses/condos with a mortgage ($)
Median household income for apartments without a mortgage ($)
Races - White alone (%)
Races - White alone (% change since 2000)
Races - Black alone (%)
Races - Black alone (% change since 2000)
Races - American Indian alone (%)
Races - American Indian alone (% change since 2000)
Races - Asian alone (%)
Races - Asian alone (% change since 2000)
Races - Hispanic (%)
Races - Hispanic (% change since 2000)
Races - Native Hawaiian and Other Pacific Islander alone (%)
Races - Native Hawaiian and Other Pacific Islander alone (% change since 2000)
Races - Two or more races (%)
Races - Two or more races (% change since 2000)
Races - Other race alone (%)
Races - Other race alone (% change since 2000)
Racial diversity
Unemployment (%)
Unemployment (% change since 2000)
Unemployment (%) - White
Unemployment (%) - Black or African American
Unemployment (%) - Asian
Unemployment (%) - Hispanic or Latino
Unemployment (%) - American Indian and Alaska Native
Unemployment (%) - Multirace
Unemployment (%) - Other Race
Population density (people per square mile)
Population - Males (%)
Population - Females (%)
Population - Males (%) - White
Population - Males (%) - Black or African American
Population - Males (%) - Asian
Population - Males (%) - Hispanic or Latino
Population - Males (%) - American Indian and Alaska Native
Population - Males (%) - Multirace
Population - Males (%) - Other Race
Population - Females (%) - White
Population - Females (%) - Black or African American
Population - Females (%) - Asian
Population - Females (%) - Hispanic or Latino
Population - Females (%) - American Indian and Alaska Native
Population - Females (%) - Multirace
Population - Females (%) - Other Race
Coronavirus confirmed cases (May 04, 2024)
Deaths caused by coronavirus (May 04, 2024)
Coronavirus confirmed cases (per 100k population) (May 04, 2024)
Deaths caused by coronavirus (per 100k population) (May 04, 2024)
Daily increase in number of cases (May 04, 2024)
Weekly increase in number of cases (May 04, 2024)
Cases doubled (in days) (May 04, 2024)
Hospitalized patients (Apr 18, 2022)
Negative test results (Apr 18, 2022)
Total test results (Apr 18, 2022)
COVID Vaccine doses distributed (per 100k population) (Sep 19, 2023)
COVID Vaccine doses administered (per 100k population) (Sep 19, 2023)
COVID Vaccine doses distributed (Sep 19, 2023)
COVID Vaccine doses administered (Sep 19, 2023)
Likely homosexual households (%)
Likely homosexual households (% change since 2000)
Likely homosexual households - Lesbian couples (%)
Likely homosexual households - Lesbian couples (% change since 2000)
Likely homosexual households - Gay men (%)
Likely homosexual households - Gay men (% change since 2000)
Cost of living index
Median gross rent ($)
Median contract rent ($)
Median monthly housing costs ($)
Median house or condo value ($)
Median house or condo value ($ change since 2000)
Mean house or condo value by units in structure - 1, detached ($)
Mean house or condo value by units in structure - 1, attached ($)
Mean house or condo value by units in structure - 2 ($)
Mean house or condo value by units in structure by units in structure - 3 or 4 ($)
Mean house or condo value by units in structure - 5 or more ($)
Mean house or condo value by units in structure - Boat, RV, van, etc. ($)
Mean house or condo value by units in structure - Mobile home ($)
Median house or condo value ($) - White
Median house or condo value ($) - Black or African American
Median house or condo value ($) - Asian
Median house or condo value ($) - Hispanic or Latino
Median house or condo value ($) - American Indian and Alaska Native
Median house or condo value ($) - Multirace
Median house or condo value ($) - Other Race
Median resident age
Resident age diversity
Median resident age - Males
Median resident age - Females
Median resident age - White
Median resident age - Black or African American
Median resident age - Asian
Median resident age - Hispanic or Latino
Median resident age - American Indian and Alaska Native
Median resident age - Multirace
Median resident age - Other Race
Median resident age - Males - White
Median resident age - Males - Black or African American
Median resident age - Males - Asian
Median resident age - Males - Hispanic or Latino
Median resident age - Males - American Indian and Alaska Native
Median resident age - Males - Multirace
Median resident age - Males - Other Race
Median resident age - Females - White
Median resident age - Females - Black or African American
Median resident age - Females - Asian
Median resident age - Females - Hispanic or Latino
Median resident age - Females - American Indian and Alaska Native
Median resident age - Females - Multirace
Median resident age - Females - Other Race
Commute - mean travel time to work (minutes)
Travel time to work - Less than 5 minutes (%)
Travel time to work - Less than 5 minutes (% change since 2000)
Travel time to work - 5 to 9 minutes (%)
Travel time to work - 5 to 9 minutes (% change since 2000)
Travel time to work - 10 to 19 minutes (%)
Travel time to work - 10 to 19 minutes (% change since 2000)
Travel time to work - 20 to 29 minutes (%)
Travel time to work - 20 to 29 minutes (% change since 2000)
Travel time to work - 30 to 39 minutes (%)
Travel time to work - 30 to 39 minutes (% change since 2000)
Travel time to work - 40 to 59 minutes (%)
Travel time to work - 40 to 59 minutes (% change since 2000)
Travel time to work - 60 to 89 minutes (%)
Travel time to work - 60 to 89 minutes (% change since 2000)
Travel time to work - 90 or more minutes (%)
Travel time to work - 90 or more minutes (% change since 2000)
Marital status - Never married (%)
Marital status - Now married (%)
Marital status - Separated (%)
Marital status - Widowed (%)
Marital status - Divorced (%)
Median family income ($)
Median family income (% change since 2000)
Median non-family income ($)
Median non-family income (% change since 2000)
Median per capita income ($)
Median per capita income (% change since 2000)
Median family income ($) - White
Median family income ($) - Black or African American
Median family income ($) - Asian
Median family income ($) - Hispanic or Latino
Median family income ($) - American Indian and Alaska Native
Median family income ($) - Multirace
Median family income ($) - Other Race
Median year house/condo built
Median year apartment built
Year house built - Built 2005 or later (%)
Year house built - Built 2000 to 2004 (%)
Year house built - Built 1990 to 1999 (%)
Year house built - Built 1980 to 1989 (%)
Year house built - Built 1970 to 1979 (%)
Year house built - Built 1960 to 1969 (%)
Year house built - Built 1950 to 1959 (%)
Year house built - Built 1940 to 1949 (%)
Year house built - Built 1939 or earlier (%)
Average household size
Household density (households per square mile)
Average household size - White
Average household size - Black or African American
Average household size - Asian
Average household size - Hispanic or Latino
Average household size - American Indian and Alaska Native
Average household size - Multirace
Average household size - Other Race
Occupied housing units (%)
Vacant housing units (%)
Owner occupied housing units (%)
Renter occupied housing units (%)
Vacancy status - For rent (%)
Vacancy status - For sale only (%)
Vacancy status - Rented or sold, not occupied (%)
Vacancy status - For seasonal, recreational, or occasional use (%)
Vacancy status - For migrant workers (%)
Vacancy status - Other vacant (%)
Residents with income below the poverty level (%)
Residents with income below 50% of the poverty level (%)
Children below poverty level (%)
Poor families by family type - Married-couple family (%)
Poor families by family type - Male, no wife present (%)
Poor families by family type - Female, no husband present (%)
Poverty status for native-born residents (%)
Poverty status for foreign-born residents (%)
Poverty among high school graduates not in families (%)
Poverty among people who did not graduate high school not in families (%)
Residents with income below the poverty level (%) - White
Residents with income below the poverty level (%) - Black or African American
Residents with income below the poverty level (%) - Asian
Residents with income below the poverty level (%) - Hispanic or Latino
Residents with income below the poverty level (%) - American Indian and Alaska Native
Residents with income below the poverty level (%) - Multirace
Residents with income below the poverty level (%) - Other Race
Air pollution - Air Quality Index (AQI)
Air pollution - CO
Air pollution - NO2
Air pollution - SO2
Air pollution - Ozone
Air pollution - PM10
Air pollution - PM25
Air pollution - Pb
Crime - Murders per 100,000 population
Crime - Rapes per 100,000 population
Crime - Robberies per 100,000 population
Crime - Assaults per 100,000 population
Crime - Burglaries per 100,000 population
Crime - Thefts per 100,000 population
Crime - Auto thefts per 100,000 population
Crime - Arson per 100,000 population
Crime - City-data.com crime index
Crime - Violent crime index
Crime - Property crime index
Crime - Murders per 100,000 population (5 year average)
Crime - Rapes per 100,000 population (5 year average)
Crime - Robberies per 100,000 population (5 year average)
Crime - Assaults per 100,000 population (5 year average)
Crime - Burglaries per 100,000 population (5 year average)
Crime - Thefts per 100,000 population (5 year average)
Crime - Auto thefts per 100,000 population (5 year average)
Crime - Arson per 100,000 population (5 year average)
Crime - City-data.com crime index (5 year average)
Crime - Violent crime index (5 year average)
Crime - Property crime index (5 year average)
1996 Presidential Elections Results (%) - Democratic Party (Clinton)
1996 Presidential Elections Results (%) - Republican Party (Dole)
1996 Presidential Elections Results (%) - Other
2000 Presidential Elections Results (%) - Democratic Party (Gore)
2000 Presidential Elections Results (%) - Republican Party (Bush)
2000 Presidential Elections Results (%) - Other
2004 Presidential Elections Results (%) - Democratic Party (Kerry)
2004 Presidential Elections Results (%) - Republican Party (Bush)
2004 Presidential Elections Results (%) - Other
2008 Presidential Elections Results (%) - Democratic Party (Obama)
2008 Presidential Elections Results (%) - Republican Party (McCain)
2008 Presidential Elections Results (%) - Other
2012 Presidential Elections Results (%) - Democratic Party (Obama)
2012 Presidential Elections Results (%) - Republican Party (Romney)
2012 Presidential Elections Results (%) - Other
2016 Presidential Elections Results (%) - Democratic Party (Clinton)
2016 Presidential Elections Results (%) - Republican Party (Trump)
2016 Presidential Elections Results (%) - Other
2020 Presidential Elections Results (%) - Democratic Party (Biden)
2020 Presidential Elections Results (%) - Republican Party (Trump)
2020 Presidential Elections Results (%) - Other
Ancestries Reported - Arab (%)
Ancestries Reported - Czech (%)
Ancestries Reported - Danish (%)
Ancestries Reported - Dutch (%)
Ancestries Reported - English (%)
Ancestries Reported - French (%)
Ancestries Reported - French Canadian (%)
Ancestries Reported - German (%)
Ancestries Reported - Greek (%)
Ancestries Reported - Hungarian (%)
Ancestries Reported - Irish (%)
Ancestries Reported - Italian (%)
Ancestries Reported - Lithuanian (%)
Ancestries Reported - Norwegian (%)
Ancestries Reported - Polish (%)
Ancestries Reported - Portuguese (%)
Ancestries Reported - Russian (%)
Ancestries Reported - Scotch-Irish (%)
Ancestries Reported - Scottish (%)
Ancestries Reported - Slovak (%)
Ancestries Reported - Subsaharan African (%)
Ancestries Reported - Swedish (%)
Ancestries Reported - Swiss (%)
Ancestries Reported - Ukrainian (%)
Ancestries Reported - United States (%)
Ancestries Reported - Welsh (%)
Ancestries Reported - West Indian (%)
Ancestries Reported - Other (%)
Educational Attainment - No schooling completed (%)
Educational Attainment - Less than high school (%)
Educational Attainment - High school or equivalent (%)
Educational Attainment - Less than 1 year of college (%)
Educational Attainment - 1 or more years of college (%)
Educational Attainment - Associate degree (%)
Educational Attainment - Bachelor's degree (%)
Educational Attainment - Master's degree (%)
Educational Attainment - Professional school degree (%)
Educational Attainment - Doctorate degree (%)
School Enrollment - Nursery, preschool (%)
School Enrollment - Kindergarten (%)
School Enrollment - Grade 1 to 4 (%)
School Enrollment - Grade 5 to 8 (%)
School Enrollment - Grade 9 to 12 (%)
School Enrollment - College undergrad (%)
School Enrollment - Graduate or professional (%)
School Enrollment - Not enrolled in school (%)
School enrollment - Public schools (%)
School enrollment - Private schools (%)
School enrollment - Not enrolled (%)
Median number of rooms in houses and condos
Median number of rooms in apartments
Housing units lacking complete plumbing facilities (%)
Housing units lacking complete kitchen facilities (%)
Density of houses
Urban houses (%)
Rural houses (%)
Households with people 60 years and over (%)
Households with people 65 years and over (%)
Households with people 75 years and over (%)
Households with one or more nonrelatives (%)
Households with no nonrelatives (%)
Population in households (%)
Family households (%)
Nonfamily households (%)
Population in families (%)
Family households with own children (%)
Median number of bedrooms in owner occupied houses
Mean number of bedrooms in owner occupied houses
Median number of bedrooms in renter occupied houses
Mean number of bedrooms in renter occupied houses
Median number of vehichles in owner occupied houses
Mean number of vehichles in owner occupied houses
Median number of vehichles in renter occupied houses
Mean number of vehichles in renter occupied houses
Mortgage status - with mortgage (%)
Mortgage status - with second mortgage (%)
Mortgage status - with home equity loan (%)
Mortgage status - with both second mortgage and home equity loan (%)
Mortgage status - without a mortgage (%)
Average family size
Average family size - White
Average family size - Black or African American
Average family size - Asian
Average family size - Hispanic or Latino
Average family size - American Indian and Alaska Native
Average family size - Multirace
Average family size - Other Race
Geographical mobility - Same house 1 year ago (%)
Geographical mobility - Moved within same county (%)
Geographical mobility - Moved from different county within same state (%)
Geographical mobility - Moved from different state (%)
Geographical mobility - Moved from abroad (%)
Place of birth - Born in state of residence (%)
Place of birth - Born in other state (%)
Place of birth - Native, outside of US (%)
Place of birth - Foreign born (%)
Housing units in structures - 1, detached (%)
Housing units in structures - 1, attached (%)
Housing units in structures - 2 (%)
Housing units in structures - 3 or 4 (%)
Housing units in structures - 5 to 9 (%)
Housing units in structures - 10 to 19 (%)
Housing units in structures - 20 to 49 (%)
Housing units in structures - 50 or more (%)
Housing units in structures - Mobile home (%)
Housing units in structures - Boat, RV, van, etc. (%)
House/condo owner moved in on average (years ago)
Renter moved in on average (years ago)
Year householder moved into unit - Moved in 1999 to March 2000 (%)
Year householder moved into unit - Moved in 1995 to 1998 (%)
Year householder moved into unit - Moved in 1990 to 1994 (%)
Year householder moved into unit - Moved in 1980 to 1989 (%)
Year householder moved into unit - Moved in 1970 to 1979 (%)
Year householder moved into unit - Moved in 1969 or earlier (%)
Means of transportation to work - Drove car alone (%)
Means of transportation to work - Carpooled (%)
Means of transportation to work - Public transportation (%)
Means of transportation to work - Bus or trolley bus (%)
Means of transportation to work - Streetcar or trolley car (%)
Means of transportation to work - Subway or elevated (%)
Means of transportation to work - Railroad (%)
Means of transportation to work - Ferryboat (%)
Means of transportation to work - Taxicab (%)
Means of transportation to work - Motorcycle (%)
Means of transportation to work - Bicycle (%)
Means of transportation to work - Walked (%)
Means of transportation to work - Other means (%)
Working at home (%)
Industry diversity
Most Common Industries - Agriculture, forestry, fishing and hunting, and mining (%)
Most Common Industries - Agriculture, forestry, fishing and hunting (%)
Most Common Industries - Mining, quarrying, and oil and gas extraction (%)
Most Common Industries - Construction (%)
Most Common Industries - Manufacturing (%)
Most Common Industries - Wholesale trade (%)
Most Common Industries - Retail trade (%)
Most Common Industries - Transportation and warehousing, and utilities (%)
Most Common Industries - Transportation and warehousing (%)
Most Common Industries - Utilities (%)
Most Common Industries - Information (%)
Most Common Industries - Finance and insurance, and real estate and rental and leasing (%)
Most Common Industries - Finance and insurance (%)
Most Common Industries - Real estate and rental and leasing (%)
Most Common Industries - Professional, scientific, and management, and administrative and waste management services (%)
Most Common Industries - Professional, scientific, and technical services (%)
Most Common Industries - Management of companies and enterprises (%)
Most Common Industries - Administrative and support and waste management services (%)
Most Common Industries - Educational services, and health care and social assistance (%)
Most Common Industries - Educational services (%)
Most Common Industries - Health care and social assistance (%)
Most Common Industries - Arts, entertainment, and recreation, and accommodation and food services (%)
Most Common Industries - Arts, entertainment, and recreation (%)
Most Common Industries - Accommodation and food services (%)
Most Common Industries - Other services, except public administration (%)
Most Common Industries - Public administration (%)
Occupation diversity
Most Common Occupations - Management, business, science, and arts occupations (%)
Most Common Occupations - Management, business, and financial occupations (%)
Most Common Occupations - Management occupations (%)
Most Common Occupations - Business and financial operations occupations (%)
Most Common Occupations - Computer, engineering, and science occupations (%)
Most Common Occupations - Computer and mathematical occupations (%)
Most Common Occupations - Architecture and engineering occupations (%)
Most Common Occupations - Life, physical, and social science occupations (%)
Most Common Occupations - Education, legal, community service, arts, and media occupations (%)
Most Common Occupations - Community and social service occupations (%)
Most Common Occupations - Legal occupations (%)
Most Common Occupations - Education, training, and library occupations (%)
Most Common Occupations - Arts, design, entertainment, sports, and media occupations (%)
Most Common Occupations - Healthcare practitioners and technical occupations (%)
Most Common Occupations - Health diagnosing and treating practitioners and other technical occupations (%)
Most Common Occupations - Health technologists and technicians (%)
Most Common Occupations - Service occupations (%)
Most Common Occupations - Healthcare support occupations (%)
Most Common Occupations - Protective service occupations (%)
Most Common Occupations - Fire fighting and prevention, and other protective service workers including supervisors (%)
Most Common Occupations - Law enforcement workers including supervisors (%)
Most Common Occupations - Food preparation and serving related occupations (%)
Most Common Occupations - Building and grounds cleaning and maintenance occupations (%)
Most Common Occupations - Personal care and service occupations (%)
Most Common Occupations - Sales and office occupations (%)
Most Common Occupations - Sales and related occupations (%)
Most Common Occupations - Office and administrative support occupations (%)
Most Common Occupations - Natural resources, construction, and maintenance occupations (%)
Most Common Occupations - Farming, fishing, and forestry occupations (%)
Most Common Occupations - Construction and extraction occupations (%)
Most Common Occupations - Installation, maintenance, and repair occupations (%)
Most Common Occupations - Production, transportation, and material moving occupations (%)
Most Common Occupations - Production occupations (%)
Most Common Occupations - Transportation occupations (%)
Most Common Occupations - Material moving occupations (%)
People in Group quarters - Institutionalized population (%)
People in Group quarters - Correctional institutions (%)
People in Group quarters - Federal prisons and detention centers (%)
People in Group quarters - Halfway houses (%)
People in Group quarters - Local jails and other confinement facilities (including police lockups) (%)
People in Group quarters - Military disciplinary barracks (%)
People in Group quarters - State prisons (%)
People in Group quarters - Other types of correctional institutions (%)
People in Group quarters - Nursing homes (%)
People in Group quarters - Hospitals/wards, hospices, and schools for the handicapped (%)
People in Group quarters - Hospitals/wards and hospices for chronically ill (%)
People in Group quarters - Hospices or homes for chronically ill (%)
People in Group quarters - Military hospitals or wards for chronically ill (%)
People in Group quarters - Other hospitals or wards for chronically ill (%)
People in Group quarters - Hospitals or wards for drug/alcohol abuse (%)
People in Group quarters - Mental (Psychiatric) hospitals or wards (%)
People in Group quarters - Schools, hospitals, or wards for the mentally retarded (%)
People in Group quarters - Schools, hospitals, or wards for the physically handicapped (%)
People in Group quarters - Institutions for the deaf (%)
People in Group quarters - Institutions for the blind (%)
People in Group quarters - Orthopedic wards and institutions for the physically handicapped (%)
People in Group quarters - Wards in general hospitals for patients who have no usual home elsewhere (%)
People in Group quarters - Wards in military hospitals for patients who have no usual home elsewhere (%)
People in Group quarters - Juvenile institutions (%)
People in Group quarters - Long-term care (%)
People in Group quarters - Homes for abused, dependent, and neglected children (%)
People in Group quarters - Residential treatment centers for emotionally disturbed children (%)
People in Group quarters - Training schools for juvenile delinquents (%)
People in Group quarters - Short-term care, detention or diagnostic centers for delinquent children (%)
People in Group quarters - Type of juvenile institution unknown (%)
People in Group quarters - Noninstitutionalized population (%)
People in Group quarters - College dormitories (includes college quarters off campus) (%)
People in Group quarters - Military quarters (%)
People in Group quarters - On base (%)
People in Group quarters - Barracks, unaccompanied personnel housing (UPH), (Enlisted/Officer), ;and similar group living quarters for military personnel (%)
People in Group quarters - Transient quarters for temporary residents (%)
People in Group quarters - Military ships (%)
People in Group quarters - Group homes (%)
People in Group quarters - Homes or halfway houses for drug/alcohol abuse (%)
People in Group quarters - Homes for the mentally ill (%)
People in Group quarters - Homes for the mentally retarded (%)
People in Group quarters - Homes for the physically handicapped (%)
People in Group quarters - Other group homes (%)
People in Group quarters - Religious group quarters (%)
People in Group quarters - Dormitories (%)
People in Group quarters - Agriculture workers' dormitories on farms (%)
People in Group quarters - Job Corps and vocational training facilities (%)
People in Group quarters - Other workers' dormitories (%)
People in Group quarters - Crews of maritime vessels (%)
People in Group quarters - Other nonhousehold living situations (%)
People in Group quarters - Other noninstitutional group quarters (%)
Residents speaking English at home (%)
Residents speaking English at home - Born in the United States (%)
Residents speaking English at home - Native, born elsewhere (%)
Residents speaking English at home - Foreign born (%)
Residents speaking Spanish at home (%)
Residents speaking Spanish at home - Born in the United States (%)
Residents speaking Spanish at home - Native, born elsewhere (%)
Residents speaking Spanish at home - Foreign born (%)
Residents speaking other language at home (%)
Residents speaking other language at home - Born in the United States (%)
Residents speaking other language at home - Native, born elsewhere (%)
Residents speaking other language at home - Foreign born (%)
Class of Workers - Employee of private company (%)
Class of Workers - Self-employed in own incorporated business (%)
Class of Workers - Private not-for-profit wage and salary workers (%)
Class of Workers - Local government workers (%)
Class of Workers - State government workers (%)
Class of Workers - Federal government workers (%)
Class of Workers - Self-employed workers in own not incorporated business and Unpaid family workers (%)
House heating fuel used in houses and condos - Utility gas (%)
House heating fuel used in houses and condos - Bottled, tank, or LP gas (%)
House heating fuel used in houses and condos - Electricity (%)
House heating fuel used in houses and condos - Fuel oil, kerosene, etc. (%)
House heating fuel used in houses and condos - Coal or coke (%)
House heating fuel used in houses and condos - Wood (%)
House heating fuel used in houses and condos - Solar energy (%)
House heating fuel used in houses and condos - Other fuel (%)
House heating fuel used in houses and condos - No fuel used (%)
House heating fuel used in apartments - Utility gas (%)
House heating fuel used in apartments - Bottled, tank, or LP gas (%)
House heating fuel used in apartments - Electricity (%)
House heating fuel used in apartments - Fuel oil, kerosene, etc. (%)
House heating fuel used in apartments - Coal or coke (%)
House heating fuel used in apartments - Wood (%)
House heating fuel used in apartments - Solar energy (%)
House heating fuel used in apartments - Other fuel (%)
House heating fuel used in apartments - No fuel used (%)
Armed forces status - In Armed Forces (%)
Armed forces status - Civilian (%)
Armed forces status - Civilian - Veteran (%)
Armed forces status - Civilian - Nonveteran (%)
Fatal accidents locations in years 2005-2021
Fatal accidents locations in 2005
Fatal accidents locations in 2006
Fatal accidents locations in 2007
Fatal accidents locations in 2008
Fatal accidents locations in 2009
Fatal accidents locations in 2010
Fatal accidents locations in 2011
Fatal accidents locations in 2012
Fatal accidents locations in 2013
Fatal accidents locations in 2014
Fatal accidents locations in 2015
Fatal accidents locations in 2016
Fatal accidents locations in 2017
Fatal accidents locations in 2018
Fatal accidents locations in 2019
Fatal accidents locations in 2020
Fatal accidents locations in 2021
Alcohol use - People drinking some alcohol every month (%)
Alcohol use - People not drinking at all (%)
Alcohol use - Average days/month drinking alcohol
Alcohol use - Average drinks/week
Alcohol use - Average days/year people drink much
Audiometry - Average condition of hearing (%)
Audiometry - People that can hear a whisper from across a quiet room (%)
Audiometry - People that can hear normal voice from across a quiet room (%)
Audiometry - Ears ringing, roaring, buzzing (%)
Audiometry - Had a job exposure to loud noise (%)
Audiometry - Had off-work exposure to loud noise (%)
Blood Pressure & Cholesterol - Has high blood pressure (%)
Blood Pressure & Cholesterol - Checking blood pressure at home (%)
Blood Pressure & Cholesterol - Frequently checking blood cholesterol (%)
Blood Pressure & Cholesterol - Has high cholesterol level (%)
Consumer Behavior - Money monthly spent on food at supermarket/grocery store
Consumer Behavior - Money monthly spent on food at other stores
Consumer Behavior - Money monthly spent on eating out
Consumer Behavior - Money monthly spent on carryout/delivered foods
Consumer Behavior - Income spent on food at supermarket/grocery store (%)
Consumer Behavior - Income spent on food at other stores (%)
Consumer Behavior - Income spent on eating out (%)
Consumer Behavior - Income spent on carryout/delivered foods (%)
Current Health Status - General health condition (%)
Current Health Status - Blood donors (%)
Current Health Status - Has blood ever tested for HIV virus (%)
Current Health Status - Left-handed people (%)
Dermatology - People using sunscreen (%)
Diabetes - Diabetics (%)
Diabetes - Had a blood test for high blood sugar (%)
Diabetes - People taking insulin (%)
Diet Behavior & Nutrition - Diet health (%)
Diet Behavior & Nutrition - Milk product consumption (# of products/month)
Diet Behavior & Nutrition - Meals not home prepared (#/week)
Diet Behavior & Nutrition - Meals from fast food or pizza place (#/week)
Diet Behavior & Nutrition - Ready-to-eat foods (#/month)
Diet Behavior & Nutrition - Frozen meals/pizza (#/month)
Drug Use - People that ever used marijuana or hashish (%)
Drug Use - Ever used hard drugs (%)
Drug Use - Ever used any form of cocaine (%)
Drug Use - Ever used heroin (%)
Drug Use - Ever used methamphetamine (%)
Health Insurance - People covered by health insurance (%)
Kidney Conditions-Urology - Avg. # of times urinating at night
Medical Conditions - People with asthma (%)
Medical Conditions - People with anemia (%)
Medical Conditions - People with psoriasis (%)
Medical Conditions - People with overweight (%)
Medical Conditions - Elderly people having difficulties in thinking or remembering (%)
Medical Conditions - People who ever received blood transfusion (%)
Medical Conditions - People having trouble seeing even with glass/contacts (%)
Medical Conditions - People with arthritis (%)
Medical Conditions - People with gout (%)
Medical Conditions - People with congestive heart failure (%)
Medical Conditions - People with coronary heart disease (%)
Medical Conditions - People with angina pectoris (%)
Medical Conditions - People who ever had heart attack (%)
Medical Conditions - People who ever had stroke (%)
Medical Conditions - People with emphysema (%)
Medical Conditions - People with thyroid problem (%)
Medical Conditions - People with chronic bronchitis (%)
Medical Conditions - People with any liver condition (%)
Medical Conditions - People who ever had cancer or malignancy (%)
Mental Health - People who have little interest in doing things (%)
Mental Health - People feeling down, depressed, or hopeless (%)
Mental Health - People who have trouble sleeping or sleeping too much (%)
Mental Health - People feeling tired or having little energy (%)
Mental Health - People with poor appetite or overeating (%)
Mental Health - People feeling bad about themself (%)
Mental Health - People who have trouble concentrating on things (%)
Mental Health - People moving or speaking slowly or too fast (%)
Mental Health - People having thoughts they would be better off dead (%)
Oral Health - Average years since last visit a dentist
Oral Health - People embarrassed because of mouth (%)
Oral Health - People with gum disease (%)
Oral Health - General health of teeth and gums (%)
Oral Health - Average days a week using dental floss/device
Oral Health - Average days a week using mouthwash for dental problem
Oral Health - Average number of teeth
Pesticide Use - Households using pesticides to control insects (%)
Pesticide Use - Households using pesticides to kill weeds (%)
Physical Activity - People doing vigorous-intensity work activities (%)
Physical Activity - People doing moderate-intensity work activities (%)
Physical Activity - People walking or bicycling (%)
Physical Activity - People doing vigorous-intensity recreational activities (%)
Physical Activity - People doing moderate-intensity recreational activities (%)
Physical Activity - Average hours a day doing sedentary activities
Physical Activity - Average hours a day watching TV or videos
Physical Activity - Average hours a day using computer
Physical Functioning - People having limitations keeping them from working (%)
Physical Functioning - People limited in amount of work they can do (%)
Physical Functioning - People that need special equipment to walk (%)
Physical Functioning - People experiencing confusion/memory problems (%)
Physical Functioning - People requiring special healthcare equipment (%)
Prescription Medications - Average number of prescription medicines taking
Preventive Aspirin Use - Adults 40+ taking low-dose aspirin (%)
Reproductive Health - Vaginal deliveries (%)
Reproductive Health - Cesarean deliveries (%)
Reproductive Health - Deliveries resulted in a live birth (%)
Reproductive Health - Pregnancies resulted in a delivery (%)
Reproductive Health - Women breastfeeding newborns (%)
Reproductive Health - Women that had a hysterectomy (%)
Reproductive Health - Women that had both ovaries removed (%)
Reproductive Health - Women that have ever taken birth control pills (%)
Reproductive Health - Women taking birth control pills (%)
Reproductive Health - Women that have ever used Depo-Provera or injectables (%)
Reproductive Health - Women that have ever used female hormones (%)
Sexual Behavior - People 18+ that ever had sex (vaginal, anal, or oral) (%)
Sexual Behavior - Males 18+ that ever had vaginal sex with a woman (%)
Sexual Behavior - Males 18+ that ever performed oral sex on a woman (%)
Sexual Behavior - Males 18+ that ever had anal sex with a woman (%)
Sexual Behavior - Males 18+ that ever had any sex with a man (%)
Sexual Behavior - Females 18+ that ever had vaginal sex with a man (%)
Sexual Behavior - Females 18+ that ever performed oral sex on a man (%)
Sexual Behavior - Females 18+ that ever had anal sex with a man (%)
Sexual Behavior - Females 18+ that ever had any kind of sex with a woman (%)
Sexual Behavior - Average age people first had sex
Sexual Behavior - Average number of female sex partners in lifetime (males 18+)
Sexual Behavior - Average number of female vaginal sex partners in lifetime (males 18+)
Sexual Behavior - Average age people first performed oral sex on a woman (18+)
Sexual Behavior - Average number of woman performed oral sex on in lifetime (18+)
Sexual Behavior - Average number of male sex partners in lifetime (males 18+)
Sexual Behavior - Average number of male anal sex partners in lifetime (males 18+)
Sexual Behavior - Average age people first performed oral sex on a man (18+)
Sexual Behavior - Average number of male oral sex partners in lifetime (18+)
Sexual Behavior - People using protection when performing oral sex (%)
Sexual Behavior - Average number of times people have vaginal or anal sex a year
Sexual Behavior - People having sex without condom (%)
Sexual Behavior - Average number of male sex partners in lifetime (females 18+)
Sexual Behavior - Average number of male vaginal sex partners in lifetime (females 18+)
Sexual Behavior - Average number of female sex partners in lifetime (females 18+)
Sexual Behavior - Circumcised males 18+ (%)
Sleep Disorders - Average hours sleeping at night
Sleep Disorders - People that has trouble sleeping (%)
Smoking-Cigarette Use - People smoking cigarettes (%)
Taste & Smell - People 40+ having problems with smell (%)
Taste & Smell - People 40+ having problems with taste (%)
Taste & Smell - People 40+ that ever had wisdom teeth removed (%)
Taste & Smell - People 40+ that ever had tonsils teeth removed (%)
Taste & Smell - People 40+ that ever had a loss of consciousness because of a head injury (%)
Taste & Smell - People 40+ that ever had a broken nose or other serious injury to face or skull (%)
Taste & Smell - People 40+ that ever had two or more sinus infections (%)
Weight - Average height (inches)
Weight - Average weight (pounds)
Weight - Average BMI
Weight - People that are obese (%)
Weight - People that ever were obese (%)
Weight - People trying to lose weight (%)
Urban population: 4,475
Rural population: 11,256
Estimated median house/condo value in 2022: $502,316
78676:
$502,316Texas:
$275,400
According to our research of Texas and other state lists, there were 14 registered sex offenders living in 78676 zip code as of May 04, 2024 . The ratio of all residents to sex offenders in zip code 78676 is 957 to 1.The ratio of registered sex offenders to all residents in this zip code is lower than the state average.
Median resident age: This zip code:
49.6 yearsTexas median age:
35.6 years
Average household size: This zip code:
2.3 peopleTexas:
2.6 people
Averages for the 2020 tax year for zip code 78676, filed in 2021:
Average Adjusted Gross Income (AGI) in 2020: $117,299 (Individual Income Tax Returns) Here:
$117,299State:
$77,054
Salary/wage: $78,470 (reported on 65.8% of returns )Here:
$78,470State:
$62,766
(% of AGI for various income ranges: 1095.4% for AGIs below $25k , 3252.4% for AGIs $25k-50k , 5708.4% for AGIs $50k-75k , 8686.5% for AGIs $75k-100k , 17215.9% for AGIs $100k-200k , 72186.7% for AGIs over 200k ) Taxable interest for individuals: $2,285 (reported on 44.5% of returns )This zip code:
$2,285Texas:
$2,665
(% of AGI for various income ranges: 35.8% for AGIs below $25k , 60.7% for AGIs $25k-50k , 115.0% for AGIs $50k-75k , 147.2% for AGIs $75k-100k , 251.1% for AGIs $100k-200k , 1690.5% for AGIs over 200k ) Ordinary dividends: $11,310 (reported on 32.6% of returns )Here:
$11,310State:
$10,044
(% of AGI for various income ranges: 93.6% for AGIs below $25k , 137.6% for AGIs $25k-50k , 315.2% for AGIs $50k-75k , 532.8% for AGIs $75k-100k , 812.1% for AGIs $100k-200k , 7310.5% for AGIs over 200k ) Net capital gain/loss in AGI: +$83,538 (reported on 31.2% of returns )Here:
+$83,538State:
+$39,590
(% of AGI for various income ranges: 50.4% for AGIs below $25k , 103.3% for AGIs $25k-50k , 287.6% for AGIs $50k-75k , 597.5% for AGIs $75k-100k , 1344.9% for AGIs $100k-200k , 85459.5% for AGIs over 200k ) Profit/loss from business: +$17,918 (reported on 26.8% of returns )Here:
+$17,918State:
+$10,888
(% of AGI for various income ranges: 280.6% for AGIs below $25k , 484.5% for AGIs $25k-50k , 655.9% for AGIs $50k-75k , 875.5% for AGIs $75k-100k , 1283.1% for AGIs $100k-200k , 5489.0% for AGIs over 200k ) Taxable individual retirement arrangement distribution: $33,508 (reported on 16.8% of returns )78676:
$33,508Texas:
$24,740
(% of AGI for various income ranges: 134.6% for AGIs below $25k , 233.4% for AGIs $25k-50k , 581.4% for AGIs $50k-75k , 927.3% for AGIs $75k-100k , 1862.7% for AGIs $100k-200k , 8468.1% for AGIs over 200k ) Self-employed (Keogh) retirement plans: $19,412 (reported on 1.1% of returns )78676:
$19,412Texas:
$29,298
(% of AGI for various income ranges: 77.5% for AGIs $100k-200k , 477.6% for AGIs over 200k ) Total itemized deductions: $40,431 (reported on 12.7% of returns )Here:
$40,431State:
$40,428
(% of AGI for various income ranges: 166.0% for AGIs below $25k , 237.3% for AGIs $25k-50k , 557.4% for AGIs $50k-75k , 874.8% for AGIs $75k-100k , 1173.9% for AGIs $100k-200k , 9112.4% for AGIs over 200k ) Charity contributions: $13,491 (reported on 10.5% of returns )Here:
$13,491State:
$18,201
(% of AGI for various income ranges: 9.8% for AGIs below $25k , 25.1% for AGIs $25k-50k , 83.8% for AGIs $50k-75k , 159.2% for AGIs $75k-100k , 235.2% for AGIs $100k-200k , 3512.9% for AGIs over 200k ) Taxes paid: $7,864 (reported on 12.7% of returns )(% of AGI for various income ranges: 30.6% for AGIs below $25k , 47.4% for AGIs $25k-50k , 127.8% for AGIs $50k-75k , 185.5% for AGIs $75k-100k , 309.3% for AGIs $100k-200k , 1420.0% for AGIs over 200k ) Earned income credit: $1,884 (reported on 8.6% of returns )(% of AGI for various income ranges: 65.8% for AGIs below $25k , 45.0% for AGIs $25k-50k ) Percentage of individuals using paid preparers for their 2020 taxes: 88.7%(% for various income ranges: 86.1% for AGIs below $25k , 88.2% for AGIs $25k-50k , 90.1% for AGIs $50k-75k , 88.2% for AGIs $75k-100k , 90.6% for AGIs $100k-200k , 92.0% for AGIs over 200k )
Averages for the 2012 tax year for zip code 78676, filed in 2013:
Average Adjusted Gross Income (AGI) in 2012: $76,972 (Individual Income Tax Returns) Here:
$76,972State:
$65,384
Salary/wage: $58,637 (reported on 68.8% of returns )Here:
$58,637State:
$52,524
(% of AGI for various income ranges: 58.9% for AGIs below $25k , 58.3% for AGIs $25k-50k , 54.5% for AGIs $50k-75k , 57.5% for AGIs $75k-100k , 60.6% for AGIs $100k-200k , 40.5% for AGIs over 200k ) Taxable interest for individuals: $2,414 (reported on 46.0% of returns )This zip code:
$2,414Texas:
$2,372
(% of AGI for various income ranges: 2.5% for AGIs below $25k , 1.4% for AGIs $25k-50k , 1.2% for AGIs $50k-75k , 1.4% for AGIs $75k-100k , 1.1% for AGIs $100k-200k , 1.7% for AGIs over 200k ) Ordinary dividends: $9,045 (reported on 30.4% of returns )(% of AGI for various income ranges: 4.5% for AGIs below $25k , 2.4% for AGIs $25k-50k , 3.0% for AGIs $50k-75k , 2.6% for AGIs $75k-100k , 2.7% for AGIs $100k-200k , 5.0% for AGIs over 200k ) Net capital gain/loss in AGI: +$16,792 (reported on 27.0% of returns )Here:
+$16,792State:
+$35,319
(% of AGI for various income ranges: 0.6% for AGIs below $25k , 0.8% for AGIs $25k-50k , 1.7% for AGIs $50k-75k , 2.0% for AGIs $75k-100k , 2.7% for AGIs $100k-200k , 13.6% for AGIs over 200k ) Profit/loss from business: +$14,175 (reported on 27.6% of returns )Here:
+$14,175State:
+$13,732
(% of AGI for various income ranges: 16.5% for AGIs below $25k , 8.5% for AGIs $25k-50k , 4.7% for AGIs $50k-75k , 4.2% for AGIs $75k-100k , 5.1% for AGIs $100k-200k , 2.9% for AGIs over 200k ) Taxable individual retirement arrangement distribution: $23,786 (reported on 18.8% of returns )78676:
$23,786Texas:
$19,511
(% of AGI for various income ranges: 5.5% for AGIs below $25k , 5.6% for AGIs $25k-50k , 5.8% for AGIs $50k-75k , 7.0% for AGIs $75k-100k , 6.9% for AGIs $100k-200k , 4.6% for AGIs over 200k ) Self-employment retirement plans: $17,843 (reported on 1.1% of returns )78676:
$17,843Texas:
$23,938
Total itemized deductions: $25,209 (19% of AGI, reported on 39.1% of returns )Here:
$25,209State:
$24,724
Here:
19.4% of AGIState:
15.9% of AGI
(% of AGI for various income ranges: 18.4% for AGIs below $25k , 15.1% for AGIs $25k-50k , 13.9% for AGIs $50k-75k , 13.7% for AGIs $75k-100k , 12.9% for AGIs $100k-200k , 10.6% for AGIs over 200k ) Charity contributions: $5,295 (reported on 32.1% of returns )(% of AGI for various income ranges: 1.4% for AGIs below $25k , 1.6% for AGIs $25k-50k , 1.8% for AGIs $50k-75k , 1.9% for AGIs $75k-100k , 2.1% for AGIs $100k-200k , 2.8% for AGIs over 200k ) Taxes paid: $7,172 (reported on 38.8% of returns )(% of AGI for various income ranges: 4.7% for AGIs below $25k , 4.0% for AGIs $25k-50k , 3.7% for AGIs $50k-75k , 4.5% for AGIs $75k-100k , 4.1% for AGIs $100k-200k , 2.6% for AGIs over 200k ) Earned income credit: $1,938 (reported on 11.7% of returns )(% of AGI for various income ranges: 4.5% for AGIs below $25k , 0.7% for AGIs $25k-50k ) Percentage of individuals using paid preparers for their 2012 taxes: 47.6%(% for various income ranges: 38.3% for AGIs below $25k , 44.9% for AGIs $25k-50k , 51.8% for AGIs $50k-75k , 49.3% for AGIs $75k-100k , 55.6% for AGIs $100k-200k , 77.1% for AGIs over 200k )
Averages for the 2004 tax year for zip code 78676, filed in 2005:
Average Adjusted Gross Income (AGI) in 2004: $61,767 (Individual Income Tax Returns) Here:
$61,767State:
$47,881
Salary/wage: $46,187 (reported on 69.6% of returns )Here:
$46,187State:
$41,947
(% of AGI for various income ranges: 288.5% for AGIs below $10k , 56.7% for AGIs $10k-25k , 60.2% for AGIs $25k-50k , 62.8% for AGIs $50k-75k , 63.2% for AGIs $75k-100k , 42.0% for AGIs over 100k ) Taxable interest for individuals: $2,627 (reported on 53.6% of returns )This zip code:
$2,627Texas:
$2,255
(% of AGI for various income ranges: 46.5% for AGIs below $10k , 3.9% for AGIs $10k-25k , 2.6% for AGIs $25k-50k , 2.1% for AGIs $50k-75k , 1.7% for AGIs $75k-100k , 1.9% for AGIs over 100k ) Taxable dividends: $4,994 (reported on 34.0% of returns )(% of AGI for various income ranges: 29.3% for AGIs below $10k , 3.5% for AGIs $10k-25k , 2.8% for AGIs $25k-50k , 2.2% for AGIs $50k-75k , 1.9% for AGIs $75k-100k , 2.9% for AGIs over 100k ) Net capital gain/loss: +$26,184 (reported on 31.5% of returns )Here:
+$26,184State:
+$16,110
(% of AGI for various income ranges: -13.0% for AGIs below $10k , -1.4% for AGIs $10k-25k , 1.8% for AGIs $25k-50k , 2.5% for AGIs $50k-75k , 3.0% for AGIs $75k-100k , 23.6% for AGIs over 100k ) Profit/loss from business: +$13,078 (reported on 29.1% of returns )Here:
+$13,078State:
+$11,013
(% of AGI for various income ranges: 6.4% for AGIs below $10k , 13.0% for AGIs $10k-25k , 9.2% for AGIs $25k-50k , 6.3% for AGIs $50k-75k , 5.1% for AGIs $75k-100k , 4.9% for AGIs over 100k ) IRA payment deduction: $3,410 (reported on 3.4% of returns )(% of AGI for various income ranges: 2.6% for AGIs below $10k , 0.4% for AGIs $10k-25k , 0.4% for AGIs $25k-50k , 0.2% for AGIs $50k-75k , 0.2% for AGIs $75k-100k , 0.1% for AGIs over 100k ) Self-employed pension: $12,450 (reported on 1.5% of returns )Here:
$12,450Texas:
$16,401
(% of AGI for various income ranges: 0.2% for AGIs $25k-50k , 0.2% for AGIs $50k-75k , 0.2% for AGIs $75k-100k , 0.4% for AGIs over 100k ) Total itemized deductions: $19,973 (20% of AGI, reported on 43.0% of returns )Here:
$19,973State:
$19,631
Here:
20.2% of AGIState:
18.9% of AGI
(% of AGI for various income ranges: 93.6% for AGIs below $10k , 20.3% for AGIs $10k-25k , 16.9% for AGIs $25k-50k , 17.0% for AGIs $50k-75k , 16.4% for AGIs $75k-100k , 10.4% for AGIs over 100k ) Charity contributions deductions: $4,295 (4% of AGI, reported on 35.1% of returns )Here:
4.0% of AGIState:
4.2% of AGI
(% of AGI for various income ranges: 5.9% for AGIs below $10k , 1.7% for AGIs $10k-25k , 1.8% for AGIs $25k-50k , 2.4% for AGIs $50k-75k , 2.0% for AGIs $75k-100k , 2.8% for AGIs over 100k ) Total tax: $10,577 (reported on 80.1% of returns )78676:
$10,577State:
$9,058
(% of AGI for various income ranges: 19.0% for AGIs below $10k , 5.1% for AGIs $10k-25k , 7.7% for AGIs $25k-50k , 9.5% for AGIs $50k-75k , 10.8% for AGIs $75k-100k , 18.0% for AGIs over 100k ) Earned income credit: $1,520 (reported on 10.7% of returns )Percentage of individuals using paid preparers for their 2004 taxes: 51.9%(% for various income ranges: 44.1% for AGIs below $10k , 48.2% for AGIs $10k-25k , 52.3% for AGIs $25k-50k , 53.6% for AGIs $50k-75k , 54.4% for AGIs $75k-100k , 64.7% for AGIs over 100k )
Estimated median household income in 2022: This zip code:
$85,236Texas:
$72,284
Nearest zip codes: 78623 ,
78619 ,
78133 ,
78620 ,
78666 ,
78737 .
Wimberley Zip Code Map
Percentage of family households: This zip code:
37.8%Texas:
50.5%
Percentage of households with unmarried partners: This zip code:
3.1%Texas:
48.7%
Likely homosexual households (counted as self-reported same-sex unmarried-partner households)
Lesbian couples: 0.6% of all households Gay men: 0.1% of all households
Household received Food Stamps/SNAP in the past 12 months: 310Household did not receive Food Stamps/SNAP in the past 12 months: 6,372
Women who had a birth in the past 12 months: 100 (68 now married , 31 unmarried) Women who did not have a birth in the past 12 months: 2,745 (1,226 now married , 1,518 unmarried)
Housing units in zip code 78676 with a mortgage: 3,024 (160
second mortgage , 134
both second mortgage and home equity loan )
Houses without a mortgage: 101
Median monthly owner costs for units with a mortgage: $2,189
Median monthly owner costs for units without a mortgage: $904
Residents with income below the poverty level in 2022:
This zip code:
13.4%Whole state:
14.0%
Residents with income below 50% of the poverty level in 2022:
This zip code:
9.8%Whole state:
7.4%
Median number of rooms in houses and condos: Median number of rooms in apartments: Notable locations in this zip code not listed on our city pages
Click to draw/clear zip code borders Notable locations in zip code 78676: (A) , Eagle Rock Ranch (B) , Fulton Ranch (C) , Halifax Ranch (D) , Houston Boys Camp (E) , Phillips Ranch (F) , Rainbow Ranch (G) , Winn Ranch (H) , John R Dobie House (I) , Pioneer Town (J) , Wimberley Volunteer Fire Department Central Station (K) , Wimberley Volunteer Fire Department Jacobs Well Station (L) , Wimberley Emergency Medical Service Systems (M) . Display/hide their locations on the map
Churches in zip code 78676 include: (A) , The Chapel in the Hills Community Church (B) , Wimberley Church of Christ (C) . Display/hide their locations on the map
Cemeteries: (1) , Pleasant Valley Cemetery (2) , Jacobs Well Cemetery (3) . Display/hide their locations on the map
Reservoirs: (A) , Pierce Lake (B) , Big Dam Lake (C) . Display/hide their locations on the map
Streams, rivers, and creeks: (A) , Spoke Pile Creek (B) , Smith Creek (C) , Pierce Creek (D) , Wilson Creek (E) , Freestone Branch (F) , Lone Man Creek (G) , Pinoak Creek (H) , Little Blanco River (I) . Display/hide their locations on the map
Year house built (houses)
38 2020 or later2,269 2010 to 20191,732 2000 to 2009839 1990 to 19991,427 1980 to 1989636 1970 to 1979138 1960 to 1969231 1950 to 1959168 1940 to 1949149 1939 or earlier
Zip code 78676 household income distribution in 2022 373 Less than $10,00085 $10,000 to $14,999154 $15,000 to $19,999233 $20,000 to $24,999126 $25,000 to $29,999260 $30,000 to $34,999407 $35,000 to $39,999174 $40,000 to $44,999226 $45,000 to $49,999337 $50,000 to $59,999629 $60,000 to $74,999717 $75,000 to $99,999650 $100,000 to $124,999405 $125,000 to $149,999948 $150,000 to $199,999986 $200,000 or moreEstimate of home value of owner-occupied houses/condos in 2022 in zip code 78676 4 $25,000 to $29,9992 $30,000 to $34,99929 $35,000 to $39,9995 $40,000 to $49,99914 $60,000 to $69,99927 $90,000 to $99,99945 $100,000 to $124,99911 $125,000 to $149,99962 $150,000 to $174,99988 $175,000 to $199,999340 $200,000 to $249,999472 $250,000 to $299,9991,355 $300,000 to $399,999987 $400,000 to $499,9991,318 $500,000 to $749,999938 $750,000 to $999,999436 $1,000,000 to $1,499,99968 $1,500,000 to $1,999,999120 $2,000,000 or moreRent paid by renters in 2022 in zip code 78676 165 $300 to $34941 $500 to $549122 $550 to $59957 $600 to $64995 $700 to $74926 $900 to $999141 $1,000 to $1,24963 $1,250 to $1,499419 $1,500 to $1,99913 $2,000 to $2,49911 $2,500 to $2,999196 No cash rent
Median gross rent in 2022: $1,212.
Median price asked for vacant for-sale houses and condos in 2022: $340,878.
Estimated median house (or condo) value in 2022 for: White Non-Hispanic householders: $494,614Black or African American householders: $192,525American Indian or Alaska Native householders: $43,755Asian householders: $393,801Some other race householders: $459,610Two or more races householders: $583,526Hispanic or Latino householders: $492,864Estimated median house or condo value in 2022: $502,316
78676:
$502,316Texas:
$275,400
Lower value quartile - upper value quartile: $364,284 - $789,786
Mean price in 2022: Detached houses: $356,140Here:
$356,140State:
$369,058
Mobile homes: $412,449Here:
$412,449State:
$124,413
Housing units in structures:
One, detached: 6,221One, attached: 179Two: 1243 or 4: 1565 to 9: 1410 to 19: 16920 to 49: 202Mobile homes: 417Boats, RVs, vans, etc.: 90Unemployment : 9.4%
Means of transportation to work in zip code 78676 73.9% 4,978 Drove a car alone5.4% 367 Carpooled0.2% 13 Walked2.3% 156 Other means19.2% 1,292 Worked at homeTravel time to work (commute) in zip code 78676 105 Less than 5 minutes768 5 to 9 minutes468 10 to 14 minutes780 15 to 19 minutes362 20 to 24 minutes169 25 to 29 minutes881 30 to 34 minutes443 35 to 39 minutes242 40 to 44 minutes618 45 to 59 minutes449 60 to 89 minutes237 90 or more minutes
Percentage of zip code residents living and working in this county: 73.1%
Household type by relationship:
Households: 15,732
Male householders: 3,567 (950 living alone ), Female householders: 3,136 (1,019 living alone )3,766 spouses (3,734 opposite-sex spouses ), 327 unmarried partners , (323 opposite-sex unmarried partners ), 4,137 children (3,786 natural , 82 adopted , 270 stepchildren ), 138 grandchildren , 93 brothers or sisters , 61 parents , 0 foster children , 53 other relatives , 421 non-relatives In group quarters: 105 (-1 institutionalized population )
Size of family households: 2,437 2-persons , 763 3-persons , 679 4-persons , 373 5-persons , 103 6-persons , 22 7-or-more-persons
Size of nonfamily households: 1,969 1-person , 300 2-persons , 79 3-persons
2,131 married couples with children. single-parent households (130 men , 34 women ).
86.8% of residents of 78676 zip code speak English at home. of residents speak Spanish at home (74% very well, 4% well, 13% not well, 9% not at all ).of residents speak other Indo-European language at home (100% very well ).of residents speak Asian or Pacific Island language at home (76% very well, 24% well ).
Foreign born population: 985 (6.3%)
(43.1%
of them are naturalized citizens )
This zip code:
6.3%Whole state:
17.2%
48% Honduras 7% Bhutan 5% Germany 5% France 5% Sweden 5% United Kingdom, excluding England and Scotland 3% Romania 17% English 12% American 11% Irish 9% German 3% European 2% Scottish 2% British
Year of entry for the foreign-born population
265 2010 or later 451 2000 to 2009 113 1990 to 1999 341 Before 1990
Facilities with environmental interests located in this zip code:
A T & T (HWY 71 4M SE OF WEBBERVILLE in WIMBERLEY, TX)
Conditionally Exempt Small Quantity Generators, less than 100 kg/month of hazardous waste (Resource Conservation and Recovery Act (tracking hazardous waste)) - notification
Housing units lacking complete plumbing facilities: 1.6%
Housing units lacking complete kitchen facilities: 2.5%
83.7% Electricity 13.1% Bottled, tank, or LP gas 1.1% No fuel used 1.1% Utility gas
Population in 1990: 7,004. Population change in the 1990s: +2,160 (+30.8%).
Place of birth for U.S.-born residents:
This state: 9,254Northeast: 623Midwest: 1,511South: 1,718West: 1,441
45% of the 78676 zip code residents lived in the same house 5 years ago.
Out of people who lived in different houses, 31% lived in this county.
Out of people who lived in different counties, 50% lived in Texas.
94% of the 78676 zip code residents lived in the same house 1 year ago.
Out of people who lived in different houses, 33% moved from this county.
Out of people who lived in different houses, 60% moved from different county within same state.
Out of people who lived in different houses, 11% moved from different state.
Private vs. public school enrollment:
Students in private schools in grades 1 to 8 (elementary and middle school): 16
Students in private schools in grades 9 to 12 (high school): 118
Students in private undergraduate colleges:
Occupation by median earnings in the past 12 months ($)
198,930 Law enforcement workers including supervisors 185,473 Architecture and engineering occupations 103,174 Fire fighting and prevention, and other protective service workers including supervisors 75,275 Computer and mathematical occupations 73,731 Life, physical, and social science occupations 69,067 Health diagnosing and treating practitioners and other technical occupations
Companies with federal contracts located in this zip code:
MARTINEZ, ROGER M (6 QUIVER CT in WIMBERLEY, TX; small business) in 4 contracts in 2006
$12,185 with Army for Educational Services. Signed on 2006-04-06. Completion date: 2006-05-05.
, same as above. Signed on 2006-05-01. Completion date: 2006-05-12.
with Army for Education Services. Signed on 2006-02-13. Completion date: 2006-01-27.
with Army for Educational Services. Signed on 2006-04-06. Completion date: 2006-05-05.
CIRCULAR PRODUCTIONS (11801 FM 2325 in WIMBERLEY, TX; small business)
$5,875 with Air Force for Bars and Rods. Signed on 2005-07-22. Completion date: 2005-08-05.
Top industries in this zip code by the number of employees in 2005:
Health Care and Social Assistance: Nursing Care Facilities (100-249 employees: 1 establishment, 1-4 employees: 1 establishment)Accommodation and Food Services: Full-Service Restaurants (20-49: 3, 10-19: 4, 1-4: 1)Other Services (except Public Administration): Religious Organizations (20-49: 2, 10-19: 3, 5-9: 3, 1-4: 8)Health Care and Social Assistance: Homes for the Elderly (50-99: 1, 5-9: 1, 1-4: 1)Construction: New Single-Family Housing Construction (except Operative Builders) (10-19: 1, 5-9: 2, 1-4: 14)Construction: Highway, Street, and Bridge Construction (20-49: 1, 5-9: 1, 1-4: 2)Construction: Poured Concrete Foundation and Structure Contractors (20-49: 1, 5-9: 1, 1-4: 1)
People in group quarters in 2010:
95 people in nursing facilities/skilled-nursing facilities
6 people in group homes intended for adults
People in group quarters in 2000:
100 people in nursing homes
14 people in other noninstitutional group quarters
Fatal accident statistics in 2014:
Fatal accident count: 1Vehicles involved in fatal accidents: 1Fatal accidents caused by drunken drivers: 0Fatalities: 1Persons involved in fatal accidents: 1Pedestrians involved in fatal accidents: 0
Fatal accident statistics in 2011:
Fatal accident count: 2Vehicles involved in fatal accidents: 2Fatal accidents caused by drunken drivers: 0Fatalities: 2Persons involved in fatal accidents: 3Pedestrians involved in fatal accidents: 0
Home Mortgage Disclosure Act Aggregated Statistics For Year 2009(Based on 6 partial tracts) A) FHA, FSA/RHS & VA B) Conventional C) Refinancings D) Home Improvement Loans F) Non-occupant Loans on G) Loans On Manufactured Number Average Value Number Average Value Number Average Value Number Average Value Number Average Value Number Average Value
LOANS ORIGINATED 358 $159,203 331 $179,532 988 $196,407 59 $83,571 150 $189,707 30 $76,420 APPLICATIONS APPROVED, NOT ACCEPTED 11 $154,917 42 $194,030 112 $178,830 8 $74,870 12 $153,838 7 $50,610 APPLICATIONS DENIED 75 $155,576 70 $182,748 364 $198,939 79 $41,928 61 $209,739 17 $55,209 APPLICATIONS WITHDRAWN 42 $170,433 47 $163,264 274 $187,001 19 $97,687 32 $150,780 11 $94,144 FILES CLOSED FOR INCOMPLETENESS 6 $192,917 8 $230,336 54 $179,432 6 $94,923 7 $172,736 1 $63,110
Aggregated Statistics For Year 2008(Based on 6 partial tracts) A) FHA, FSA/RHS & VA B) Conventional C) Refinancings D) Home Improvement Loans F) Non-occupant Loans on G) Loans On Manufactured Number Average Value Number Average Value Number Average Value Number Average Value Number Average Value Number Average Value
LOANS ORIGINATED 261 $156,449 648 $192,726 461 $194,451 79 $69,546 191 $198,159 30 $72,318 APPLICATIONS APPROVED, NOT ACCEPTED 12 $150,437 78 $182,685 68 $161,621 21 $69,711 24 $170,038 16 $81,115 APPLICATIONS DENIED 56 $159,135 117 $170,572 343 $192,358 167 $44,870 58 $169,157 46 $71,533 APPLICATIONS WITHDRAWN 38 $155,888 79 $176,407 157 $181,596 32 $90,464 41 $182,042 3 $70,933 FILES CLOSED FOR INCOMPLETENESS 7 $182,083 19 $202,644 35 $166,314 9 $54,774 11 $149,766 4 $79,848
Aggregated Statistics For Year 2007(Based on 6 partial tracts) A) FHA, FSA/RHS & VA B) Conventional C) Refinancings D) Home Improvement Loans F) Non-occupant Loans on G) Loans On Manufactured Number Average Value Number Average Value Number Average Value Number Average Value Number Average Value Number Average Value
LOANS ORIGINATED 174 $147,997 1,177 $160,825 414 $188,762 109 $79,610 279 $179,678 58 $73,297 APPLICATIONS APPROVED, NOT ACCEPTED 14 $131,320 159 $148,718 83 $182,730 40 $60,521 38 $235,557 25 $76,732 APPLICATIONS DENIED 27 $137,121 234 $145,295 345 $152,411 142 $62,222 72 $166,235 64 $72,450 APPLICATIONS WITHDRAWN 29 $148,221 138 $160,240 212 $155,459 35 $128,882 37 $166,577 9 $119,184 FILES CLOSED FOR INCOMPLETENESS 4 $89,282 41 $170,397 61 $200,010 5 $74,592 17 $174,526 3 $62,633
Aggregated Statistics For Year 2006(Based on 6 partial tracts) A) FHA, FSA/RHS & VA B) Conventional C) Refinancings D) Home Improvement Loans E) Loans on Dwellings For 5+ Families F) Non-occupant Loans on G) Loans On Manufactured Number Average Value Number Average Value Number Average Value Number Average Value Number Average Value Number Average Value Number Average Value
LOANS ORIGINATED 191 $138,599 1,595 $130,759 445 $188,267 96 $51,051 2 $38,220 395 $127,501 47 $69,410 APPLICATIONS APPROVED, NOT ACCEPTED 7 $130,774 204 $124,709 101 $147,397 33 $52,256 0 $0 30 $93,947 25 $55,386 APPLICATIONS DENIED 18 $130,757 262 $107,702 372 $148,520 149 $48,350 0 $0 100 $117,205 68 $48,564 APPLICATIONS WITHDRAWN 27 $138,286 205 $127,073 314 $165,673 26 $115,613 0 $0 67 $136,167 9 $66,943 FILES CLOSED FOR INCOMPLETENESS 1 $196,460 34 $146,098 69 $157,902 4 $111,105 0 $0 10 $101,048 0 $0
Aggregated Statistics For Year 2005(Based on 6 partial tracts) A) FHA, FSA/RHS & VA B) Conventional C) Refinancings D) Home Improvement Loans F) Non-occupant Loans on G) Loans On Manufactured Number Average Value Number Average Value Number Average Value Number Average Value Number Average Value Number Average Value
LOANS ORIGINATED 227 $134,765 1,328 $128,581 609 $160,761 112 $92,809 368 $124,438 58 $72,229 APPLICATIONS APPROVED, NOT ACCEPTED 15 $147,657 131 $115,919 90 $153,255 32 $53,711 19 $143,218 50 $49,905 APPLICATIONS DENIED 29 $119,642 241 $98,739 471 $141,627 126 $49,716 73 $88,000 78 $61,635 APPLICATIONS WITHDRAWN 26 $131,737 178 $116,304 281 $153,672 52 $171,089 57 $125,595 12 $59,961 FILES CLOSED FOR INCOMPLETENESS 2 $112,180 40 $114,378 172 $165,928 1 $206,550 2 $144,115 1 $40,110
Aggregated Statistics For Year 2004(Based on 6 partial tracts) A) FHA, FSA/RHS & VA B) Conventional C) Refinancings D) Home Improvement Loans E) Loans on Dwellings For 5+ Families F) Non-occupant Loans on G) Loans On Manufactured Number Average Value Number Average Value Number Average Value Number Average Value Number Average Value Number Average Value Number Average Value
LOANS ORIGINATED 274 $128,384 1,089 $126,394 825 $147,791 91 $65,248 5 $705,434 266 $135,479 85 $64,302 APPLICATIONS APPROVED, NOT ACCEPTED 11 $126,808 149 $119,975 129 $162,364 23 $51,874 0 $0 30 $119,359 41 $41,096 APPLICATIONS DENIED 40 $124,279 250 $94,005 498 $129,109 133 $44,232 0 $0 53 $126,841 132 $45,183 APPLICATIONS WITHDRAWN 38 $123,954 125 $133,531 375 $132,716 24 $45,900 0 $0 49 $166,887 17 $74,787 FILES CLOSED FOR INCOMPLETENESS 5 $147,252 26 $135,144 146 $138,115 2 $44,815 0 $0 7 $119,927 1 $87,130
Aggregated Statistics For Year 2003(Based on 6 partial tracts) A) FHA, FSA/RHS & VA B) Conventional C) Refinancings D) Home Improvement Loans E) Loans on Dwellings For 5+ Families F) Non-occupant Loans on Number Average Value Number Average Value Number Average Value Number Average Value Number Average Value Number Average Value
LOANS ORIGINATED 280 $129,195 728 $127,550 1,614 $144,936 69 $40,990 0 $0 203 $128,517 APPLICATIONS APPROVED, NOT ACCEPTED 11 $116,387 77 $123,101 191 $128,277 27 $38,295 0 $0 21 $159,958 APPLICATIONS DENIED 62 $125,759 188 $93,972 664 $123,954 87 $37,038 0 $0 48 $111,440 APPLICATIONS WITHDRAWN 55 $137,811 115 $132,465 523 $132,105 10 $116,256 2 $100,320 34 $148,418 FILES CLOSED FOR INCOMPLETENESS 8 $129,466 17 $240,742 45 $138,125 7 $53,731 0 $0 4 $188,592
Aggregated Statistics For Year 2002(Based on 6 partial tracts) A) FHA, FSA/RHS & VA B) Conventional C) Refinancings D) Home Improvement Loans F) Non-occupant Loans on Number Average Value Number Average Value Number Average Value Number Average Value Number Average Value
LOANS ORIGINATED 268 $133,670 740 $132,211 1,061 $148,322 110 $32,702 177 $134,218 APPLICATIONS APPROVED, NOT ACCEPTED 10 $120,730 102 $94,176 152 $123,318 48 $27,931 22 $111,113 APPLICATIONS DENIED 37 $136,678 201 $72,629 293 $110,650 103 $27,104 42 $97,698 APPLICATIONS WITHDRAWN 42 $135,037 89 $125,296 324 $139,225 12 $42,913 16 $153,881 FILES CLOSED FOR INCOMPLETENESS 14 $145,693 36 $142,141 56 $141,629 3 $125,740 5 $108,874
Aggregated Statistics For Year 2001(Based on 6 partial tracts) A) FHA, FSA/RHS & VA B) Conventional C) Refinancings D) Home Improvement Loans F) Non-occupant Loans on Number Average Value Number Average Value Number Average Value Number Average Value Number Average Value
LOANS ORIGINATED 266 $117,953 733 $119,116 763 $140,161 111 $35,685 151 $131,397 APPLICATIONS APPROVED, NOT ACCEPTED 13 $132,101 124 $80,225 95 $128,222 26 $45,284 17 $109,106 APPLICATIONS DENIED 20 $112,806 263 $73,249 257 $111,802 71 $26,986 44 $100,534 APPLICATIONS WITHDRAWN 88 $131,176 69 $129,040 198 $121,050 18 $28,626 6 $92,677 FILES CLOSED FOR INCOMPLETENESS 5 $126,504 26 $182,277 54 $145,957 2 $38,570 8 $98,429
Aggregated Statistics For Year 2000(Based on 6 partial tracts) A) FHA, FSA/RHS & VA B) Conventional C) Refinancings D) Home Improvement Loans F) Non-occupant Loans on Number Average Value Number Average Value Number Average Value Number Average Value Number Average Value
LOANS ORIGINATED 193 $108,842 633 $112,730 269 $114,626 92 $31,529 92 $102,039 APPLICATIONS APPROVED, NOT ACCEPTED 18 $86,081 137 $90,273 63 $113,352 40 $37,658 9 $149,648 APPLICATIONS DENIED 19 $92,584 304 $66,403 148 $121,053 68 $31,651 32 $86,527 APPLICATIONS WITHDRAWN 50 $116,549 62 $155,052 60 $84,363 8 $44,045 3 $159,727 FILES CLOSED FOR INCOMPLETENESS 4 $98,272 17 $136,661 27 $127,989 0 $0 4 $96,985
Aggregated Statistics For Year 1999(Based on 3 partial tracts) A) FHA, FSA/RHS & VA B) Conventional C) Refinancings D) Home Improvement Loans F) Non-occupant Loans on Number Average Value Number Average Value Number Average Value Number Average Value Number Average Value
LOANS ORIGINATED 45 $96,183 272 $109,736 206 $111,177 45 $29,783 42 $88,912 APPLICATIONS APPROVED, NOT ACCEPTED 4 $124,382 65 $86,028 50 $88,177 9 $24,658 8 $99,739 APPLICATIONS DENIED 7 $99,969 171 $62,560 60 $93,627 21 $26,815 22 $67,205 APPLICATIONS WITHDRAWN 6 $93,855 30 $130,540 39 $94,306 3 $25,953 2 $65,235 FILES CLOSED FOR INCOMPLETENESS 1 $79,480 8 $152,325 13 $92,518 1 $78,330 1 $144,450
Detailed HMDA statistics for the following Tracts:
0108.01
,
0108.02 ,
0109.04
Private Mortgage Insurance Companies Aggregated Statistics For Year 2009(Based on 6 partial tracts) A) Conventional B) Refinancings C) Non-occupant Loans on Number Average Value Number Average Value Number Average Value
LOANS ORIGINATED 53 $196,878 50 $206,140 6 $110,365 APPLICATIONS APPROVED, NOT ACCEPTED 18 $191,448 7 $230,500 1 $115,820 APPLICATIONS DENIED 3 $182,947 8 $221,750 3 $174,493 APPLICATIONS WITHDRAWN 5 $120,628 5 $236,960 3 $112,000 FILES CLOSED FOR INCOMPLETENESS 1 $193,000 1 $59,170 1 $128,360
Aggregated Statistics For Year 2008(Based on 6 partial tracts) A) Conventional B) Refinancings C) Non-occupant Loans on D) Loans On Manufactured Number Average Value Number Average Value Number Average Value Number Average Value
LOANS ORIGINATED 194 $185,706 37 $214,004 37 $165,057 2 $138,495 APPLICATIONS APPROVED, NOT ACCEPTED 46 $186,611 18 $185,753 15 $193,149 2 $113,060 APPLICATIONS DENIED 7 $160,590 5 $250,180 4 $167,940 0 $0 APPLICATIONS WITHDRAWN 14 $190,331 1 $71,700 7 $190,924 0 $0 FILES CLOSED FOR INCOMPLETENESS 1 $157,450 0 $0 1 $101,560 0 $0
Aggregated Statistics For Year 2007(Based on 6 partial tracts) A) Conventional B) Refinancings C) Non-occupant Loans on D) Loans On Manufactured Number Average Value Number Average Value Number Average Value Number Average Value
LOANS ORIGINATED 251 $171,103 31 $171,927 37 $135,368 3 $98,573 APPLICATIONS APPROVED, NOT ACCEPTED 29 $176,200 10 $218,241 4 $188,278 0 $0 APPLICATIONS DENIED 3 $99,147 0 $0 3 $64,763 1 $58,160 APPLICATIONS WITHDRAWN 9 $146,766 6 $267,892 3 $112,740 0 $0 FILES CLOSED FOR INCOMPLETENESS 0 $0 0 $0 0 $0 0 $0
Aggregated Statistics For Year 2006(Based on 6 partial tracts) A) Conventional B) Refinancings C) Non-occupant Loans on D) Loans On Manufactured Number Average Value Number Average Value Number Average Value Number Average Value
LOANS ORIGINATED 139 $150,659 15 $177,007 21 $122,091 2 $58,085 APPLICATIONS APPROVED, NOT ACCEPTED 16 $197,612 3 $236,117 3 $240,307 0 $0 APPLICATIONS DENIED 1 $208,390 2 $148,095 1 $57,160 0 $0 APPLICATIONS WITHDRAWN 6 $234,525 1 $95,460 2 $132,870 0 $0 FILES CLOSED FOR INCOMPLETENESS 1 $57,160 0 $0 0 $0 0 $0
Aggregated Statistics For Year 2005(Based on 6 partial tracts) A) Conventional B) Refinancings C) Non-occupant Loans on D) Loans On Manufactured Number Average Value Number Average Value Number Average Value Number Average Value
LOANS ORIGINATED 119 $145,035 31 $180,326 39 $119,943 1 $160,620 APPLICATIONS APPROVED, NOT ACCEPTED 25 $171,195 10 $149,925 9 $105,936 2 $23,090 APPLICATIONS DENIED 0 $0 1 $175,440 0 $0 0 $0 APPLICATIONS WITHDRAWN 5 $150,190 1 $118,700 1 $80,290 0 $0 FILES CLOSED FOR INCOMPLETENESS 0 $0 0 $0 0 $0 0 $0
Aggregated Statistics For Year 2004(Based on 6 partial tracts) A) Conventional B) Refinancings C) Non-occupant Loans on D) Loans On Manufactured Number Average Value Number Average Value Number Average Value Number Average Value
LOANS ORIGINATED 153 $148,142 65 $142,217 30 $125,804 5 $106,556 APPLICATIONS APPROVED, NOT ACCEPTED 26 $176,323 18 $160,741 6 $204,467 5 $99,374 APPLICATIONS DENIED 0 $0 1 $70,700 0 $0 0 $0 APPLICATIONS WITHDRAWN 8 $131,431 5 $140,168 4 $145,068 2 $42,995 FILES CLOSED FOR INCOMPLETENESS 2 $273,830 1 $133,370 0 $0 0 $0
Aggregated Statistics For Year 2003(Based on 6 partial tracts) A) Conventional B) Refinancings C) Non-occupant Loans on Number Average Value Number Average Value Number Average Value
LOANS ORIGINATED 164 $137,573 126 $150,859 30 $103,756 APPLICATIONS APPROVED, NOT ACCEPTED 39 $170,203 38 $158,434 8 $113,964 APPLICATIONS DENIED 5 $145,196 2 $82,980 0 $0 APPLICATIONS WITHDRAWN 10 $171,438 11 $126,773 1 $217,960 FILES CLOSED FOR INCOMPLETENESS 0 $0 0 $0 0 $0
Aggregated Statistics For Year 2002(Based on 6 partial tracts) A) Conventional B) Refinancings C) Non-occupant Loans on Number Average Value Number Average Value Number Average Value
LOANS ORIGINATED 184 $142,072 60 $145,690 18 $96,023 APPLICATIONS APPROVED, NOT ACCEPTED 28 $160,400 28 $173,728 3 $139,793 APPLICATIONS DENIED 6 $162,808 6 $137,865 2 $187,745 APPLICATIONS WITHDRAWN 10 $171,951 11 $149,171 4 $125,715 FILES CLOSED FOR INCOMPLETENESS 2 $147,295 2 $113,060 0 $0
Aggregated Statistics For Year 2001(Based on 6 partial tracts) A) Conventional B) Refinancings C) Non-occupant Loans on Number Average Value Number Average Value Number Average Value
LOANS ORIGINATED 185 $139,869 46 $142,896 18 $144,419 APPLICATIONS APPROVED, NOT ACCEPTED 35 $172,639 3 $193,230 7 $224,014 APPLICATIONS DENIED 2 $143,490 1 $188,570 0 $0 APPLICATIONS WITHDRAWN 7 $156,076 4 $131,170 0 $0 FILES CLOSED FOR INCOMPLETENESS 1 $168,370 0 $0 0 $0
Aggregated Statistics For Year 2000(Based on 6 partial tracts) A) Conventional B) Refinancings C) Non-occupant Loans on Number Average Value Number Average Value Number Average Value
LOANS ORIGINATED 130 $124,710 39 $156,926 10 $87,107 APPLICATIONS APPROVED, NOT ACCEPTED 13 $119,563 13 $152,215 2 $71,260 APPLICATIONS DENIED 6 $128,575 1 $193,710 0 $0 APPLICATIONS WITHDRAWN 5 $98,896 0 $0 2 $62,105 FILES CLOSED FOR INCOMPLETENESS 2 $140,975 2 $143,905 0 $0
Aggregated Statistics For Year 1999(Based on 3 partial tracts) A) Conventional B) Refinancings C) Non-occupant Loans on Number Average Value Number Average Value Number Average Value
LOANS ORIGINATED 69 $123,780 16 $135,721 4 $101,328 APPLICATIONS APPROVED, NOT ACCEPTED 6 $137,228 4 $124,458 1 $106,970 APPLICATIONS DENIED 6 $115,173 0 $0 0 $0 APPLICATIONS WITHDRAWN 1 $111,670 1 $284,000 0 $0 FILES CLOSED FOR INCOMPLETENESS 1 $101,710 0 $0 1 $85,080
Detailed PMIC statistics for the following Tracts:
0108.01
,
0108.02 ,
0109.04
2002 - 2018 National Fire Incident Reporting System (NFIRS) incidents See full 2006 National Fire Incident Reporting System statistics for zip code 78676, Texas
Most common first names in zip code 78676 among deceased individuals Name Count Lived (average)
William 53 77.4 years James 48 74.6 years John 37 74.8 years Mary 28 82.7 years Robert 27 72.6 years Dorothy 22 81.1 years Ruth 21 85.5 years Charles 19 76.4 years Helen 18 84.1 years Thomas 17 74.0 years
Most common last names in zip code 78676 among deceased individuals Last name Count Lived (average)
Smith 29 77.4 years Johnson 20 78.8 years Brown 11 77.3 years White 11 75.9 years Roberts 10 77.1 years Allen 10 80.0 years Wilson 9 73.2 years Harris 9 81.6 years Jones 9 80.8 years Williams 9 73.8 years
Businesses in zip code 78676
Name Count Name Count
Ace Hardware 1 Pizza Hut 1 Arby's 1 Subway 1 Curves 1 True Value 1 DHL 1 U-Haul 1 Dairy Queen 1 UPS 3 FedEx 3
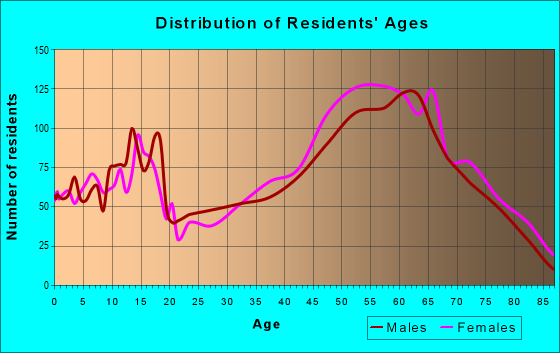
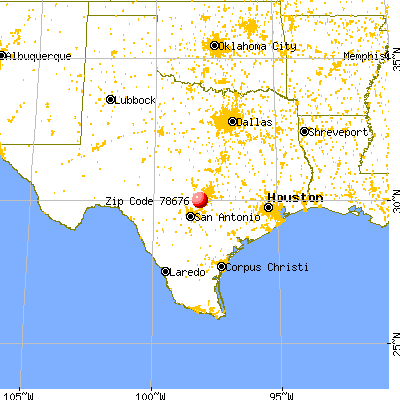


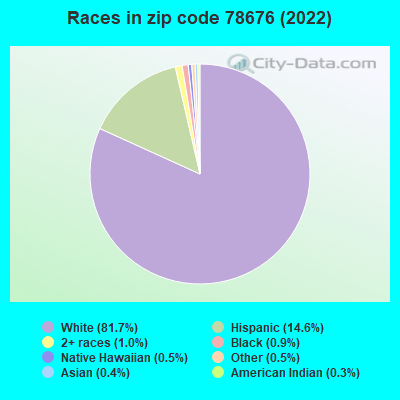


 Nearest zip codes: 78623, 78619, 78133, 78620, 78666, 78737.
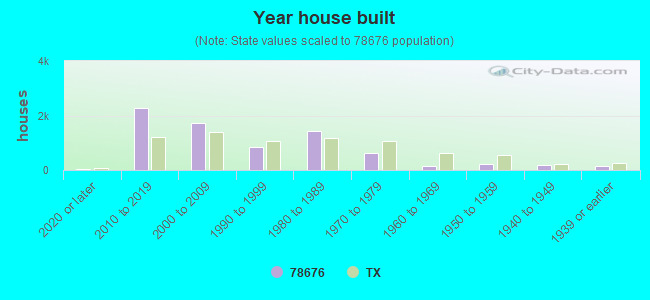

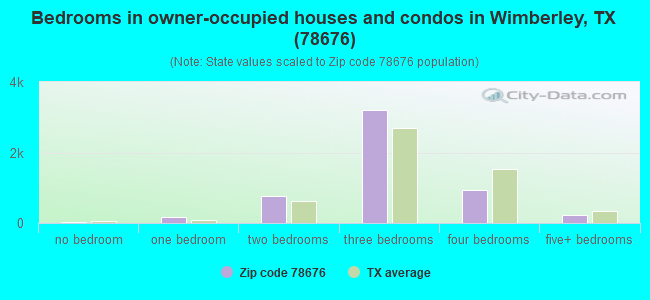
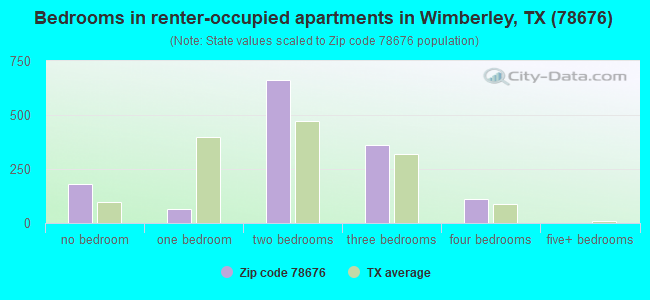
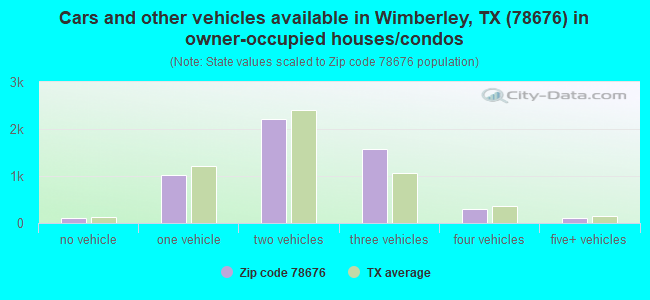
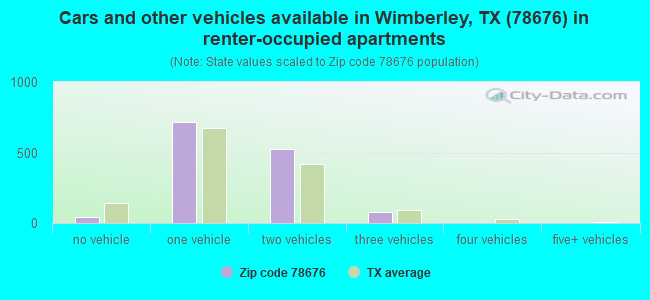


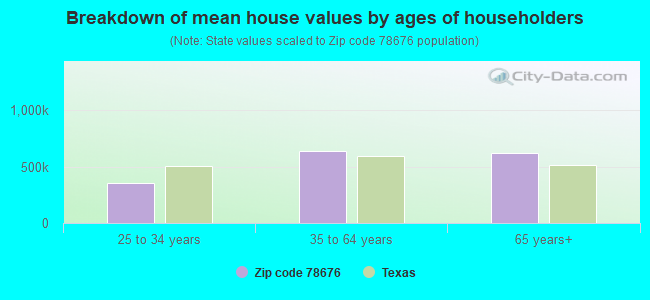


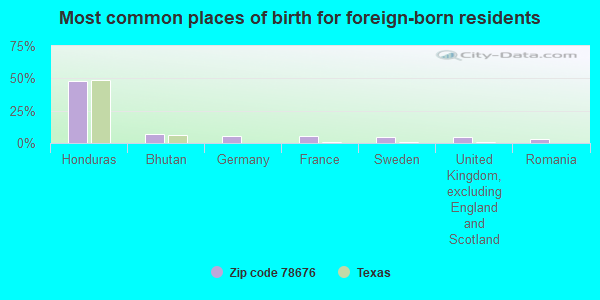

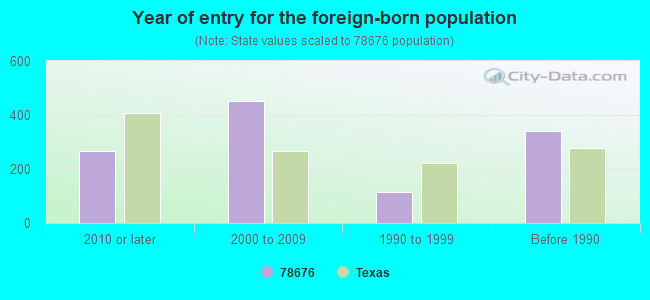


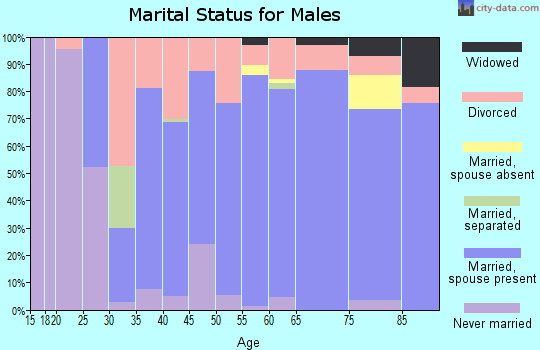
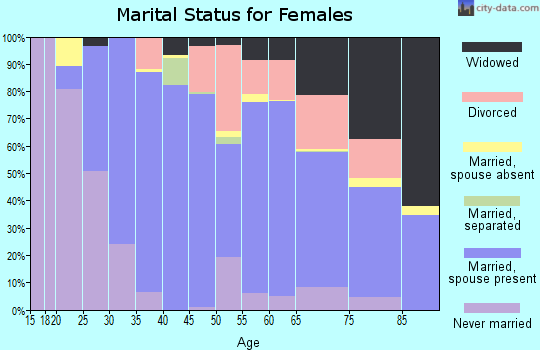

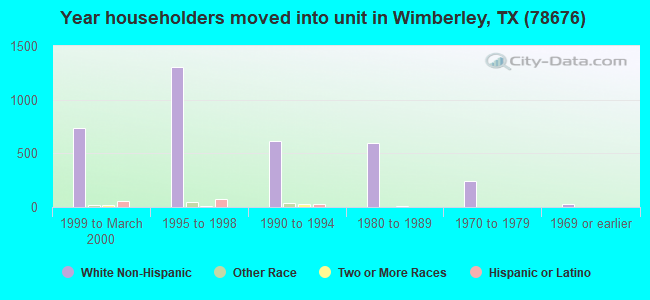
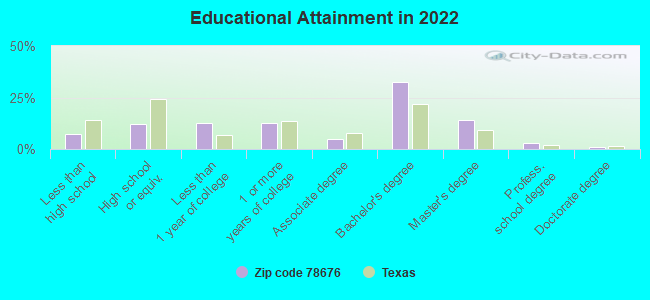


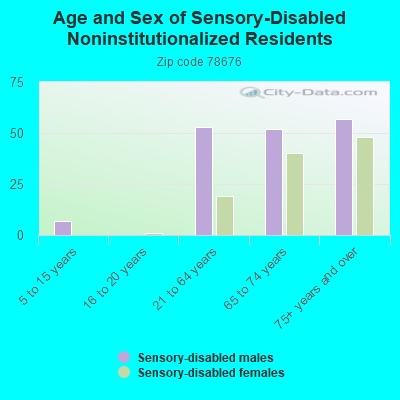
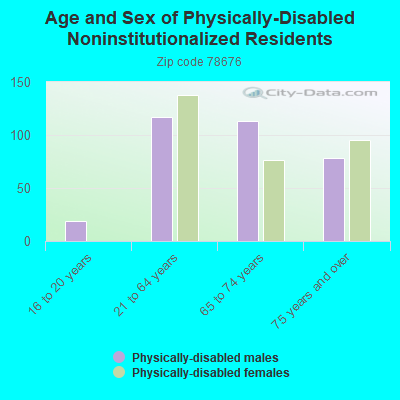
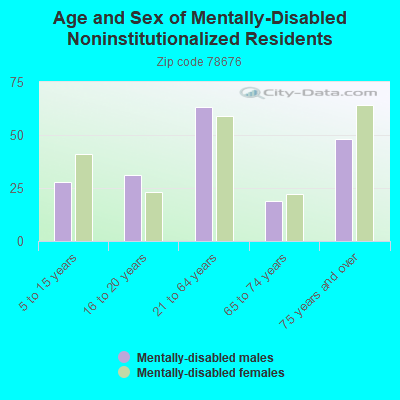
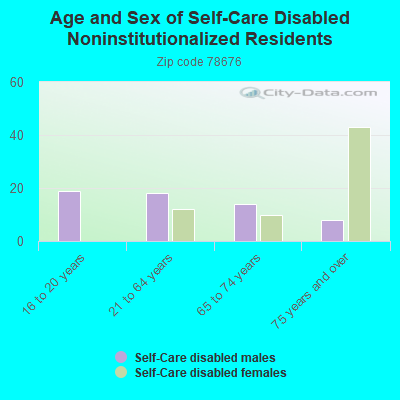
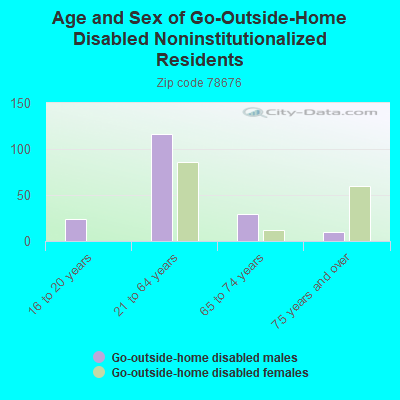

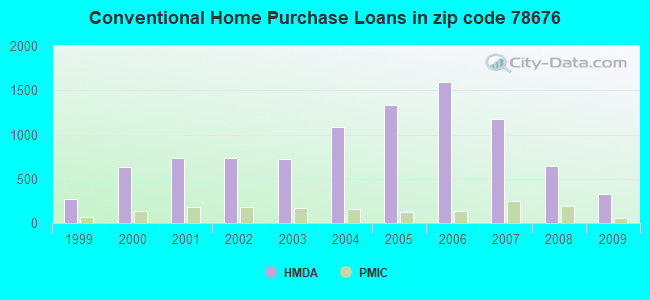
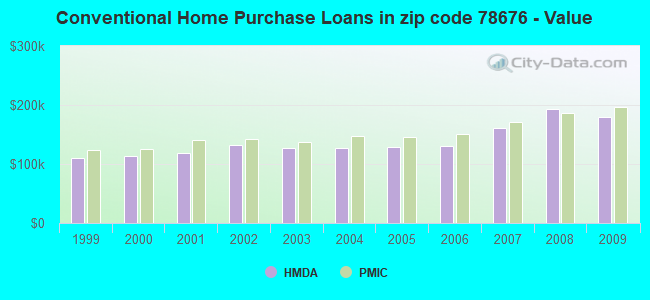
 According to the data from the years 2002 - 2018 the average number of fire incidents per year is 51. The highest number of reported fire incidents - 92 took place in 2017, and the least - 28 in 2002. The data has a rising trend.
 When looking into fire subcategories, the most incidents belonged to: Outside Fires (62.7%), and Structure Fires (26.2%).