Estimated zip code population in 2022: 58,344 Zip code population in 2010: 62,180 Zip code population in 2000: 67,850
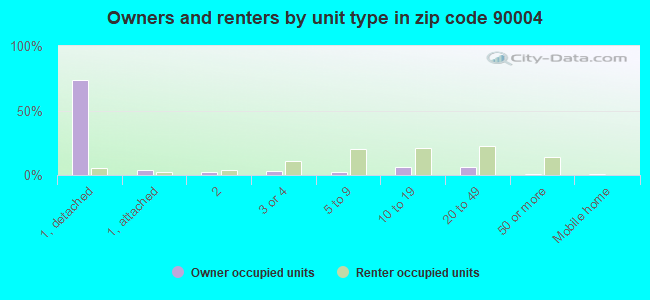
Houses and condos: 25,976 Renter-occupied apartments: 19,502
% of renters here:
83%
State:
44%
March 2022 cost of living index in zip code 90004: 158.4 (very high, U.S. average is 100)
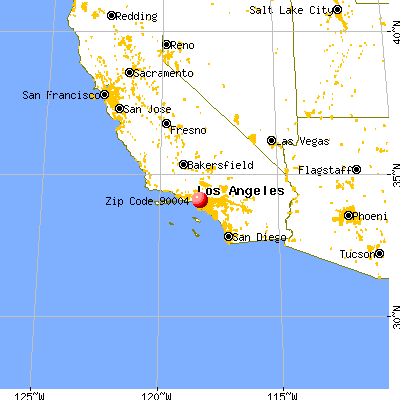
Land area: 3.0 sq. mi. Water area: 0.0 sq. mi.
Population density: 19,141 people per square mile
(very high).
OSM Map
General Map
Google Map
MSN Map
OSM Map
General Map
Google Map
MSN Map
OSM Map
General Map
Google Map
MSN Map
OSM Map
General Map
Google Map
MSN Map
Please wait while loading the map...
Real estate property taxes paid for housing units in 2022:
This zip code:
0.6% ($8,654)
California:
0.7% ($4,831)
Median real estate property taxes paid for housing units with mortgages in 2022: $10,126 (0.6%) Median real estate property taxes paid for housing units with no mortgage in 2022: $4,629 (0.4%)
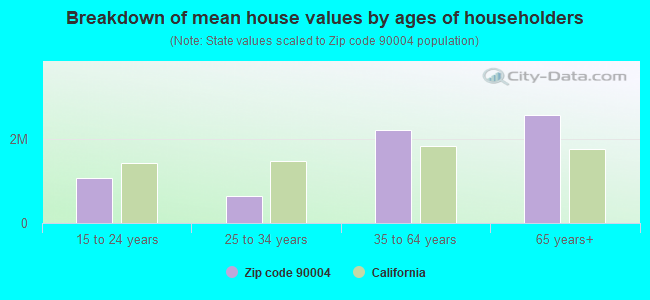
Estimated median house/condo value in 2022: $1,400,310
90004:
$1,400,310
California:
$715,900
According to our research of California and other state lists, there were 54 registered sex offenders living in 90004 zip code as of May 11, 2024. The ratio of all residents to sex offenders in zip code 90004 is 1,185 to 1. The ratio of registered sex offenders to all residents in this zip code is lower than the state average.
Median resident age:
This zip code:
36.5 years
California median age:
37.9 years
Average household size:
This zip code:
2.4 people
California:
2.8 people
Averages for the 2020 tax year for zip code 90004, filed in 2021:
Average Adjusted Gross Income (AGI) in 2020: $81,787 (Individual Income Tax Returns)
Here:
$81,787
State:
$95,910
Salary/wage: $64,117 (reported on 77.7% of returns)
Here:
$64,117
State:
$77,331
(% of AGI for various income ranges: 1137.6% for AGIs below $25k, 4133.9% for AGIs $25k-50k, 7811.4% for AGIs $50k-75k, 11721.1% for AGIs $75k-100k, 21201.4% for AGIs $100k-200k, 197006.2% for AGIs over 200k)
Taxable interest for individuals: $3,578 (reported on 20.5% of returns)
This zip code:
$3,578
California:
$2,294
(% of AGI for various income ranges: 10.3% for AGIs below $25k, 15.2% for AGIs $25k-50k, 30.5% for AGIs $50k-75k, 69.0% for AGIs $75k-100k, 239.6% for AGIs $100k-200k, 5016.2% for AGIs over 200k)
Ordinary dividends: $12,345 (reported on 14.7% of returns)
Here:
$12,345
State:
$10,949
(% of AGI for various income ranges: 17.3% for AGIs below $25k, 25.6% for AGIs $25k-50k, 62.6% for AGIs $50k-75k, 132.2% for AGIs $75k-100k, 662.2% for AGIs $100k-200k, 12784.4% for AGIs over 200k)
Net capital gain/loss in AGI: +$56,666 (reported on 15.2% of returns)
Here:
+$56,666
State:
+$49,306
(% of AGI for various income ranges: 9.5% for AGIs below $25k, 25.8% for AGIs $25k-50k, 87.3% for AGIs $50k-75k, 209.0% for AGIs $75k-100k, 980.2% for AGIs $100k-200k, 73182.8% for AGIs over 200k)
Profit/loss from business: +$11,112 (reported on 28.8% of returns)
Here:
+$11,112
State:
+$15,671
(% of AGI for various income ranges: 359.7% for AGIs below $25k, 280.2% for AGIs $25k-50k, 348.5% for AGIs $50k-75k, 378.1% for AGIs $75k-100k, 1155.8% for AGIs $100k-200k, 9240.0% for AGIs over 200k)
Taxable individual retirement arrangement distribution: $23,725 (reported on 2.9% of returns)
90004:
$23,725
California:
$23,505
(% of AGI for various income ranges: 15.3% for AGIs below $25k, 23.6% for AGIs $25k-50k, 75.0% for AGIs $50k-75k, 167.7% for AGIs $75k-100k, 506.1% for AGIs $100k-200k, 2953.8% for AGIs over 200k)
Self-employed (Keogh) retirement plans: $38,152 (reported on 0.8% of returns)
90004:
$38,152
California:
$30,163
(% of AGI for various income ranges: 17.0% for AGIs $50k-75k, 81.4% for AGIs $100k-200k, 2371.9% for AGIs over 200k)
Total itemized deductions: $54,705 (reported on 8.3% of returns)
Here:
$54,705
State:
$39,517
(% of AGI for various income ranges: 47.7% for AGIs below $25k, 105.8% for AGIs $25k-50k, 297.4% for AGIs $50k-75k, 634.6% for AGIs $75k-100k, 1880.6% for AGIs $100k-200k, 28637.2% for AGIs over 200k)
Charity contributions: $26,594 (reported on 7.0% of returns)
Here:
$26,594
State:
$12,598
(% of AGI for various income ranges: 2.0% for AGIs below $25k, 11.1% for AGIs $25k-50k, 39.5% for AGIs $50k-75k, 78.4% for AGIs $75k-100k, 305.0% for AGIs $100k-200k, 15092.2% for AGIs over 200k)
Taxes paid: $8,659 (reported on 8.3% of returns)
90004:
$8,659
State:
$8,807
(% of AGI for various income ranges: 10.6% for AGIs below $25k, 21.3% for AGIs $25k-50k, 64.3% for AGIs $50k-75k, 175.4% for AGIs $75k-100k, 531.1% for AGIs $100k-200k, 3292.5% for AGIs over 200k)
Earned income credit: $1,679 (reported on 18.2% of returns)
Here:
$1,679
State:
$2,074
(% of AGI for various income ranges: 84.8% for AGIs below $25k, 55.5% for AGIs $25k-50k, 0.5% for AGIs $50k-75k)
Percentage of individuals using paid preparers for their 2020 taxes: 91.7%
Here:
92%
State:
92%
(% for various income ranges: 88.8% for AGIs below $25k, 92.6% for AGIs $25k-50k, 93.5% for AGIs $50k-75k, 94.1% for AGIs $75k-100k, 95.1% for AGIs $100k-200k, 96.2% for AGIs over 200k)
Averages for the 2012 tax year for zip code 90004, filed in 2013:
Average Adjusted Gross Income (AGI) in 2012: $59,994 (Individual Income Tax Returns)
Here:
$59,994
State:
$72,726
Salary/wage: $46,316 (reported on 80.0% of returns)
Here:
$46,316
State:
$59,079
(% of AGI for various income ranges: 73.8% for AGIs below $25k, 87.0% for AGIs $25k-50k, 84.4% for AGIs $50k-75k, 80.3% for AGIs $75k-100k, 70.8% for AGIs $100k-200k, 42.4% for AGIs over 200k)
Taxable interest for individuals: $3,925 (reported on 21.3% of returns)
This zip code:
$3,925
California:
$2,146
(% of AGI for various income ranges: 0.5% for AGIs below $25k, 0.4% for AGIs $25k-50k, 0.5% for AGIs $50k-75k, 0.6% for AGIs $75k-100k, 1.1% for AGIs $100k-200k, 2.2% for AGIs over 200k)
Ordinary dividends: $14,659 (reported on 10.8% of returns)
Here:
$14,659
State:
$9,308
(% of AGI for various income ranges: 0.7% for AGIs below $25k, 0.6% for AGIs $25k-50k, 0.9% for AGIs $50k-75k, 1.1% for AGIs $75k-100k, 2.4% for AGIs $100k-200k, 4.3% for AGIs over 200k)
Net capital gain/loss in AGI: +$35,679 (reported on 9.9% of returns)
Here:
+$35,679
State:
+$30,460
(% of AGI for various income ranges: 0.1% for AGIs $25k-50k, 0.3% for AGIs $50k-75k, 0.4% for AGIs $75k-100k, 1.7% for AGIs $100k-200k, 11.8% for AGIs over 200k)
Profit/loss from business: +$12,854 (reported on 26.7% of returns)
Here:
+$12,854
State:
+$17,064
(% of AGI for various income ranges: 19.9% for AGIs below $25k, 5.8% for AGIs $25k-50k, 3.9% for AGIs $50k-75k, 4.3% for AGIs $75k-100k, 5.7% for AGIs $100k-200k, 2.9% for AGIs over 200k)
Taxable individual retirement arrangement distribution: $22,052 (reported on 3.4% of returns)
90004:
$22,052
California:
$19,557
(% of AGI for various income ranges: 0.6% for AGIs below $25k, 0.6% for AGIs $25k-50k, 1.2% for AGIs $50k-75k, 1.7% for AGIs $75k-100k, 2.4% for AGIs $100k-200k, 1.3% for AGIs over 200k)
Self-employment retirement plans: $33,154 (reported on 0.9% of returns)
90004:
$33,154
California:
$24,530
(% of AGI for various income ranges: 0.3% for AGIs $50k-75k, 0.4% for AGIs $100k-200k, 0.9% for AGIs over 200k)
Total itemized deductions: $45,232 (23% of AGI, reported on 20.3% of returns)
Here:
$45,232
State:
$34,004
Here:
22.9% of AGI
State:
22.7% of AGI
(% of AGI for various income ranges: 5.2% for AGIs below $25k, 7.9% for AGIs $25k-50k, 12.4% for AGIs $50k-75k, 16.8% for AGIs $75k-100k, 21.1% for AGIs $100k-200k, 19.0% for AGIs over 200k)
Charity contributions: $9,516 (reported on 16.1% of returns)
Here:
$9,516
State:
$4,659
(% of AGI for various income ranges: 0.3% for AGIs below $25k, 0.7% for AGIs $25k-50k, 1.3% for AGIs $50k-75k, 1.8% for AGIs $75k-100k, 2.3% for AGIs $100k-200k, 4.0% for AGIs over 200k)
Taxes paid: $20,833 (reported on 20.2% of returns)
90004:
$20,833
State:
$14,448
(% of AGI for various income ranges: 0.8% for AGIs below $25k, 1.5% for AGIs $25k-50k, 3.1% for AGIs $50k-75k, 5.6% for AGIs $75k-100k, 8.0% for AGIs $100k-200k, 10.8% for AGIs over 200k)
Earned income credit: $2,073 (reported on 26.0% of returns)
Here:
$2,073
State:
$2,286
(% of AGI for various income ranges: 6.6% for AGIs below $25k, 1.1% for AGIs $25k-50k)
Percentage of individuals using paid preparers for their 2012 taxes: 74.2%
Here:
74%
State:
64%
(% for various income ranges: 74.7% for AGIs below $25k, 71.8% for AGIs $25k-50k, 69.5% for AGIs $50k-75k, 73.0% for AGIs $75k-100k, 79.1% for AGIs $100k-200k, 89.1% for AGIs over 200k)
Averages for the 2004 tax year for zip code 90004, filed in 2005:
Average Adjusted Gross Income (AGI) in 2004: $49,444 (Individual Income Tax Returns)
Here:
$49,444
State:
$58,600
Salary/wage: $39,007 (reported on 80.6% of returns)
Here:
$39,007
State:
$49,455
(% of AGI for various income ranges: 125.6% for AGIs below $10k, 82.9% for AGIs $10k-25k, 88.5% for AGIs $25k-50k, 81.6% for AGIs $50k-75k, 75.3% for AGIs $75k-100k, 46.0% for AGIs over 100k)
Taxable interest for individuals: $3,906 (reported on 27.6% of returns)
This zip code:
$3,906
California:
$2,365
(% of AGI for various income ranges: 7.0% for AGIs below $10k, 0.9% for AGIs $10k-25k, 0.9% for AGIs $25k-50k, 1.3% for AGIs $50k-75k, 1.8% for AGIs $75k-100k, 2.9% for AGIs over 100k)
Taxable dividends: $7,382 (reported on 12.6% of returns)
Here:
$7,382
State:
$4,746
(% of AGI for various income ranges: 4.4% for AGIs below $10k, 0.6% for AGIs $10k-25k, 0.6% for AGIs $25k-50k, 1.4% for AGIs $50k-75k, 1.9% for AGIs $75k-100k, 2.6% for AGIs over 100k)
Net capital gain/loss: +$38,232 (reported on 11.8% of returns)
Here:
+$38,232
State:
+$23,418
(% of AGI for various income ranges: 10.3% for AGIs below $10k, 0.2% for AGIs $10k-25k, 0.3% for AGIs $25k-50k, 1.0% for AGIs $50k-75k, 1.8% for AGIs $75k-100k, 15.9% for AGIs over 100k)
Profit/loss from business: +$12,920 (reported on 25.5% of returns)
Here:
+$12,920
State:
+$16,826
(% of AGI for various income ranges: 56.3% for AGIs below $10k, 12.6% for AGIs $10k-25k, 5.1% for AGIs $25k-50k, 5.0% for AGIs $50k-75k, 6.4% for AGIs $75k-100k, 4.9% for AGIs over 100k)
IRA payment deduction: $2,903 (reported on 2.4% of returns)
90004:
$2,903
California:
$3,192
(% of AGI for various income ranges: 0.3% for AGIs below $10k, 0.2% for AGIs $10k-25k, 0.3% for AGIs $25k-50k, 0.3% for AGIs $50k-75k, 0.2% for AGIs $75k-100k, 0.1% for AGIs over 100k)
Self-employed pension: $25,701 (reported on 1.2% of returns)
Here:
$25,701
California:
$17,688
(% of AGI for various income ranges: 0.1% for AGIs $25k-50k, 0.3% for AGIs $50k-75k, 0.4% for AGIs $75k-100k, 1.0% for AGIs over 100k)
Total itemized deductions: $37,261 (24% of AGI, reported on 21.9% of returns)
Here:
$37,261
State:
$28,113
Here:
24.2% of AGI
State:
25.3% of AGI
(% of AGI for various income ranges: 11.9% for AGIs below $10k, 6.1% for AGIs $10k-25k, 10.9% for AGIs $25k-50k, 17.7% for AGIs $50k-75k, 22.1% for AGIs $75k-100k, 20.0% for AGIs over 100k)
Charity contributions deductions: $10,870 (6% of AGI, reported on 18.8% of returns)
Here:
$10,870
State:
$3,923
Here:
6.4% of AGI
State:
3.3% of AGI
(% of AGI for various income ranges: 0.5% for AGIs below $10k, 0.5% for AGIs $10k-25k, 1.4% for AGIs $25k-50k, 2.4% for AGIs $50k-75k, 2.8% for AGIs $75k-100k, 6.3% for AGIs over 100k)
Total tax: $10,558 (reported on 70.6% of returns)
90004:
$10,558
State:
$10,761
(% of AGI for various income ranges: 11.4% for AGIs below $10k, 4.4% for AGIs $10k-25k, 6.5% for AGIs $25k-50k, 10.0% for AGIs $50k-75k, 11.9% for AGIs $75k-100k, 21.4% for AGIs over 100k)
Earned income credit: $1,771 (reported on 29.4% of returns)
Here:
$1,771
State:
$1,763
Percentage of individuals using paid preparers for their 2004 taxes: 76.4%
Here:
76%
State:
66%
(% for various income ranges: 74.3% for AGIs below $10k, 77.9% for AGIs $10k-25k, 74.1% for AGIs $25k-50k, 73.2% for AGIs $50k-75k, 78.7% for AGIs $75k-100k, 86.5% for AGIs over 100k)
Likely homosexual households (counted as self-reported same-sex unmarried-partner households)
Lesbian couples: 0.1% of all households
Gay men: 0.5% of all households
Household received Food Stamps/SNAP in the past 12 months: 4,196 Household did not receive Food Stamps/SNAP in the past 12 months: 19,513
Women who had a birth in the past 12 months: 550 (393 now married, 156 unmarried) Women who did not have a birth in the past 12 months: 15,150 (4,406 now married, 10,811 unmarried)
Housing units in zip code 90004 with a mortgage: 2,668 (417 second mortgage, 396 both second mortgage and home equity loan) Houses without a mortgage: 65
Median monthly owner costs for units with a mortgage: $3,876 Median monthly owner costs for units without a mortgage: $925
Residents with income below the poverty level in 2022:
This zip code:
19.4%
Whole state:
12.2%
Residents with income below 50% of the poverty level in 2022:
This zip code:
10.0%
Whole state:
6.2%
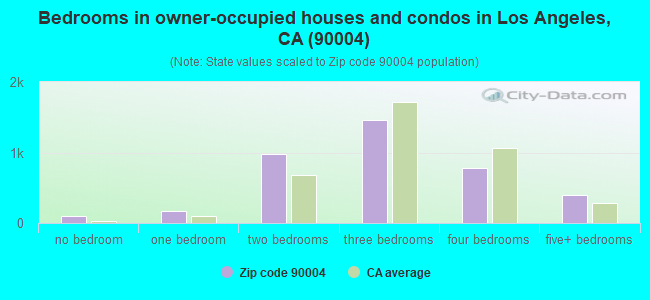
Median number of rooms in houses and condos:
Here:
6.0
State:
6.0
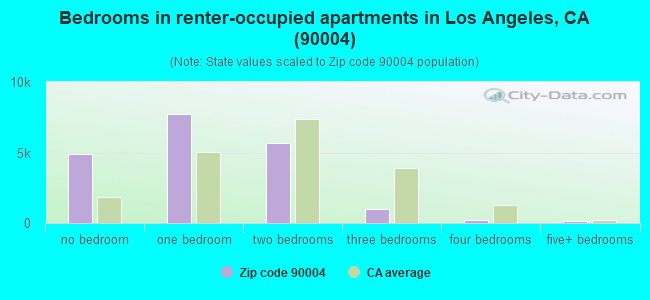
Median number of rooms in apartments:
Here:
3.0
State:
3.9
Notable locations in this zip code not listed on our city pages
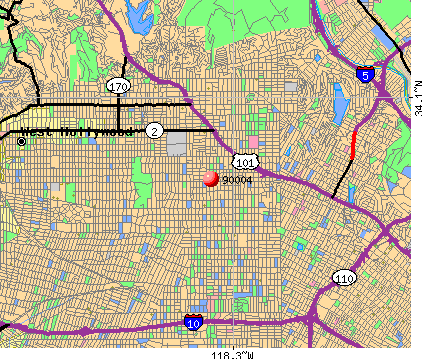
Notable locations in zip code 90004: Wilshire Country Club (A), Wilshire Branch Los Angeles Public Library (B), Schaefer Ambulance Service (C), City of Los Angeles Fire Department Station 6 (D). Display/hide their locations on the map
Churches in zip code 90004 include: Institute of Metaphysics (A), International Church of the Holy Trinity (B), Saint Kevins Catholic Church (C), Berean Baptist Church (D), Catholic Church of Christ the King (E), Christ Presbyterian Church (F), Hollywood Church of Christ (G), Rosewood Methodist Church (H), Trinity Episcopal Church (I). Display/hide their locations on the map
5,854 married couples with children.
3,326 single-parent households (707 men, 2,619 women).
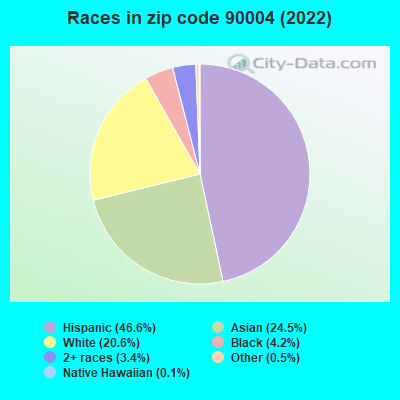
33.6% of residents of 90004 zip code speak English at home.
41.5% of residents speak Spanish at home (37% very well, 23% well, 30% not well, 10% not at all).
4.2% of residents speak other Indo-European language at home (61% very well, 27% well, 11% not well, 1% not at all).
20.3% of residents speak Asian or Pacific Island language at home (49% very well, 30% well, 17% not well, 5% not at all).
0.5% of residents speak other language at home (54% very well, 22% well, 20% not well, 5% not at all).
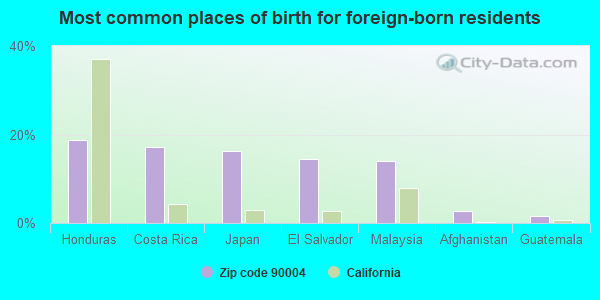
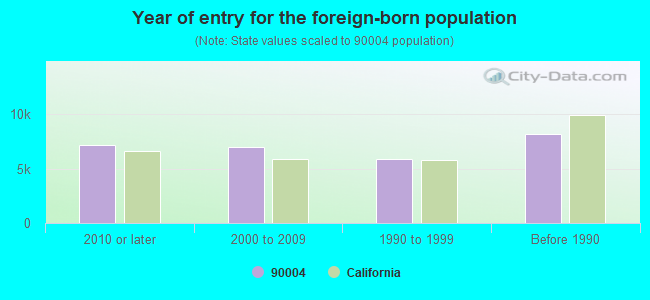
Foreign born population: 27,266 (46.7%) (42.4% of them are naturalized citizens)
Major facilities with environmental interests located in this zip code:
ALEXANDRIA NEW E S NO 1 (330 N HARVARD BLVD in LOS ANGELES, CA)
STATE MASTER (California - Hazardous Waste Tracking) - HAZARDOU WASTE PROGRAM Large Quantity Generators, more that 1000 kg of hazardous waste/month (Resource Conservation and Recovery Act (tracking hazardous waste)) - notification Organizations: LAUSD (CONTACT/OPERATOR)
CAHUENGA NEW E S NO 1 (225 S OXFORD AVE in LOS ANGELES, CA)
STATE MASTER (California - Hazardous Waste Tracking) - HAZARDOU WASTE PROGRAM Large Quantity Generators, more that 1000 kg of hazardous waste/month (Resource Conservation and Recovery Act (tracking hazardous waste)) - notification Organizations: LAUSD (CONTACT/OPERATOR)
LA USD CAHUENGA ELEM (220 S HOBART BLVD in LOS ANGELES, CA)
STATE MASTER (California - Hazardous Waste Tracking) - HAZARDOU WASTE PROGRAM Small Quantity Generators, between 100 kg and 1000 kg of hazardous waste/month (Resource Conservation and Recovery Act (tracking hazardous waste)) - notification Alternative names: CAHUENGA ELEMENTARY
LAUSD COMMONWEALTH ELEM SCHOOL (215 S COMMONWEALTH AVE in LOS ANGELES, CA)
STATE MASTER (California - Hazardous Waste Tracking) - HAZARDOU WASTE PROGRAM Small Quantity Generators, between 100 kg and 1000 kg of hazardous waste/month (Resource Conservation and Recovery Act (tracking hazardous waste)) - notification
LAUSD VAN NESS ELEM SCHOOL (501 N VAN NESS AVE in LOS ANGELES, CA)
STATE MASTER (California - Hazardous Waste Tracking) - HAZARDOU WASTE PROGRAM Small Quantity Generators, between 100 kg and 1000 kg of hazardous waste/month (Resource Conservation and Recovery Act (tracking hazardous waste)) - notification Alternative names: LAUSD/ VAN NESS AVE ELEM, VAN NESS AVENUE ELEMENTARY
LOS ANGELES USD ALEXANDRIA ELEM SCHOOL (4211 OAKWOOD AVE in LOS ANGELES, CA)
STATE MASTER (California - Hazardous Waste Tracking) - HAZARDOU WASTE PROGRAM Small Quantity Generators, between 100 kg and 1000 kg of hazardous waste/month (Resource Conservation and Recovery Act (tracking hazardous waste)) - notification Organizations: LOS ANGELES UNIFIED SCHOOL DISTRICT (CONTACT/OWNER)
Alternative names: ALEXANDRIA AVENUE ELEMENTARY, LAUSD/ ALEXANDRIA AVE ELEM
LOS ANGELES USD BLEND FRANCES SCHOOL (5210 CLINTON ST in LOS ANGELES, CA)
STATE MASTER (California - Hazardous Waste Tracking) - HAZARDOU WASTE PROGRAM Small Quantity Generators, between 100 kg and 1000 kg of hazardous waste/month (Resource Conservation and Recovery Act (tracking hazardous waste)) - notification Organizations: LOS ANGELES UNIFIED SCHOOL DISTRICT (CONTACT/OWNER)
Alternative names: BLEND (FRANCES) SPECIAL ED. CENTER, LAUSD/ BLEND SPEC ED
LOS ANGELES USD VIRGIL JR HG SCH (152 N VERMONT AVE in LOS ANGELES, CA)
STATE MASTER (California - Hazardous Waste Tracking) - HAZARDOU WASTE PROGRAM Small Quantity Generators, between 100 kg and 1000 kg of hazardous waste/month (Resource Conservation and Recovery Act (tracking hazardous waste)) - notification Organizations: LOS ANGELES UNIFIED SCHOOL DISTRICT (CONTACT/OWNER)
Alternative names: LAUSD/ VIRGIL JR HG SCH
EXXON MOBIL OIL CORP NO 12123 (655 N WESTERN AVE in LOS ANGELES, CA)
Large Quantity Generators, more that 1000 kg of hazardous waste/month (Resource Conservation and Recovery Act (tracking hazardous waste)) Organizations: FARHAD ARYA (CONTACT/OPERATOR)
GORE GRAPHICS (340 N MADISON AVE in LOS ANGELES, CA)
CRITERIA AND HAZARDOUS AIR POLLUTANT INVENTORY (Inventory of air pollution sources) (Resource Conservation and Recovery Act (tracking hazardous waste)) TRI REPORTER (Tracking of toxic chemicals releasing facilities) Business SIC classification: COMMERCIAL PRINTING, LITHOGRAPHIC Business NAICS classification: COMMERCIAL LITHOGRAPHIC PRINTING.
EXXON MOBIL OIL CORP (4605 BEVERLY BLVD in LOS ANGELES, CA)
HAZARDOUS WASTE BIENNIAL REPORTER (Resource Conservation and Recovery Act (tracking hazardous waste)) Large Quantity Generators, more that 1000 kg of hazardous waste/month (Resource Conservation and Recovery Act (tracking hazardous waste))
FRANKS AUTOSPA CARWASH (655 NO. VIRGIL in LOS ANGELES, CA)
Small Quantity Generators, between 100 kg and 1000 kg of hazardous waste/month (Resource Conservation and Recovery Act (tracking hazardous waste)) Organizations: IANNONE FRANCIS J. (CONTACT/OWNER)
INSURANCE COLLISION CENTER (3415 W 2ND ST in LOS ANGELES, CA)
Small Quantity Generators, between 100 kg and 1000 kg of hazardous waste/month (Resource Conservation and Recovery Act (tracking hazardous waste)) Organizations: MAGRI GINAI TRUST (CONTACT/OWNER)
Housing units lacking complete plumbing facilities: 0.7% Housing units lacking complete kitchen facilities: 2.0%
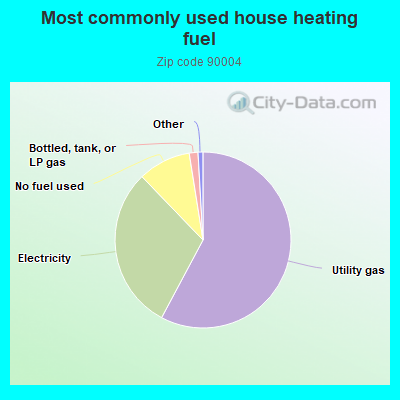
57.8%Utility gas
30.0%Electricity
9.7%No fuel used
1.6%Bottled, tank, or LP gas
Population in 1990: 64,062. Population change in the 1990s: +3,788 (+5.9%).
Place of birth for U.S.-born residents:
This state: 21,185
Northeast: 3,275
Midwest: 2,279
South: 2,358
West: 1,279
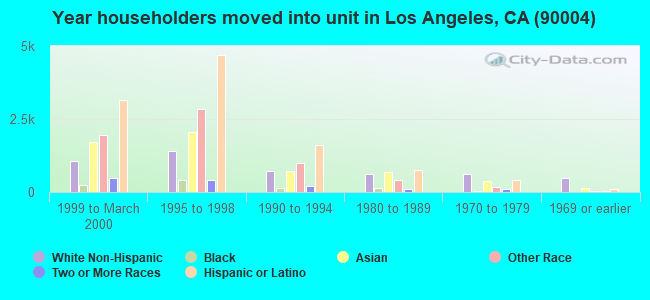
49% of the 90004 zip code residents lived in the same house 5 years ago. Out of people who lived in different houses, 88% lived in this county. Out of people who lived in different counties, 50% lived in California.
91% of the 90004 zip code residents lived in the same house 1 year ago. Out of people who lived in different houses, 70% moved from this county. Out of people who lived in different houses, 7% moved from different county within same state. Out of people who lived in different houses, 16% moved from different state. Out of people who lived in different houses, 6% moved from abroad.
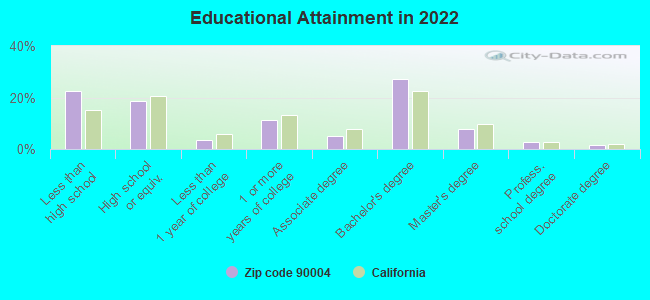
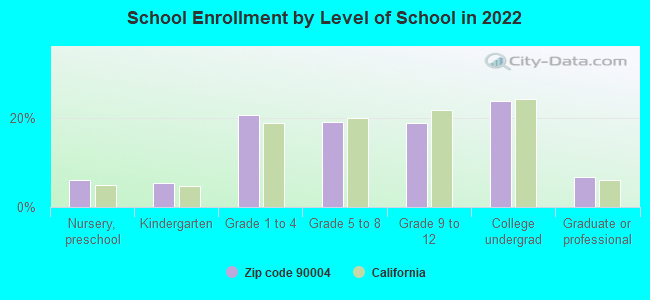
Private vs. public school enrollment:
Students in private schools in grades 1 to 8 (elementary and middle school): 481
Here:
10.2%
California:
10.5%
Students in private schools in grades 9 to 12 (high school): 455
Here:
20.3%
California:
8.5%
Students in private undergraduate colleges: 540
Here:
19.0%
California:
15.9%
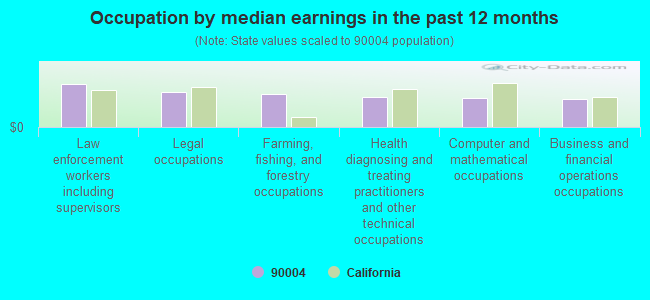
Occupation by median earnings in the past 12 months ($)
123,757Law enforcement workers including supervisors
100,676Legal occupations
97,056Farming, fishing, and forestry occupations
86,164Health diagnosing and treating practitioners and other technical occupations
85,182Computer and mathematical occupations
80,469Business and financial operations occupations
Companies with federal contracts located in this zip code (LOS ANGELES, CA):
RDG,INC (589 N LARCHMONT BLVD; small business) : $55,452 in 7 contractsfrom 2001 to 2004
Contracts for Musical Instruments, Miscellaneous Items by Army Signed by year:2000: $0; 2001: $11,700; 2002: $11,580; 2003: $0; 2004: $32,172; 2005: $0; 2006: $0.
Biggest contracts:
$14,300 with Army for Musical Instruments. Taking place in MD. Signed on 2004-08-26. Completion date: 2004-12-15.
$11,700 with Army for Musical Instruments. Taking place in VA. Signed on 2001-06-29. Completion date: 2001-07-16.
$11,500 with Army for Miscellaneous Items. Taking place in MD. Signed on 2002-09-17. Completion date: 2002-10-03.
$10,850 with Army for Musical Instruments. Taking place in MD. Signed on 2004-09-22. Completion date: 2004-10-15.
RDG WOODWINDS INC (589 N LARCHMONT BLVD 2ND; small business) : $13,225 in 2 contractsin 2005
$7,175 with Army for Musical Instruments. Signed on 2005-08-31. Completion date: 2005-09-15.
$6,050 with Army for Musical Instruments. Taking place in MD. Signed on 2005-09-29. Completion date: 2005-10-21.
CRESSNER & ASSOCIATES INC (236 N ARDEN BLVD; small business)
$8,500 with Army for Real Property Appraisals Services (SIC 6531). Signed on 2004-01-14. Completion date: 2004-02-17.
MOBILE TACTICAL SUPPLY (269 S LUCERNE; small business)
$4,832 with Army for Athletic and Sporting Equipment. Signed on 2004-08-03. Completion date: 2004-07-01.
Top industries in this zip code by the number of employees in 2005:
2005 - 2018 National Fire Incident Reporting System (NFIRS) incidents
According to the data from the years 2005 - 2018 the average number of fires per year is 150. The highest number of fire incidents - 286 took place in 2017, and the least - 91 in 2012. The data has an increasing trend.
When looking into fire subcategories, the most incidents belonged to: Structure Fires (48.1%), and Outside Fires (34.9%).
Fire incident types reported to NFIRS in Zip Code 90004


 Nearest zip codes: 90020, 90010, 90005, 90038, 90029, 90028.


 According to the data from the years 2005 - 2018 the average number of fires per year is 150. The highest number of fire incidents - 286 took place in 2017, and the least - 91 in 2012. The data has an increasing trend.
 When looking into fire subcategories, the most incidents belonged to: Structure Fires (48.1%), and Outside Fires (34.9%).