Estimated zip code population in 2022: 17,228 Zip code population in 2010: 15,448 Zip code population in 2000: 2,601
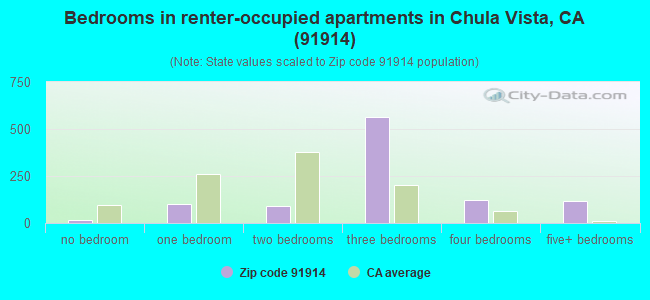
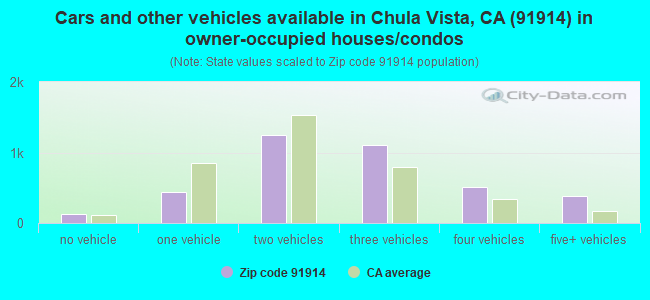
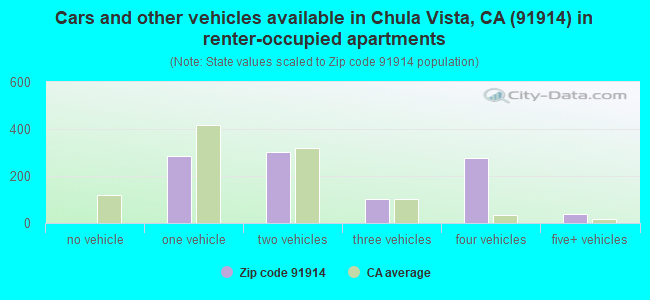
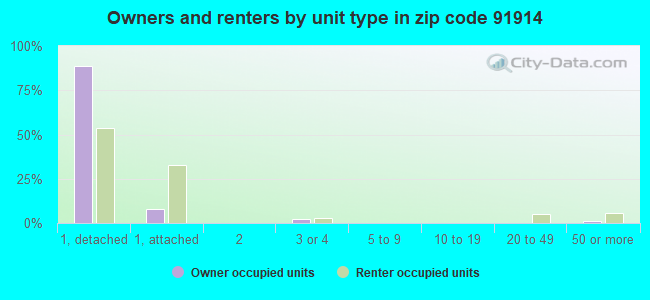
Houses and condos: 4,918 Renter-occupied apartments: 1,008
% of renters here:
21%
State:
44%
March 2022 cost of living index in zip code 91914: 122.4 (high, U.S. average is 100)
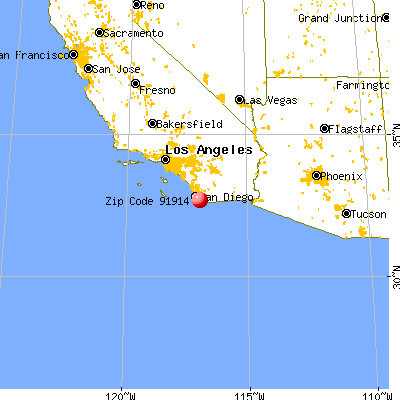
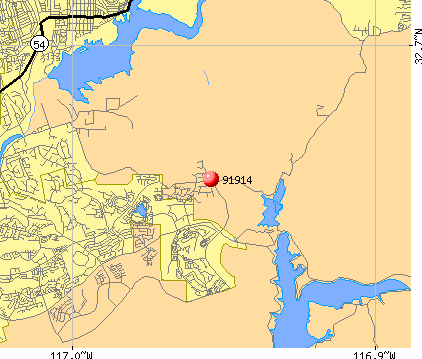
Land area: 6.3 sq. mi. Water area: 0.1 sq. mi.
Population density: 2,737 people per square mile
(average).
OSM Map
General Map
Google Map
MSN Map
OSM Map
General Map
Google Map
MSN Map
OSM Map
General Map
Google Map
MSN Map
OSM Map
General Map
Google Map
MSN Map
Please wait while loading the map...
Real estate property taxes paid for housing units in 2022:
This zip code:
0.9% ($8,185)
California:
0.7% ($4,831)
Median real estate property taxes paid for housing units with mortgages in 2022: $8,182 (0.9%) Median real estate property taxes paid for housing units with no mortgage in 2022: $8,600 (0.9%)
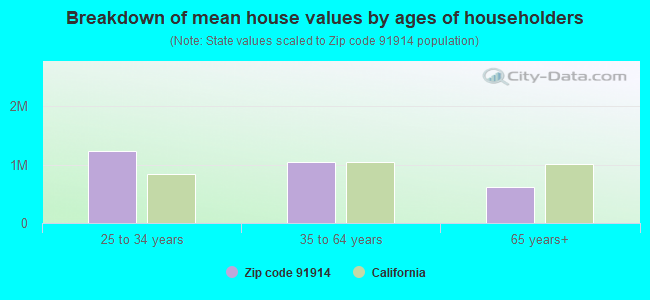
Estimated median house/condo value in 2022: $940,236
91914:
$940,236
California:
$715,900
According to our research of California and other state lists, there were 5 registered sex offenders living in 91914 zip code as of April 26, 2024. The ratio of all residents to sex offenders in zip code 91914 is 3,421 to 1. The ratio of registered sex offenders to all residents in this zip code is much lower than the state average.
Median resident age:
This zip code:
38.1 years
California median age:
37.9 years
Average household size:
This zip code:
3.6 people
California:
2.8 people
Averages for the 2020 tax year for zip code 91914, filed in 2021:
Average Adjusted Gross Income (AGI) in 2020: $114,276 (Individual Income Tax Returns)
Here:
$114,276
State:
$95,910
Salary/wage: $95,427 (reported on 83.0% of returns)
Here:
$95,427
State:
$77,331
(% of AGI for various income ranges: 1114.4% for AGIs below $25k, 3808.2% for AGIs $25k-50k, 6825.7% for AGIs $50k-75k, 10772.7% for AGIs $75k-100k, 22358.5% for AGIs $100k-200k, 81215.9% for AGIs over 200k)
Taxable interest for individuals: $1,018 (reported on 47.3% of returns)
This zip code:
$1,018
California:
$2,294
(% of AGI for various income ranges: 10.5% for AGIs below $25k, 19.2% for AGIs $25k-50k, 48.5% for AGIs $50k-75k, 95.3% for AGIs $75k-100k, 110.4% for AGIs $100k-200k, 507.6% for AGIs over 200k)
Ordinary dividends: $5,258 (reported on 20.3% of returns)
Here:
$5,258
State:
$10,949
(% of AGI for various income ranges: 13.3% for AGIs below $25k, 25.2% for AGIs $25k-50k, 51.2% for AGIs $50k-75k, 118.2% for AGIs $75k-100k, 112.3% for AGIs $100k-200k, 1807.4% for AGIs over 200k)
Net capital gain/loss in AGI: +$23,704 (reported on 19.8% of returns)
Here:
+$23,704
State:
+$49,306
(% of AGI for various income ranges: 13.2% for AGIs below $25k, 59.3% for AGIs $25k-50k, 95.0% for AGIs $50k-75k, 184.4% for AGIs $75k-100k, 407.4% for AGIs $100k-200k, 9184.7% for AGIs over 200k)
Profit/loss from business: +$12,103 (reported on 17.9% of returns)
Here:
+$12,103
State:
+$15,671
(% of AGI for various income ranges: 138.0% for AGIs below $25k, 181.2% for AGIs $25k-50k, 247.7% for AGIs $50k-75k, 272.7% for AGIs $75k-100k, 480.6% for AGIs $100k-200k, 1855.0% for AGIs over 200k)
Taxable individual retirement arrangement distribution: $23,345 (reported on 5.3% of returns)
91914:
$23,345
California:
$23,505
(% of AGI for various income ranges: 17.5% for AGIs below $25k, 52.5% for AGIs $25k-50k, 139.2% for AGIs $50k-75k, 222.2% for AGIs $75k-100k, 419.7% for AGIs $100k-200k, 960.0% for AGIs over 200k)
Self-employed (Keogh) retirement plans: $23,883 (reported on 0.8% of returns)
91914:
$23,883
California:
$30,163
(% of AGI for various income ranges: 79.6% for AGIs $75k-100k, 316.2% for AGIs over 200k)
Total itemized deductions: $36,015 (reported on 30.4% of returns)
Here:
$36,015
State:
$39,517
(% of AGI for various income ranges: 76.9% for AGIs below $25k, 286.1% for AGIs $25k-50k, 816.5% for AGIs $50k-75k, 1708.0% for AGIs $75k-100k, 3605.5% for AGIs $100k-200k, 10677.9% for AGIs over 200k)
Charity contributions: $6,303 (reported on 25.9% of returns)
Here:
$6,303
State:
$12,598
(% of AGI for various income ranges: 4.2% for AGIs below $25k, 26.6% for AGIs $25k-50k, 79.0% for AGIs $50k-75k, 178.7% for AGIs $75k-100k, 468.4% for AGIs $100k-200k, 2028.5% for AGIs over 200k)
Taxes paid: $9,459 (reported on 30.4% of returns)
91914:
$9,459
State:
$8,807
(% of AGI for various income ranges: 19.6% for AGIs below $25k, 67.1% for AGIs $25k-50k, 253.2% for AGIs $50k-75k, 517.6% for AGIs $75k-100k, 1047.9% for AGIs $100k-200k, 2386.8% for AGIs over 200k)
Earned income credit: $1,800 (reported on 8.7% of returns)
Here:
$1,800
State:
$2,074
(% of AGI for various income ranges: 53.1% for AGIs below $25k, 53.7% for AGIs $25k-50k)
Percentage of individuals using paid preparers for their 2020 taxes: 93.6%
Here:
94%
State:
92%
(% for various income ranges: 91.8% for AGIs below $25k, 94.3% for AGIs $25k-50k, 93.1% for AGIs $50k-75k, 94.5% for AGIs $75k-100k, 94.2% for AGIs $100k-200k, 94.7% for AGIs over 200k)
Averages for the 2012 tax year for zip code 91914, filed in 2013:
Average Adjusted Gross Income (AGI) in 2012: $94,911 (Individual Income Tax Returns)
Here:
$94,911
State:
$72,726
Salary/wage: $82,643 (reported on 87.3% of returns)
Here:
$82,643
State:
$59,079
(% of AGI for various income ranges: 78.3% for AGIs below $25k, 81.9% for AGIs $25k-50k, 82.0% for AGIs $50k-75k, 81.6% for AGIs $75k-100k, 83.8% for AGIs $100k-200k, 62.2% for AGIs over 200k)
Taxable interest for individuals: $805 (reported on 48.5% of returns)
This zip code:
$805
California:
$2,146
(% of AGI for various income ranges: 0.7% for AGIs below $25k, 0.5% for AGIs $25k-50k, 0.4% for AGIs $50k-75k, 0.5% for AGIs $75k-100k, 0.3% for AGIs $100k-200k, 0.4% for AGIs over 200k)
Ordinary dividends: $7,543 (reported on 17.6% of returns)
Here:
$7,543
State:
$9,308
(% of AGI for various income ranges: 0.6% for AGIs below $25k, 0.6% for AGIs $25k-50k, 0.7% for AGIs $50k-75k, 0.5% for AGIs $75k-100k, 0.5% for AGIs $100k-200k, 3.2% for AGIs over 200k)
Net capital gain/loss in AGI: +$9,826 (reported on 16.8% of returns)
Here:
+$9,826
State:
+$30,460
(% of AGI for various income ranges: 0.1% for AGIs below $25k, 0.4% for AGIs $75k-100k, 0.5% for AGIs $100k-200k, 4.5% for AGIs over 200k)
Profit/loss from business: +$20,001 (reported on 18.1% of returns)
Here:
+$20,001
State:
+$17,064
(% of AGI for various income ranges: 15.2% for AGIs below $25k, 6.5% for AGIs $25k-50k, 4.0% for AGIs $50k-75k, 2.7% for AGIs $75k-100k, 2.3% for AGIs $100k-200k, 4.3% for AGIs over 200k)
Taxable individual retirement arrangement distribution: $18,963 (reported on 5.4% of returns)
91914:
$18,963
California:
$19,557
(% of AGI for various income ranges: 0.8% for AGIs below $25k, 0.8% for AGIs $25k-50k, 1.3% for AGIs $50k-75k, 1.3% for AGIs $75k-100k, 1.1% for AGIs $100k-200k, 0.9% for AGIs over 200k)
Self-employment retirement plans: $21,880 (reported on 0.8% of returns)
91914:
$21,880
California:
$24,530
(% of AGI for various income ranges: 0.6% for AGIs $50k-75k, 0.4% for AGIs over 200k)
Total itemized deductions: $36,596 (26% of AGI, reported on 56.2% of returns)
Here:
$36,596
State:
$34,004
Here:
25.6% of AGI
State:
22.7% of AGI
(% of AGI for various income ranges: 16.0% for AGIs below $25k, 16.7% for AGIs $25k-50k, 22.4% for AGIs $50k-75k, 23.9% for AGIs $75k-100k, 24.3% for AGIs $100k-200k, 19.1% for AGIs over 200k)
Charity contributions: $3,282 (reported on 46.9% of returns)
Here:
$3,282
State:
$4,659
(% of AGI for various income ranges: 0.7% for AGIs below $25k, 1.0% for AGIs $25k-50k, 1.3% for AGIs $50k-75k, 1.8% for AGIs $75k-100k, 1.8% for AGIs $100k-200k, 1.7% for AGIs over 200k)
Taxes paid: $14,263 (reported on 56.2% of returns)
91914:
$14,263
State:
$14,448
(% of AGI for various income ranges: 3.9% for AGIs below $25k, 4.7% for AGIs $25k-50k, 6.7% for AGIs $50k-75k, 7.9% for AGIs $75k-100k, 9.0% for AGIs $100k-200k, 9.5% for AGIs over 200k)
Earned income credit: $2,203 (reported on 10.4% of returns)
Here:
$2,203
State:
$2,286
(% of AGI for various income ranges: 5.5% for AGIs below $25k, 1.1% for AGIs $25k-50k)
Percentage of individuals using paid preparers for their 2012 taxes: 65.5%
Here:
66%
State:
64%
(% for various income ranges: 59.9% for AGIs below $25k, 58.6% for AGIs $25k-50k, 64.6% for AGIs $50k-75k, 68.4% for AGIs $75k-100k, 70.8% for AGIs $100k-200k, 75.9% for AGIs over 200k)
Averages for the 2004 tax year for zip code 91914, filed in 2005:
Average Adjusted Gross Income (AGI) in 2004: $73,728 (Individual Income Tax Returns)
Here:
$73,728
State:
$58,600
Salary/wage: $69,330 (reported on 90.4% of returns)
Here:
$69,330
State:
$49,455
(% of AGI for various income ranges: 216.6% for AGIs below $10k, 80.1% for AGIs $10k-25k, 87.6% for AGIs $25k-50k, 89.6% for AGIs $50k-75k, 90.4% for AGIs $75k-100k, 80.9% for AGIs over 100k)
Taxable interest for individuals: $683 (reported on 64.0% of returns)
This zip code:
$683
California:
$2,365
(% of AGI for various income ranges: 6.7% for AGIs below $10k, 1.3% for AGIs $10k-25k, 0.6% for AGIs $25k-50k, 0.6% for AGIs $50k-75k, 0.5% for AGIs $75k-100k, 0.5% for AGIs over 100k)
Taxable dividends: $1,056 (reported on 20.7% of returns)
Here:
$1,056
State:
$4,746
(% of AGI for various income ranges: 2.9% for AGIs below $10k, 1.0% for AGIs $10k-25k, 0.2% for AGIs $25k-50k, 0.3% for AGIs $50k-75k, 0.2% for AGIs $75k-100k, 0.3% for AGIs over 100k)
Net capital gain/loss: +$10,670 (reported on 19.6% of returns)
Here:
+$10,670
State:
+$23,418
(% of AGI for various income ranges: -3.2% for AGIs below $10k, -0.4% for AGIs $10k-25k, -0.3% for AGIs $25k-50k, 0.1% for AGIs $50k-75k, 1.3% for AGIs $75k-100k, 4.7% for AGIs over 100k)
Profit/loss from business: +$20,930 (reported on 18.8% of returns)
Here:
+$20,930
State:
+$16,826
(% of AGI for various income ranges: 2.4% for AGIs below $10k, 8.7% for AGIs $10k-25k, 7.7% for AGIs $25k-50k, 4.9% for AGIs $50k-75k, 2.7% for AGIs $75k-100k, 5.9% for AGIs over 100k)
IRA payment deduction: $2,926 (reported on 2.8% of returns)
91914:
$2,926
California:
$3,192
(% of AGI for various income ranges: 2.0% for AGIs below $10k, 0.2% for AGIs $25k-50k, 0.2% for AGIs $50k-75k, 0.1% for AGIs $75k-100k, 0.1% for AGIs over 100k)
Self-employed pension: $15,453 (reported on 1.2% of returns)
Here:
$15,453
California:
$17,688
Total itemized deductions: $33,340 (33% of AGI, reported on 66.6% of returns)
Here:
$33,340
State:
$28,113
Here:
33.5% of AGI
State:
25.3% of AGI
(% of AGI for various income ranges: 52.4% for AGIs below $10k, 20.3% for AGIs $10k-25k, 31.2% for AGIs $25k-50k, 37.4% for AGIs $50k-75k, 34.9% for AGIs $75k-100k, 26.8% for AGIs over 100k)
Charity contributions deductions: $2,839 (3% of AGI, reported on 58.6% of returns)
Here:
$2,839
State:
$3,923
Here:
2.8% of AGI
State:
3.3% of AGI
(% of AGI for various income ranges: 1.2% for AGIs below $10k, 1.7% for AGIs $10k-25k, 1.7% for AGIs $25k-50k, 2.5% for AGIs $50k-75k, 2.5% for AGIs $75k-100k, 2.2% for AGIs over 100k)
Total tax: $9,190 (reported on 81.9% of returns)
91914:
$9,190
State:
$10,761
(% of AGI for various income ranges: 8.1% for AGIs below $10k, 4.8% for AGIs $10k-25k, 5.9% for AGIs $25k-50k, 5.8% for AGIs $50k-75k, 6.7% for AGIs $75k-100k, 13.5% for AGIs over 100k)
Earned income credit: $1,543 (reported on 6.7% of returns)
Here:
$1,543
State:
$1,763
Percentage of individuals using paid preparers for their 2004 taxes: 69.0%
Here:
69%
State:
66%
(% for various income ranges: 56.6% for AGIs below $10k, 63.6% for AGIs $10k-25k, 70.2% for AGIs $25k-50k, 73.2% for AGIs $50k-75k, 70.3% for AGIs $75k-100k, 73.2% for AGIs over 100k)
Household received Food Stamps/SNAP in the past 12 months: 223 Household did not receive Food Stamps/SNAP in the past 12 months: 4,526
Women who had a birth in the past 12 months: 168 (138 now married, 30 unmarried) Women who did not have a birth in the past 12 months: 3,972 (2,091 now married, 1,860 unmarried)
Housing units in zip code 91914 with a mortgage: 3,199 (340 second mortgage, 30 home equity loan, 224 both second mortgage and home equity loan) Houses without a mortgage: 4
Median monthly owner costs for units with a mortgage: $3,380 Median monthly owner costs for units without a mortgage: $1,163
Residents with income below the poverty level in 2022:
This zip code:
3.4%
Whole state:
12.2%
Residents with income below 50% of the poverty level in 2022:
This zip code:
1.3%
Whole state:
6.2%
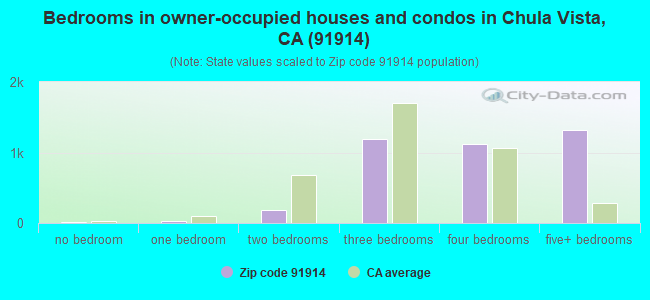
Median number of rooms in houses and condos:
Here:
7.5
State:
6.0
Median number of rooms in apartments:
Here:
5.0
State:
3.9
Notable locations in this zip code not listed on our city pages
Notable locations in zip code 91914: Rancho del Otay (A), Chula Vista Fire Department Station 6 (B), Chula Vista Fire Department Station 8 (C). Display/hide their locations on the map
Churches in zip code 91914 include: New Hope Community Church (A), Eastlake Community Church of Chula Vista (B), Berean Bible Baptist Church (C). Display/hide their locations on the map
In group quarters: 62 (-1 institutionalized population)
Size of family households: 798 2-persons, 873 3-persons, 1,489 4-persons, 608 5-persons, 309 6-persons, 77 7-or-more-persons
Size of nonfamily households: 567 1-person, 29 2-persons
3,457 married couples with children.
433 single-parent households (128 men, 305 women).
50.4% of residents of 91914 zip code speak English at home.
37.1% of residents speak Spanish at home (79% very well, 15% well, 5% not well).
1.4% of residents speak other Indo-European language at home (27% very well, 51% well, 4% not well, 18% not at all).
10.8% of residents speak Asian or Pacific Island language at home (66% very well, 29% well, 4% not well).
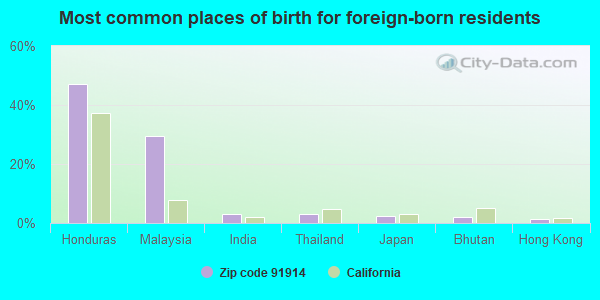
Foreign born population: 4,268 (24.8%) (81.0% of them are naturalized citizens)
18% of the 91914 zip code residents lived in the same house 5 years ago. Out of people who lived in different houses, 77% lived in this county. Out of people who lived in different counties, 50% lived in California.
94% of the 91914 zip code residents lived in the same house 1 year ago. Out of people who lived in different houses, 65% moved from this county. Out of people who lived in different houses, 24% moved from different county within same state. Out of people who lived in different houses, 3% moved from different state. Out of people who lived in different houses, 12% moved from abroad.
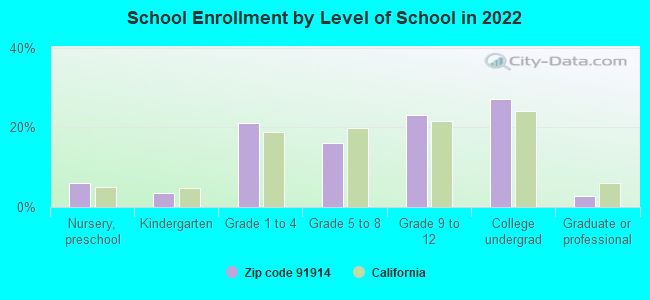
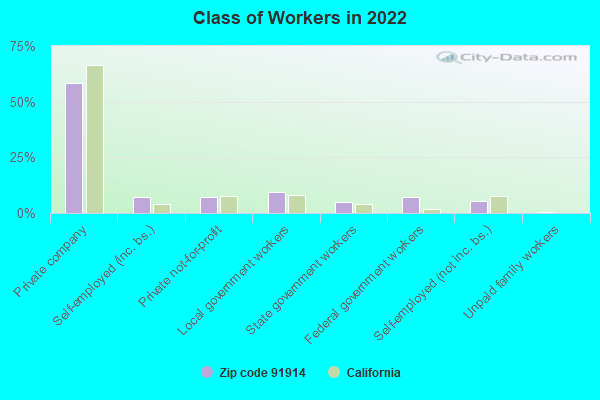
Private vs. public school enrollment:
Students in private schools in grades 1 to 8 (elementary and middle school): 299
Here:
15.3%
California:
10.5%
Students in private schools in grades 9 to 12 (high school): 211
Here:
17.6%
California:
8.5%
Students in private undergraduate colleges: 148
Here:
10.5%
California:
15.9%
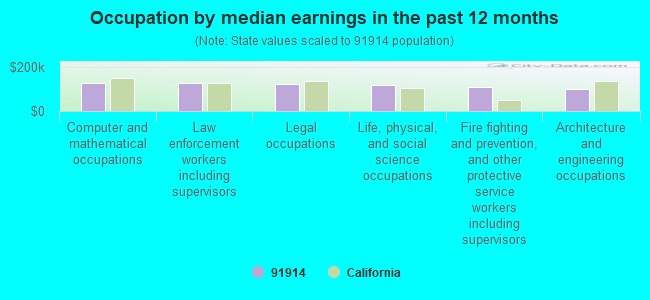
Occupation by median earnings in the past 12 months ($)
129,057Computer and mathematical occupations
128,914Law enforcement workers including supervisors
124,609Legal occupations
119,671Life, physical, and social science occupations
108,526Fire fighting and prevention, and other protective service workers including supervisors
101,105Architecture and engineering occupations
Companies with federal contracts located in this zip code (CHULA VISTA, CA):
ACTIVITY RESEARCH SERVICES (2608 SANTA MARIA CT; small business) : $1,619,858 in 10 contractsfrom 2001 to 2005
Contracts for Biomedical -- Basic Research (R&D), Other Medical -- Operational Systems Development (R&D), Programming Services by Army Signed by year:2000: $0; 2001: $100,000; 2002: $115,150; 2003: $567,530; 2004: $447,179; 2005: $389,999; 2006: $0.
Biggest contracts:
$389,999 with Army for Biomedical -- Basic Research (R&D). Signed on 2005-10-05. Completion date: 2005-02-08.
$351,765 with Army for Other Medical -- Operational Systems Development (R&D). Signed on 2003-11-12. Completion date: 2005-11-11.
$348,096, same as above.Signed on 2004-11-30. Completion date: 2005-11-11.
$185,000 with Army for Programming Services. Signed on 2003-03-18. Completion date: 2004-09-30.
PROCEDURAL CODERS INSTITUTE (2400 FENTON STREET, SUITE; small business) : $116,200 in 2 contractsfrom 2002 to 2004
$85,000 with Air Force for Other Education and Training Services. Signed on 2002-09-27. Completion date: 2002-02-28.
$31,200 with Air Force for Training/Curriculum Development. Signed on 2004-07-01. Completion date: 2004-09-03.
W & O SUPPLY INC (2390 BOSWELL ROAD; small business) : $41,057 in 2 contractsfrom 2002 to 2005
$37,147 with Navy for Hose, Pipe, Tube, Lubrication, and Railing Fittings. Signed on 2002-04-02. Completion date: 2002-05-17.
$3,910 with Navy for Valves, Powered. Signed on 2005-02-02. Completion date: 2005-02-24.
EMULSIONS CONTROL INC (925 HALE PLACE SUIITE A-7; small business) : $20,974 in 6 contractsin 2005
Contracts for Paints, Dopes, Varnishes, and Related Products, Miscellaneous Chemical Specialties by Navy Signed by year:2000: $0; 2001: $0; 2002: $0; 2003: $0; 2004: $0; 2005: $20,974; 2006: $0.
Biggest contracts:
$8,553 with Navy for Paints, Dopes, Varnishes, and Related Products. Signed on 2005-08-11. Completion date: 2005-08-31.
$4,854, same as above.Signed on 2005-07-12. Completion date: 2005-07-22.
$3,741 with Navy for Miscellaneous Chemical Specialties. Signed on 2005-06-24. Completion date: 2005-07-18.
$1,707, same as above.Signed on 2005-03-03. Completion date: 2005-03-31.
RETAIL SYSTEMS INTERNATIONAL, (901 LANE AVENUE; small business) : $17,815 in 2 contractsfrom 2002 to 2003
$11,508 with Federal Technology Service for ADP Input/Output and Storage Devices. Signed on 2002-10-15. Completion date: 2002-11-15.
$6,307 with Army for ADP Input/Output and Storage Devices. Signed on 2003-09-29. Completion date: 2003-11-14.
Top industries in this zip code by the number of employees in 2005:
Professional, Scientific, and Technical Services: Marketing Research and Public Opinion Polling (500-999 employees: 1 establishment)
Other Services (except Public Administration): Religious Organizations (100-249: 1, 5-9: 1)
Finance and Insurance: Credit Unions (100-249: 1)
Management of Companies and Enterprises: Corporate, Subsidiary, and Regional Managing Offices (100-249: 1)
Wholesale Trade: Computer and Computer Peripheral Equipment and Software Merchant Wholesalers (50-99: 1, 1-4: 1)
Utilities: Water Supply and Irrigation Systems (50-99: 1, 1-4: 1)
Fatal accident statistics in 2012:
Fatal accident count: 2
Vehicles involved in fatal accidents: 2
Fatal accidents caused by drunken drivers: 1
Fatalities: 3
Persons involved in fatal accidents: 5
Pedestrians involved in fatal accidents: 0
Home Mortgage Disclosure Act Aggregated Statistics For Year 2009 (Based on 4 partial tracts)
A) FHA, FSA/RHS & VA Home Purchase Loans
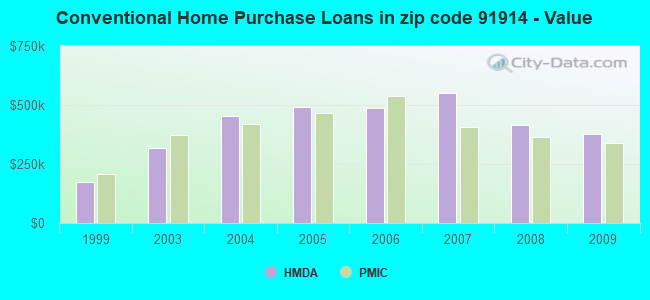
B) Conventional Home Purchase Loans
C) Refinancings
D) Home Improvement Loans
F) Non-occupant Loans on < 5 Family Dwellings (A B C & D)
G) Loans On Manufactured Home Dwelling (A B C & D)
Number
Average Value
Number
Average Value
Number
Average Value
Number
Average Value
Number
Average Value
Number
Average Value
LOANS ORIGINATED
108
$394,937
183
$375,084
315
$352,259
7
$265,623
44
$311,696
2
$270,460
APPLICATIONS APPROVED, NOT ACCEPTED
12
$430,863
29
$419,207
39
$352,579
0
$0
10
$367,462
0
$0
APPLICATIONS DENIED
26
$437,831
44
$377,656
116
$401,676
2
$142,125
13
$254,999
1
$144,060
APPLICATIONS WITHDRAWN
28
$408,833
29
$357,589
77
$354,269
2
$18,700
7
$285,953
1
$205,700
FILES CLOSED FOR INCOMPLETENESS
4
$401,758
3
$676,440
20
$391,096
1
$27,700
0
$0
0
$0
Aggregated Statistics For Year 2008 (Based on 4 partial tracts)
A) FHA, FSA/RHS & VA Home Purchase Loans
B) Conventional Home Purchase Loans
C) Refinancings
D) Home Improvement Loans
F) Non-occupant Loans on < 5 Family Dwellings (A B C & D)
G) Loans On Manufactured Home Dwelling (A B C & D)
Number
Average Value
Number
Average Value
Number
Average Value
Number
Average Value
Number
Average Value
Number
Average Value
LOANS ORIGINATED
61
$422,253
205
$413,887
136
$378,039
5
$218,270
36
$406,539
2
$128,560
APPLICATIONS APPROVED, NOT ACCEPTED
4
$463,778
28
$388,597
38
$470,956
2
$35,995
6
$369,137
2
$159,560
APPLICATIONS DENIED
11
$452,622
89
$474,641
141
$445,560
12
$393,453
27
$332,946
3
$244,487
APPLICATIONS WITHDRAWN
14
$398,720
61
$419,268
62
$423,630
1
$360,840
7
$386,790
0
$0
FILES CLOSED FOR INCOMPLETENESS
0
$0
12
$612,615
19
$477,147
3
$262,497
2
$287,130
0
$0
Aggregated Statistics For Year 2007 (Based on 4 partial tracts)
A) FHA, FSA/RHS & VA Home Purchase Loans
B) Conventional Home Purchase Loans
C) Refinancings
D) Home Improvement Loans
F) Non-occupant Loans on < 5 Family Dwellings (A B C & D)
G) Loans On Manufactured Home Dwelling (A B C & D)
Number
Average Value
Number
Average Value
Number
Average Value
Number
Average Value
Number
Average Value
Number
Average Value
LOANS ORIGINATED
4
$307,852
285
$548,769
456
$518,724
43
$276,190
34
$466,169
3
$280,963
APPLICATIONS APPROVED, NOT ACCEPTED
0
$0
60
$538,254
150
$580,978
18
$129,393
7
$450,137
0
$0
APPLICATIONS DENIED
1
$384,260
136
$578,874
382
$617,768
43
$261,760
24
$493,174
0
$0
APPLICATIONS WITHDRAWN
0
$0
60
$550,095
174
$616,192
16
$202,749
13
$592,438
1
$453,650
FILES CLOSED FOR INCOMPLETENESS
0
$0
13
$692,470
48
$578,823
6
$412,072
4
$383,828
1
$288,810
Aggregated Statistics For Year 2006 (Based on 4 partial tracts)
B) Conventional Home Purchase Loans
C) Refinancings
D) Home Improvement Loans
F) Non-occupant Loans on < 5 Family Dwellings (A B C & D)
G) Loans On Manufactured Home Dwelling (A B C & D)
Number
Average Value
Number
Average Value
Number
Average Value
Number
Average Value
Number
Average Value
LOANS ORIGINATED
701
$488,618
708
$493,992
69
$344,852
56
$493,586
2
$239,640
APPLICATIONS APPROVED, NOT ACCEPTED
166
$505,151
192
$542,623
17
$258,896
11
$414,925
1
$18,010
APPLICATIONS DENIED
246
$587,961
357
$610,908
46
$343,883
10
$414,831
1
$170,380
APPLICATIONS WITHDRAWN
129
$500,087
234
$487,556
8
$207,758
15
$418,359
0
$0
FILES CLOSED FOR INCOMPLETENESS
29
$555,330
48
$500,241
3
$43,730
0
$0
0
$0
Aggregated Statistics For Year 2005 (Based on 4 partial tracts)
A) FHA, FSA/RHS & VA Home Purchase Loans
B) Conventional Home Purchase Loans
C) Refinancings
D) Home Improvement Loans
F) Non-occupant Loans on < 5 Family Dwellings (A B C & D)
G) Loans On Manufactured Home Dwelling (A B C & D)
Number
Average Value
Number
Average Value
Number
Average Value
Number
Average Value
Number
Average Value
Number
Average Value
LOANS ORIGINATED
0
$0
801
$492,026
847
$490,767
99
$327,429
75
$473,974
2
$183,195
APPLICATIONS APPROVED, NOT ACCEPTED
1
$384,260
206
$470,786
143
$471,114
14
$144,884
25
$440,076
1
$204,320
APPLICATIONS DENIED
0
$0
252
$505,516
339
$535,785
36
$314,966
22
$640,609
2
$31,725
APPLICATIONS WITHDRAWN
0
$0
170
$476,906
248
$495,650
15
$186,687
22
$385,093
1
$133,670
FILES CLOSED FOR INCOMPLETENESS
0
$0
48
$517,314
95
$487,660
5
$193,740
3
$699,287
1
$74,800
Aggregated Statistics For Year 2004 (Based on 4 partial tracts)
A) FHA, FSA/RHS & VA Home Purchase Loans
B) Conventional Home Purchase Loans
C) Refinancings
D) Home Improvement Loans
F) Non-occupant Loans on < 5 Family Dwellings (A B C & D)
G) Loans On Manufactured Home Dwelling (A B C & D)
Number
Average Value
Number
Average Value
Number
Average Value
Number
Average Value
Number
Average Value
Number
Average Value
LOANS ORIGINATED
0
$0
1,015
$452,611
947
$380,740
54
$273,919
86
$372,059
1
$408,630
APPLICATIONS APPROVED, NOT ACCEPTED
1
$80,050
215
$465,616
146
$350,444
13
$276,878
11
$381,195
1
$69,260
APPLICATIONS DENIED
0
$0
292
$488,984
251
$427,185
45
$166,253
23
$355,745
3
$217,707
APPLICATIONS WITHDRAWN
0
$0
208
$445,976
254
$388,133
12
$359,844
29
$415,556
1
$96,070
FILES CLOSED FOR INCOMPLETENESS
1
$390,670
57
$451,917
63
$394,846
4
$167,155
7
$332,006
1
$84,320
Aggregated Statistics For Year 2003 (Based on 4 partial tracts)
A) FHA, FSA/RHS & VA Home Purchase Loans
B) Conventional Home Purchase Loans
C) Refinancings
D) Home Improvement Loans
F) Non-occupant Loans on < 5 Family Dwellings (A B C & D)
Number
Average Value
Number
Average Value
Number
Average Value
Number
Average Value
Number
Average Value
LOANS ORIGINATED
6
$231,448
1,392
$318,334
1,270
$269,217
35
$69,641
97
$288,245
APPLICATIONS APPROVED, NOT ACCEPTED
5
$176,662
159
$318,234
174
$284,059
11
$42,976
18
$293,735
APPLICATIONS DENIED
1
$289,270
148
$327,853
221
$284,449
17
$59,585
16
$239,036
APPLICATIONS WITHDRAWN
0
$0
235
$307,213
194
$260,231
9
$69,981
8
$259,550
FILES CLOSED FOR INCOMPLETENESS
0
$0
52
$362,997
48
$291,767
3
$150,030
2
$377,325
Aggregated Statistics For Year 1999 (Based on 2 partial tracts)
A) FHA, FSA/RHS & VA Home Purchase Loans
B) Conventional Home Purchase Loans
C) Refinancings
D) Home Improvement Loans
F) Non-occupant Loans on < 5 Family Dwellings (A B C & D)
Detailed PMIC statistics for the following Tracts:0134.19
, 0213.03
2005 - 2018 National Fire Incident Reporting System (NFIRS) incidents
According to the data from the years 2005 - 2018 the average number of fires per year is 10. The highest number of reported fire incidents - 24 took place in 2007, and the least - 1 in 2012. The data has an increasing trend.
When looking into fire subcategories, the most incidents belonged to: Outside Fires (46.2%), and Structure Fires (25.5%).
Fire incident types reported to NFIRS in Zip Code 91914


 Nearest zip codes: 91978, 91915, 91913, 91977, 91902, 91941.


 According to the data from the years 2005 - 2018 the average number of fires per year is 10. The highest number of reported fire incidents - 24 took place in 2007, and the least - 1 in 2012. The data has an increasing trend.
 When looking into fire subcategories, the most incidents belonged to: Outside Fires (46.2%), and Structure Fires (25.5%).