Estimated zip code population in 2022: 35,312 Zip code population in 2010: 24,659 Zip code population in 2000: 9,270
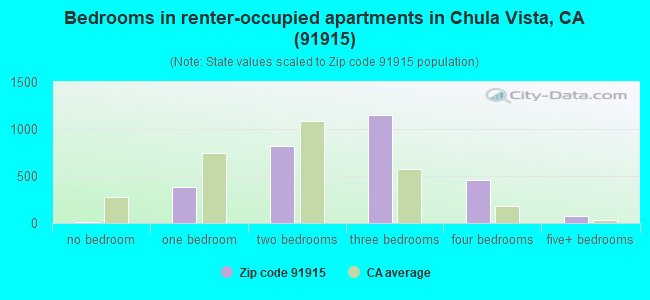
Houses and condos: 10,474 Renter-occupied apartments: 2,909
% of renters here:
28%
State:
44%
March 2022 cost of living index in zip code 91915: 121.4 (high, U.S. average is 100)
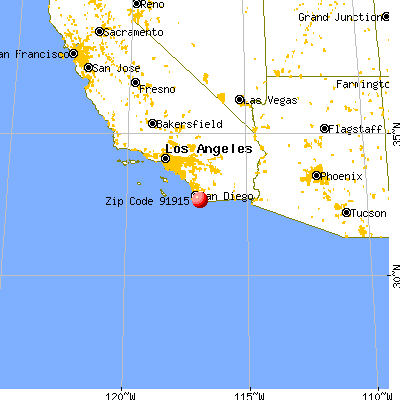
Land area: 7.6 sq. mi. Water area: 0.6 sq. mi.
Population density: 4,641 people per square mile
(average).
OSM Map
General Map
Google Map
MSN Map
OSM Map
General Map
Google Map
MSN Map
OSM Map
General Map
Google Map
MSN Map
OSM Map
General Map
Google Map
MSN Map
Please wait while loading the map...
Real estate property taxes paid for housing units in 2022:
This zip code:
1.1% ($8,037)
California:
0.7% ($4,831)
Median real estate property taxes paid for housing units with mortgages in 2022: $8,012 (1.1%) Median real estate property taxes paid for housing units with no mortgage in 2022: $8,808 (1.1%)
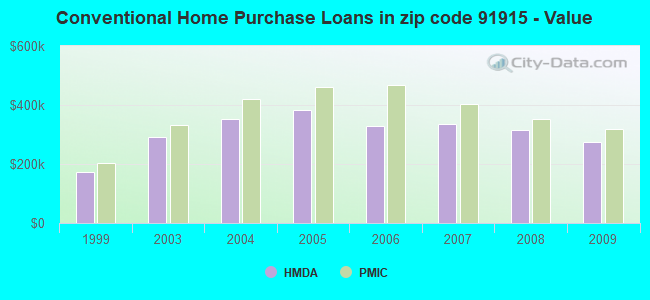
Estimated median house/condo value in 2022: $751,733
91915:
$751,733
California:
$715,900
According to our research of California and other state lists, there were 2 registered sex offenders living in 91915 zip code as of May 07, 2024. The ratio of all residents to sex offenders in zip code 91915 is 15,560 to 1. The ratio of registered sex offenders to all residents in this zip code is much lower than the state average.
Median resident age:
This zip code:
34.8 years
California median age:
37.9 years
Average household size:
This zip code:
3.5 people
California:
2.8 people
Averages for the 2020 tax year for zip code 91915, filed in 2021:
Average Adjusted Gross Income (AGI) in 2020: $83,319 (Individual Income Tax Returns)
Here:
$83,319
State:
$95,910
Salary/wage: $76,672 (reported on 86.8% of returns)
Here:
$76,672
State:
$77,331
(% of AGI for various income ranges: 1074.9% for AGIs below $25k, 3738.5% for AGIs $25k-50k, 6925.8% for AGIs $50k-75k, 10583.9% for AGIs $75k-100k, 21339.6% for AGIs $100k-200k, 72221.6% for AGIs over 200k)
Taxable interest for individuals: $540 (reported on 39.9% of returns)
This zip code:
$540
California:
$2,294
(% of AGI for various income ranges: 5.7% for AGIs below $25k, 9.7% for AGIs $25k-50k, 21.7% for AGIs $50k-75k, 29.3% for AGIs $75k-100k, 64.2% for AGIs $100k-200k, 285.3% for AGIs over 200k)
Ordinary dividends: $2,847 (reported on 14.4% of returns)
Here:
$2,847
State:
$10,949
(% of AGI for various income ranges: 4.9% for AGIs below $25k, 8.6% for AGIs $25k-50k, 30.7% for AGIs $50k-75k, 31.7% for AGIs $75k-100k, 68.1% for AGIs $100k-200k, 1171.2% for AGIs over 200k)
Net capital gain/loss in AGI: +$11,423 (reported on 15.5% of returns)
Here:
+$11,423
State:
+$49,306
(% of AGI for various income ranges: 6.1% for AGIs below $25k, 12.9% for AGIs $25k-50k, 59.4% for AGIs $50k-75k, 86.8% for AGIs $75k-100k, 258.4% for AGIs $100k-200k, 6139.7% for AGIs over 200k)
Profit/loss from business: +$10,275 (reported on 16.8% of returns)
Here:
+$10,275
State:
+$15,671
(% of AGI for various income ranges: 131.4% for AGIs below $25k, 152.8% for AGIs $25k-50k, 181.1% for AGIs $50k-75k, 180.9% for AGIs $75k-100k, 264.3% for AGIs $100k-200k, 2769.7% for AGIs over 200k)
Taxable individual retirement arrangement distribution: $20,968 (reported on 3.6% of returns)
91915:
$20,968
California:
$23,505
(% of AGI for various income ranges: 15.6% for AGIs below $25k, 31.4% for AGIs $25k-50k, 86.2% for AGIs $50k-75k, 92.7% for AGIs $75k-100k, 236.1% for AGIs $100k-200k, 983.4% for AGIs over 200k)
Self-employed (Keogh) retirement plans: $34,180 (reported on 0.3% of returns)
91915:
$34,180
California:
$30,163
(% of AGI for various income ranges: 534.1% for AGIs over 200k)
Total itemized deductions: $32,048 (reported on 23.7% of returns)
Here:
$32,048
State:
$39,517
(% of AGI for various income ranges: 59.1% for AGIs below $25k, 208.0% for AGIs $25k-50k, 680.5% for AGIs $50k-75k, 1276.1% for AGIs $75k-100k, 2710.2% for AGIs $100k-200k, 8923.4% for AGIs over 200k)
Charity contributions: $5,256 (reported on 18.8% of returns)
Here:
$5,256
State:
$12,598
(% of AGI for various income ranges: 3.7% for AGIs below $25k, 24.5% for AGIs $25k-50k, 59.7% for AGIs $50k-75k, 120.8% for AGIs $75k-100k, 352.7% for AGIs $100k-200k, 1501.9% for AGIs over 200k)
Taxes paid: $9,271 (reported on 23.7% of returns)
91915:
$9,271
State:
$8,807
(% of AGI for various income ranges: 14.7% for AGIs below $25k, 58.5% for AGIs $25k-50k, 206.2% for AGIs $50k-75k, 409.1% for AGIs $75k-100k, 841.2% for AGIs $100k-200k, 2045.9% for AGIs over 200k)
Earned income credit: $2,041 (reported on 11.7% of returns)
Here:
$2,041
State:
$2,074
(% of AGI for various income ranges: 74.7% for AGIs below $25k, 65.1% for AGIs $25k-50k, 1.3% for AGIs $50k-75k)
Percentage of individuals using paid preparers for their 2020 taxes: 94.1%
Here:
94%
State:
92%
(% for various income ranges: 92.5% for AGIs below $25k, 94.9% for AGIs $25k-50k, 94.2% for AGIs $50k-75k, 94.6% for AGIs $75k-100k, 95.1% for AGIs $100k-200k, 93.6% for AGIs over 200k)
Averages for the 2012 tax year for zip code 91915, filed in 2013:
Average Adjusted Gross Income (AGI) in 2012: $73,631 (Individual Income Tax Returns)
Here:
$73,631
State:
$72,726
Salary/wage: $69,607 (reported on 90.0% of returns)
Here:
$69,607
State:
$59,079
(% of AGI for various income ranges: 78.5% for AGIs below $25k, 83.9% for AGIs $25k-50k, 86.9% for AGIs $50k-75k, 87.5% for AGIs $75k-100k, 88.1% for AGIs $100k-200k, 73.8% for AGIs over 200k)
Taxable interest for individuals: $400 (reported on 42.1% of returns)
This zip code:
$400
California:
$2,146
(% of AGI for various income ranges: 0.3% for AGIs below $25k, 0.3% for AGIs $25k-50k, 0.2% for AGIs $50k-75k, 0.3% for AGIs $75k-100k, 0.2% for AGIs $100k-200k, 0.3% for AGIs over 200k)
Ordinary dividends: $2,381 (reported on 13.1% of returns)
Here:
$2,381
State:
$9,308
(% of AGI for various income ranges: 0.3% for AGIs below $25k, 0.4% for AGIs $25k-50k, 0.4% for AGIs $50k-75k, 0.3% for AGIs $75k-100k, 0.2% for AGIs $100k-200k, 1.3% for AGIs over 200k)
Net capital gain/loss in AGI: +$3,258 (reported on 10.8% of returns)
Here:
+$3,258
State:
+$30,460
(% of AGI for various income ranges: 0.2% for AGIs $50k-75k, 0.2% for AGIs $75k-100k, 0.4% for AGIs $100k-200k, 1.8% for AGIs over 200k)
Profit/loss from business: +$12,289 (reported on 15.7% of returns)
Here:
+$12,289
State:
+$17,064
(% of AGI for various income ranges: 11.7% for AGIs below $25k, 5.3% for AGIs $25k-50k, 3.0% for AGIs $50k-75k, 1.9% for AGIs $75k-100k, 1.4% for AGIs $100k-200k, 2.5% for AGIs over 200k)
Taxable individual retirement arrangement distribution: $15,938 (reported on 4.3% of returns)
91915:
$15,938
California:
$19,557
(% of AGI for various income ranges: 1.1% for AGIs below $25k, 0.8% for AGIs $25k-50k, 1.1% for AGIs $50k-75k, 0.9% for AGIs $75k-100k, 0.7% for AGIs $100k-200k, 1.6% for AGIs over 200k)
Self-employment retirement plans: $26,725 (reported on 0.4% of returns)
91915:
$26,725
California:
$24,530
Total itemized deductions: $29,769 (27% of AGI, reported on 51.7% of returns)
Here:
$29,769
State:
$34,004
Here:
27.0% of AGI
State:
22.7% of AGI
(% of AGI for various income ranges: 10.0% for AGIs below $25k, 16.5% for AGIs $25k-50k, 21.9% for AGIs $50k-75k, 23.2% for AGIs $75k-100k, 22.4% for AGIs $100k-200k, 18.8% for AGIs over 200k)
Charity contributions: $2,722 (reported on 41.1% of returns)
Here:
$2,722
State:
$4,659
(% of AGI for various income ranges: 0.4% for AGIs below $25k, 1.0% for AGIs $25k-50k, 1.5% for AGIs $50k-75k, 1.7% for AGIs $75k-100k, 1.7% for AGIs $100k-200k, 1.5% for AGIs over 200k)
Taxes paid: $10,985 (reported on 51.5% of returns)
91915:
$10,985
State:
$14,448
(% of AGI for various income ranges: 2.5% for AGIs below $25k, 4.6% for AGIs $25k-50k, 6.9% for AGIs $50k-75k, 7.9% for AGIs $75k-100k, 8.6% for AGIs $100k-200k, 9.0% for AGIs over 200k)
Earned income credit: $2,202 (reported on 14.4% of returns)
Here:
$2,202
State:
$2,286
(% of AGI for various income ranges: 6.6% for AGIs below $25k, 1.5% for AGIs $25k-50k)
Percentage of individuals using paid preparers for their 2012 taxes: 63.2%
Here:
63%
State:
64%
(% for various income ranges: 57.8% for AGIs below $25k, 61.1% for AGIs $25k-50k, 65.4% for AGIs $50k-75k, 63.9% for AGIs $75k-100k, 67.2% for AGIs $100k-200k, 74.4% for AGIs over 200k)
Averages for the 2004 tax year for zip code 91915, filed in 2005:
Average Adjusted Gross Income (AGI) in 2004: $63,446 (Individual Income Tax Returns)
Here:
$63,446
State:
$58,600
Salary/wage: $59,843 (reported on 91.6% of returns)
Here:
$59,843
State:
$49,455
(% of AGI for various income ranges: 177.2% for AGIs below $10k, 83.5% for AGIs $10k-25k, 88.4% for AGIs $25k-50k, 90.7% for AGIs $50k-75k, 91.4% for AGIs $75k-100k, 80.9% for AGIs over 100k)
Taxable interest for individuals: $557 (reported on 58.1% of returns)
This zip code:
$557
California:
$2,365
(% of AGI for various income ranges: 5.4% for AGIs below $10k, 0.9% for AGIs $10k-25k, 0.5% for AGIs $25k-50k, 0.4% for AGIs $50k-75k, 0.3% for AGIs $75k-100k, 0.5% for AGIs over 100k)
Taxable dividends: $1,815 (reported on 17.9% of returns)
Here:
$1,815
State:
$4,746
(% of AGI for various income ranges: 2.7% for AGIs below $10k, 0.7% for AGIs $10k-25k, 0.2% for AGIs $25k-50k, 0.3% for AGIs $50k-75k, 0.2% for AGIs $75k-100k, 0.8% for AGIs over 100k)
Net capital gain/loss: +$9,163 (reported on 16.4% of returns)
Here:
+$9,163
State:
+$23,418
(% of AGI for various income ranges: 1.7% for AGIs below $10k, -0.2% for AGIs $10k-25k, 0.4% for AGIs $25k-50k, 0.4% for AGIs $50k-75k, 0.6% for AGIs $75k-100k, 4.8% for AGIs over 100k)
Profit/loss from business: +$15,719 (reported on 16.5% of returns)
Here:
+$15,719
State:
+$16,826
(% of AGI for various income ranges: 18.2% for AGIs below $10k, 9.0% for AGIs $10k-25k, 4.9% for AGIs $25k-50k, 3.6% for AGIs $50k-75k, 2.7% for AGIs $75k-100k, 4.2% for AGIs over 100k)
IRA payment deduction: $2,951 (reported on 2.4% of returns)
91915:
$2,951
California:
$3,192
(% of AGI for various income ranges: 0.2% for AGIs $25k-50k, 0.1% for AGIs $50k-75k, 0.1% for AGIs $75k-100k, 0.1% for AGIs over 100k)
Self-employed pension: $17,233 (reported on 0.9% of returns)
Here:
$17,233
California:
$17,688
Total itemized deductions: $29,111 (33% of AGI, reported on 61.5% of returns)
Here:
$29,111
State:
$28,113
Here:
33.1% of AGI
State:
25.3% of AGI
(% of AGI for various income ranges: 29.1% for AGIs below $10k, 17.9% for AGIs $10k-25k, 27.6% for AGIs $25k-50k, 33.6% for AGIs $50k-75k, 31.6% for AGIs $75k-100k, 25.3% for AGIs over 100k)
Charity contributions deductions: $2,456 (3% of AGI, reported on 52.8% of returns)
Here:
$2,456
State:
$3,923
Here:
2.7% of AGI
State:
3.3% of AGI
(% of AGI for various income ranges: 0.9% for AGIs below $10k, 1.0% for AGIs $10k-25k, 1.8% for AGIs $25k-50k, 2.3% for AGIs $50k-75k, 2.3% for AGIs $75k-100k, 2.0% for AGIs over 100k)
Total tax: $7,294 (reported on 80.0% of returns)
91915:
$7,294
State:
$10,761
(% of AGI for various income ranges: 6.4% for AGIs below $10k, 4.5% for AGIs $10k-25k, 5.4% for AGIs $25k-50k, 5.9% for AGIs $50k-75k, 7.3% for AGIs $75k-100k, 13.0% for AGIs over 100k)
Earned income credit: $1,683 (reported on 9.3% of returns)
Here:
$1,683
State:
$1,763
Percentage of individuals using paid preparers for their 2004 taxes: 68.8%
Here:
69%
State:
66%
(% for various income ranges: 54.2% for AGIs below $10k, 67.5% for AGIs $10k-25k, 72.2% for AGIs $25k-50k, 70.7% for AGIs $50k-75k, 69.5% for AGIs $75k-100k, 73.1% for AGIs over 100k)
Household received Food Stamps/SNAP in the past 12 months: 903 Household did not receive Food Stamps/SNAP in the past 12 months: 9,207
Women who had a birth in the past 12 months: 637 (553 now married, 82 unmarried) Women who did not have a birth in the past 12 months: 8,633 (4,413 now married, 4,179 unmarried)
Housing units in zip code 91915 with a mortgage: 6,288 (502 second mortgage, 15 home equity loan, 490 both second mortgage and home equity loan) Median monthly owner costs for units with a mortgage: $3,217 Median monthly owner costs for units without a mortgage: $1,086
Residents with income below the poverty level in 2022:
This zip code:
6.4%
Whole state:
12.2%
Residents with income below 50% of the poverty level in 2022:
This zip code:
3.7%
Whole state:
6.2%
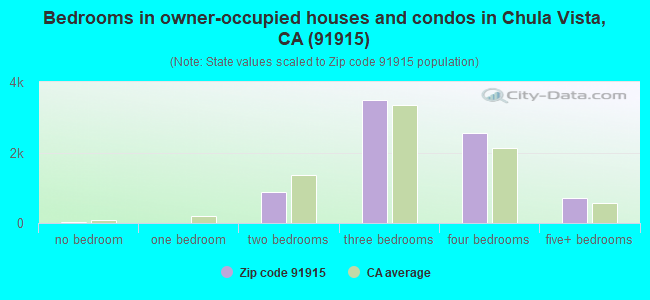
Median number of rooms in houses and condos:
Here:
6.0
State:
6.0
Median number of rooms in apartments:
Here:
4.8
State:
3.9
Notable locations in this zip code not listed on our city pages
Notable locations in zip code 91915: Lower Otay Camping Area (A), Eastlake Greens Golf Course (B), Fenton Ranch (C), Lower Otay Filtration Plant (D), Eastlake Branch-Eastlake High School Campus Branch Chula Vista City Library (E). Display/hide their locations on the map
Size of family households: 1,756 2-persons, 2,352 3-persons, 2,305 4-persons, 1,647 5-persons, 332 6-persons, 328 7-or-more-persons
Size of nonfamily households: 1,013 1-person, 321 2-persons, 12 3-persons
7,662 married couples with children.
982 single-parent households (333 men, 649 women).
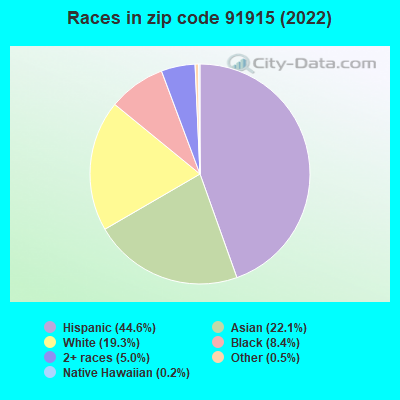
50.3% of residents of 91915 zip code speak English at home.
33.1% of residents speak Spanish at home (74% very well, 18% well, 8% not well).
1.7% of residents speak other Indo-European language at home (92% very well, 4% well, 4% not well).
12.8% of residents speak Asian or Pacific Island language at home (73% very well, 20% well, 5% not well, 1% not at all).
1.5% of residents speak other language at home (70% very well, 30% well).
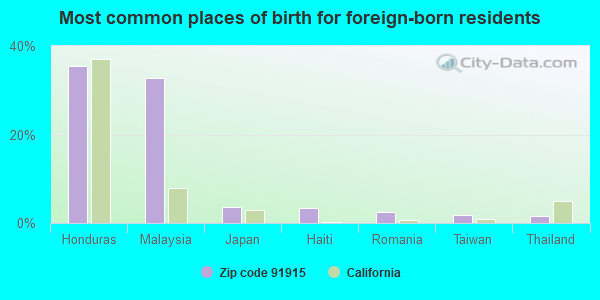
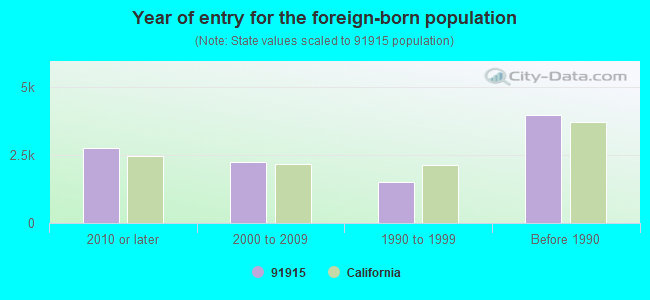
Foreign born population: 9,334 (26.4%) (74.2% of them are naturalized citizens)
Facilities with environmental interests located in this zip code:
EASTLAKE COUNTRY CLUB (1180 HUNTE PARKWAY in CHULA VISTA, CA)
STATE MASTER (California - Hazardous Waste Tracking) - HAZARDOU WASTE PROGRAM Small Quantity Generators, between 100 kg and 1000 kg of hazardous waste/month (Resource Conservation and Recovery Act (tracking hazardous waste)) - notification Organizations: EASTLAKE COUNTRY CLUB PARTNERSHIP (CONTACT/OWNER)
EASTLAKE HIGH (1120 EASTLAKE PARKWAY in CHULA VISTA, CA)
(National Center for Education Statistics) - STATE ID-3730843 Organizations: SWEETWATER UNION HIGH (SCHOOL DISTRICT)
EXXONMOBIL OIL CORP NO 12924 (2210 OTAY LAKES RD in CHULA VISTA, CA)
Large Quantity Generators, more that 1000 kg of hazardous waste/month (Resource Conservation and Recovery Act (tracking hazardous waste)) Organizations: EXXONMOBIL OIL CORPORATION (CONTACT/OPERATOR)
HOME DEPOT USA INC HD 1030 (1320 EASTLAKE PKWY in CHULA VISTA, CA)
Small Quantity Generators, between 100 kg and 1000 kg of hazardous waste/month (Resource Conservation and Recovery Act (tracking hazardous waste)) Alternative names: HOME DEPOT USA HD 1030
CHEVRON 301124 (2115 OLYMPIC PARKWAY in CHULA VISTA, CA)
Small Quantity Generators, between 100 kg and 1000 kg of hazardous waste/month (Resource Conservation and Recovery Act (tracking hazardous waste))
KOME LINE INC (2467 GOLFCREST LOOP in CHULA VISTA, CA)
MOBIL / OTAY LAKES RD CHULA VI (2210 OTAY LAKES RD in CHULA VISTA, CA)
CRITERIA AND HAZARDOUS AIR POLLUTANT INVENTORY (Inventory of air pollution sources) Business SIC classification: GASOLINE SERVICE STATIONS
Housing units lacking complete plumbing facilities: 0.4% Housing units lacking complete kitchen facilities: 0.2%
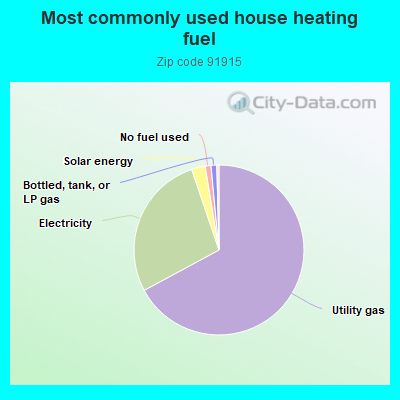
67.2%Utility gas
27.7%Electricity
2.6%Solar energy
1.1%No fuel used
1.1%Bottled, tank, or LP gas
Population in 1990: 12. Population change in the 1990s: +9,258 (+77150.0%).
Place of birth for U.S.-born residents:
This state: 18,462
Northeast: 1,440
Midwest: 1,533
South: 2,420
West: 1,020
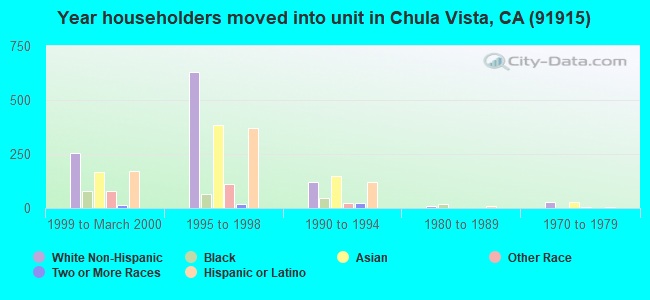
35% of the 91915 zip code residents lived in the same house 5 years ago. Out of people who lived in different houses, 67% lived in this county. Out of people who lived in different counties, 50% lived in California.
92% of the 91915 zip code residents lived in the same house 1 year ago. Out of people who lived in different houses, 52% moved from this county. Out of people who lived in different houses, 25% moved from different county within same state. Out of people who lived in different houses, 5% moved from different state. Out of people who lived in different houses, 22% moved from abroad.
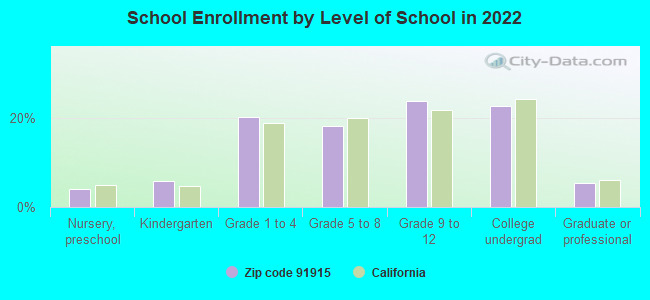
Private vs. public school enrollment:
Students in private schools in grades 1 to 8 (elementary and middle school): 403
Here:
8.7%
California:
10.5%
Students in private schools in grades 9 to 12 (high school): 215
Here:
7.4%
California:
8.5%
Students in private undergraduate colleges: 592
Here:
21.4%
California:
15.9%
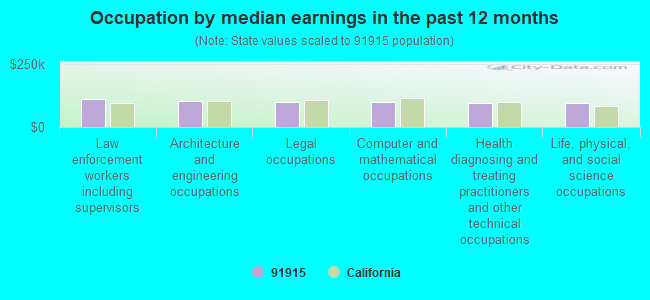
Occupation by median earnings in the past 12 months ($)
109,604Law enforcement workers including supervisors
105,119Architecture and engineering occupations
99,998Legal occupations
99,660Computer and mathematical occupations
95,350Health diagnosing and treating practitioners and other technical occupations
95,086Life, physical, and social science occupations
Companies with federal contracts located in this zip code (CHULA VISTA, CA):
THE DIAMOND GROUP LIMITED LIABILITY COMPANY (1419 ELMWOOD COURT; small business) : $2,613,531 in 2 contractsfrom 2004 to 2005
$1,663,335 with Department of Veterans Affairs for Guard Services. Taking place in TX. Signed on 2004-10-01. Completion date: 2005-09-30.
$950,196, same as above.Signed on 2005-10-01. Completion date: 2006-09-30.
NEPTUNE CONSULTING LLC (2312 SEA ISLAND PL; small business) : $1,364,656 in 11 contractsfrom 2005 to 2006
Contracts for Engineering -- Applied Research and Exploratory Development (R&D) by Navy Signed by year:2000: $0; 2001: $0; 2002: $0; 2003: $0; 2004: $0; 2005: $693,828; 2006: $670,828.
Biggest contracts:
$286,025 with Navy for Engineering -- Applied Research and Exploratory Development (R&D). Signed on 2006-02-16. Completion date: 2006-12-31.
$232,672, same as above.Signed on 2005-06-07. Completion date: 2006-05-06.
$174,998, same as above.Signed on 2006-03-09. Completion date: 2006-12-31.
$139,806, same as above.Signed on 2006-03-27. Completion date: 2006-09-30.
SOUTHWESTERN MAINTENANCE TECHN (2505 WHISPERING PALMS LOOP; small business) : $182,742 in 11 contractsfrom 2002 to 2005
Contracts for Facilities Operations Support Services, Maintenance, Repair and Rebuilding of Equipment -- Metalworking Machinery, Miscellaneous Maintenance and Repair Shop Specialized Equipment, Rolling Mills and Drawing Machines, and moreby Navy Signed by year:2000: $0; 2001: $0; 2002: $26,600; 2003: $36,932; 2004: $45,280; 2005: $73,930; 2006: $0.
Biggest contracts:
$45,280 with Navy for Facilities Operations Support Services. Signed on 2004-12-03. Completion date: 2005-09-30.
$45,280, same as above.Signed on 2005-09-28. Completion date: 2005-09-30.
$26,600 with Navy for Maintenance, Repair and Rebuilding of Equipment -- Metalworking Machinery. Signed on 2002-07-22. Completion date: 2002-10-14.
$14,250 with Navy for Miscellaneous Maintenance and Repair Shop Specialized Equipment. Signed on 2003-05-08. Completion date: 2003-06-20.
JARED F BOASEN (2329 PALOMIRA CT; small business) : $86,601 in 2 contractsfrom 2001 to 2002
$47,001 with Navy for Biomedical -- Basic Research (R&D). Signed on 2002-09-09. Completion date: 2003-09-30.
$39,600 with Navy for Otolaryngology Services. Signed on 2001-07-31. Completion date: 2001-08-01.
NANCY E KUZDAK (2329 PALOMIRA CT; small business) : $79,626 in 2 contractsfrom 2001 to 2002
$47,001 with Navy for Biomedical -- Basic Research (R&D). Signed on 2002-09-09. Completion date: 2003-09-30.
$32,625 with Navy for Otolaryngology Services. Signed on 2001-09-18. Completion date: 2001-10-13.
CYNTHIA M PANGELINAN (1109; small business)
$62,538 with Navy for Optometry Services. Signed on 2000-10-01. Completion date: 2001-02-28.
EDNA A BANTUG (1653 COPPER PENNY DR; small business) : $24,000 in 5 contractsfrom 2002 to 2005
Contracts for Musical Instruments, Chaplain Services by Navy Signed by year:2000: $0; 2001: $0; 2002: $6,000; 2003: $6,000; 2004: $6,000; 2005: $6,000; 2006: $0.
Biggest contracts:
$6,000 with Navy for Musical Instruments. Signed on 2005-09-24. Completion date: 2006-09-30.
$6,000 with Navy for Chaplain Services. Signed on 2004-09-27. Completion date: 2003-09-30.
$6,000, same as above.Signed on 2002-10-02. Completion date: 2003-09-30.
$6,000, same as above.Signed on 2003-09-30. Completion date: 2003-09-30.
Top industries in this zip code by the number of employees in 2005:
2005 - 2018 National Fire Incident Reporting System (NFIRS) incidents
According to the data from the years 2005 - 2018 the average number of fires per year is 9. The highest number of reported fire incidents - 19 took place in 2017, and the least - 0 in 2016. The data has a decreasing trend.
When looking into fire subcategories, the most incidents belonged to: Outside Fires (51.9%), and Structure Fires (24.4%).
Fire incident types reported to NFIRS in Zip Code 91915


 Nearest zip codes: 91913, 91914, 91902, 92154, 91978, 91911.


 According to the data from the years 2005 - 2018 the average number of fires per year is 9. The highest number of reported fire incidents - 19 took place in 2017, and the least - 0 in 2016. The data has a decreasing trend.
 When looking into fire subcategories, the most incidents belonged to: Outside Fires (51.9%), and Structure Fires (24.4%).