Estimated zip code population in 2022: 5,719 Zip code population in 2010: 6,042 Zip code population in 2000: 5,502
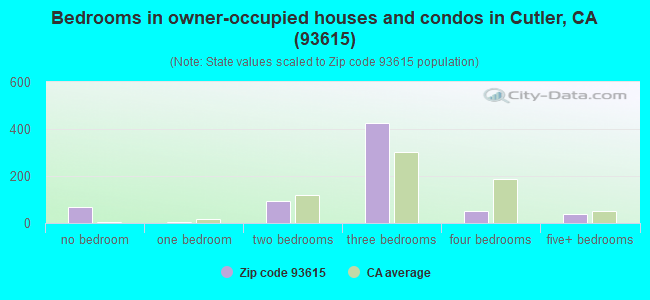
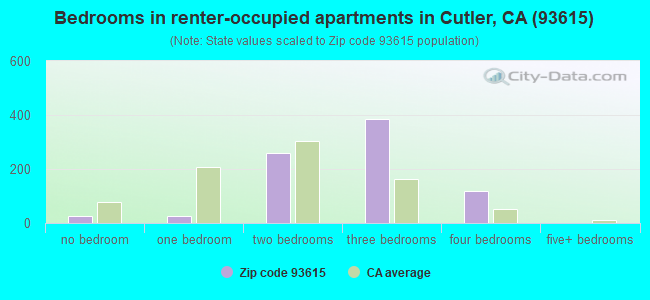
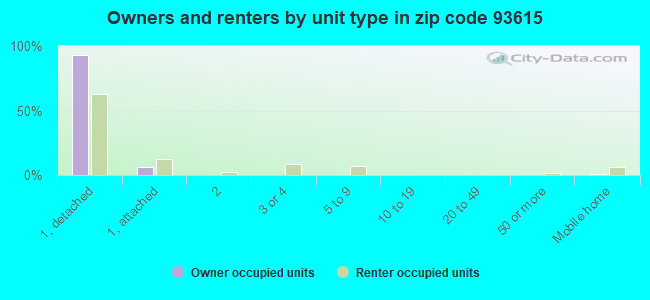
Houses and condos: 1,551 Renter-occupied apartments: 812
% of renters here:
54%
State:
44%
March 2022 cost of living index in zip code 93615: 87.6 (less than average, U.S. average is 100)
Land area: 16.7 sq. mi. Water area: 0.0 sq. mi.
Population density: 342 people per square mile
(very low).
OSM Map
General Map
Google Map
MSN Map
OSM Map
General Map
Google Map
MSN Map
OSM Map
General Map
Google Map
MSN Map
OSM Map
General Map
Google Map
MSN Map
Please wait while loading the map...
Real estate property taxes paid for housing units in 2022:
This zip code:
0.5% ($1,052)
California:
0.7% ($4,831)
Median real estate property taxes paid for housing units with mortgages in 2022: $1,227 (0.5%) Median real estate property taxes paid for housing units with no mortgage in 2022: $1,026 (0.5%)
Business Search- 14 Million verified businesses
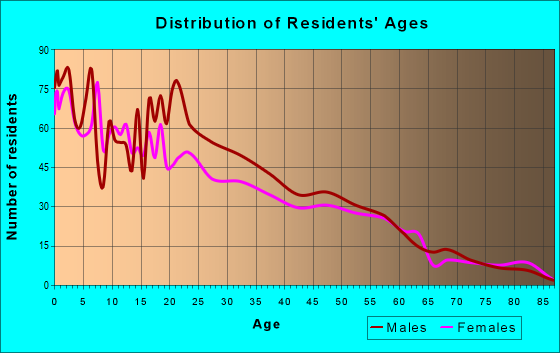
Males: 3,085
(54.0%)
Females: 2,633
(46.0%)
For population 25 years and over in 93615:
High school or higher: 46.5%
Bachelor's degree or higher: 6.7%
Graduate or professional degree: 2.3%
Unemployed: 11.0%
Mean travel time to work (commute): 24.0 minutes
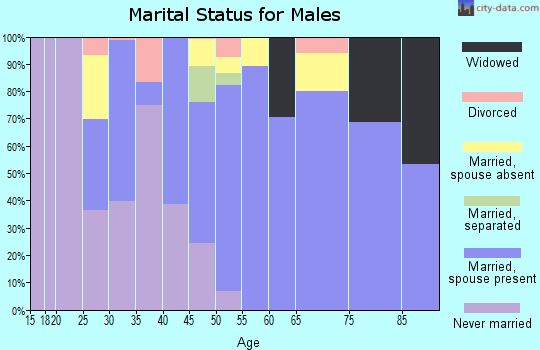
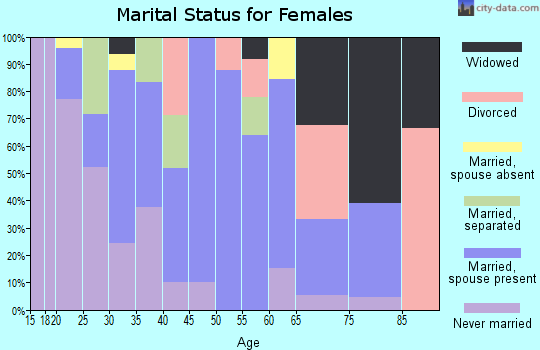
For population 15 years and over in 93615:
Never married: 47.9%
Now married: 42.6%
Separated: 0.7%
Widowed: 3.7%
Divorced: 5.1%
Zip code 93615 compared to state average:
Median household income below state average.
Median house value significantly below state average.
Unemployed percentage above state average.
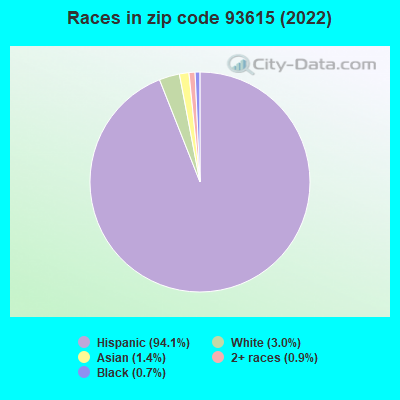
Black race population percentage significantly below state average.
Hispanic race population percentage above state average.
Median age significantly below state average.
Foreign-born population percentage above state average.
Length of stay since moving in significantly above state average.
Percentage of population with a bachelor's degree or higher significantly below state average.
Estimated median house/condo value in 2022: $222,599
93615:
$222,599
California:
$715,900
According to our research of California and other state lists, there were 7 registered sex offenders living in 93615 zip code as of May 14, 2024. The ratio of all residents to sex offenders in zip code 93615 is 907 to 1. The ratio of registered sex offenders to all residents in this zip code is near the state average.
Median resident age:
This zip code:
28.1 years
California median age:
37.9 years
Average household size:
This zip code:
3.8 people
California:
2.8 people
Averages for the 2020 tax year for zip code 93615, filed in 2021:
Average Adjusted Gross Income (AGI) in 2020: $30,721 (Individual Income Tax Returns)
Here:
$30,721
State:
$95,910
Salary/wage: $25,476 (reported on 90.4% of returns)
Here:
$25,476
State:
$77,331
(% of AGI for various income ranges: 2024.2% for AGIs below $25k, 4771.7% for AGIs $25k-50k, 8426.2% for AGIs $50k-75k, 11282.5% for AGIs $75k-100k)
Taxable interest for individuals: $108 (reported on 10.9% of returns)
This zip code:
$108
California:
$2,294
(% of AGI for various income ranges: 1.0% for AGIs below $25k, 0.9% for AGIs $25k-50k, 3.1% for AGIs $50k-75k)
Ordinary dividends: $3,533 (reported on 1.3% of returns)
Here:
$3,533
State:
$10,949
(% of AGI for various income ranges: 17.7% for AGIs below $25k)
Net capital gain/loss in AGI: +$1,100 (reported on 2.2% of returns)
Here:
+$1,100
State:
+$49,306
(% of AGI for various income ranges: 12.0% for AGIs $25k-50k)
Profit/loss from business: +$10,012 (reported on 7.0% of returns)
Here:
+$10,012
State:
+$15,671
(% of AGI for various income ranges: 76.0% for AGIs below $25k, 75.2% for AGIs $25k-50k, 615.4% for AGIs $50k-75k)
Total itemized deductions: $31,500 (reported on 1.3% of returns)
Here:
$31,500
State:
$39,517
(% of AGI for various income ranges: 726.9% for AGIs $50k-75k)
Taxes paid: $7,200 (reported on 1.3% of returns)
93615:
$7,200
State:
$8,807
(% of AGI for various income ranges: 166.2% for AGIs $50k-75k)
Earned income credit: $2,609 (reported on 33.5% of returns)
Here:
$2,609
State:
$2,074
(% of AGI for various income ranges: 208.2% for AGIs below $25k, 165.2% for AGIs $25k-50k)
Percentage of individuals using paid preparers for their 2020 taxes: 91.3%
Here:
91%
State:
92%
(% for various income ranges: 89.0% for AGIs below $25k, 93.6% for AGIs $25k-50k, 95.7% for AGIs $50k-75k, 100.0% for AGIs $75k-100k, 80.0% for AGIs $100k-200k)
Averages for the 2012 tax year for zip code 93615, filed in 2013:
Average Adjusted Gross Income (AGI) in 2012: $23,712 (Individual Income Tax Returns)
Here:
$23,712
State:
$72,726
Salary/wage: $20,548 (reported on 93.8% of returns)
Here:
$20,548
State:
$59,079
(% of AGI for various income ranges: 84.4% for AGIs below $25k, 85.6% for AGIs $25k-50k, 85.4% for AGIs $50k-75k, 174.8% for AGIs $75k-100k)
Taxable interest for individuals: $226 (reported on 8.5% of returns)
This zip code:
$226
California:
$2,146
(% of AGI for various income ranges: 0.1% for AGIs $50k-75k, 0.4% for AGIs $75k-100k)
Ordinary dividends: $833 (reported on 1.3% of returns)
Here:
$833
State:
$9,308
Net capital gain/loss in AGI: +$2,133 (reported on 1.3% of returns)
Here:
+$2,133
State:
+$30,460
Profit/loss from business: +$10,475 (reported on 7.1% of returns)
Here:
+$10,475
State:
+$17,064
Total itemized deductions: $17,546 (25% of AGI, reported on 5.8% of returns)
Here:
$17,546
State:
$34,004
Here:
25.3% of AGI
State:
22.7% of AGI
(% of AGI for various income ranges: 1.3% for AGIs below $25k, 3.3% for AGIs $25k-50k, 10.9% for AGIs $50k-75k, 38.4% for AGIs $75k-100k)
Charity contributions: $1,836 (reported on 4.9% of returns)
Here:
$1,836
State:
$4,659
(% of AGI for various income ranges: 0.4% for AGIs $25k-50k, 1.2% for AGIs $50k-75k, 3.0% for AGIs $75k-100k)
Taxes paid: $5,400 (reported on 5.4% of returns)
93615:
$5,400
State:
$14,448
(% of AGI for various income ranges: 0.2% for AGIs below $25k, 0.5% for AGIs $25k-50k, 2.5% for AGIs $50k-75k, 18.8% for AGIs $75k-100k)
Earned income credit: $2,853 (reported on 41.5% of returns)
Here:
$2,853
State:
$2,286
(% of AGI for various income ranges: 9.4% for AGIs below $25k, 3.1% for AGIs $25k-50k)
Percentage of individuals using paid preparers for their 2012 taxes: 76.3%
Here:
76%
State:
64%
(% for various income ranges: 75.2% for AGIs below $25k, 77.6% for AGIs $25k-50k, 77.8% for AGIs $50k-75k, 200.0% for AGIs $75k-100k)
Averages for the 2004 tax year for zip code 93615, filed in 2005:
Average Adjusted Gross Income (AGI) in 2004: $20,002 (Individual Income Tax Returns)
Here:
$20,002
State:
$58,600
Salary/wage: $17,803 (reported on 93.7% of returns)
Here:
$17,803
State:
$49,455
(% of AGI for various income ranges: 115.0% for AGIs below $10k, 82.9% for AGIs $10k-25k, 87.2% for AGIs $25k-50k, 88.8% for AGIs $50k-75k, 147.2% for AGIs $75k-100k)
Taxable interest for individuals: $606 (reported on 14.8% of returns)
This zip code:
$606
California:
$2,365
(% of AGI for various income ranges: 0.6% for AGIs below $10k, 0.4% for AGIs $10k-25k, 0.5% for AGIs $25k-50k, 0.4% for AGIs $50k-75k, 0.7% for AGIs over 100k)
Taxable dividends: $1,194 (reported on 3.7% of returns)
Here:
$1,194
State:
$4,746
(% of AGI for various income ranges: 1.1% for AGIs below $10k, 0.0% for AGIs $10k-25k, 0.1% for AGIs $25k-50k, 1.3% for AGIs $50k-75k)
Net capital gain/loss: +$2,960 (reported on 3.0% of returns)
Here:
+$2,960
State:
+$23,418
(% of AGI for various income ranges: -0.4% for AGIs below $10k, -0.1% for AGIs $10k-25k, 0.0% for AGIs $25k-50k, 17.5% for AGIs $75k-100k)
Profit/loss from business: +$9,512 (reported on 7.4% of returns)
Here:
+$9,512
State:
+$16,826
(% of AGI for various income ranges: 4.4% for AGIs below $10k, 3.4% for AGIs $10k-25k, 3.2% for AGIs $25k-50k, 9.2% for AGIs $50k-75k)
Total itemized deductions: $15,775 (30% of AGI, reported on 6.1% of returns)
Here:
$15,775
State:
$28,113
Here:
29.7% of AGI
State:
25.3% of AGI
(% of AGI for various income ranges: 1.7% for AGIs $10k-25k, 6.0% for AGIs $25k-50k, 12.4% for AGIs $50k-75k, 13.2% for AGIs over 100k)
Charity contributions deductions: $2,378 (5% of AGI, reported on 4.9% of returns)
Here:
$2,378
State:
$3,923
Here:
4.6% of AGI
State:
3.3% of AGI
(% of AGI for various income ranges: 0.1% for AGIs $10k-25k, 0.7% for AGIs $25k-50k, 1.0% for AGIs $50k-75k, 6.4% for AGIs $75k-100k)
Total tax: $2,284 (reported on 36.4% of returns)
93615:
$2,284
State:
$10,761
(% of AGI for various income ranges: 1.5% for AGIs below $10k, 1.8% for AGIs $10k-25k, 3.6% for AGIs $25k-50k, 8.2% for AGIs $50k-75k, 9.9% for AGIs $75k-100k, 16.1% for AGIs over 100k)
Earned income credit: $2,140 (reported on 54.3% of returns)
Here:
$2,140
State:
$1,763
Percentage of individuals using paid preparers for their 2004 taxes: 78.7%
Here:
79%
State:
66%
(% for various income ranges: 74.9% for AGIs below $10k, 80.7% for AGIs $10k-25k, 81.5% for AGIs $25k-50k, 78.7% for AGIs $50k-75k, 84.6% for AGIs over 100k)
Household received Food Stamps/SNAP in the past 12 months: 631 Household did not receive Food Stamps/SNAP in the past 12 months: 956
Women who had a birth in the past 12 months: 95 (79 now married, 16 unmarried) Women who did not have a birth in the past 12 months: 1,217 (443 now married, 775 unmarried)
Housing units in zip code 93615 with a mortgage: 247 (5 second mortgage) Houses without a mortgage: 9
Median monthly owner costs for units with a mortgage: $1,273 Median monthly owner costs for units without a mortgage: $374
Residents with income below the poverty level in 2022:
This zip code:
22.4%
Whole state:
12.2%
Residents with income below 50% of the poverty level in 2022:
This zip code:
12.6%
Whole state:
6.2%
Median number of rooms in houses and condos:
Here:
4.9
State:
6.0
Median number of rooms in apartments:
Here:
4.6
State:
3.9
Notable locations in this zip code not listed on our city pages
Size of family households: 241 2-persons, 150 3-persons, 348 4-persons, 263 5-persons, 184 6-persons, 70 7-or-more-persons
Size of nonfamily households: 175 1-person, 37 2-persons
1,004 married couples with children.
462 single-parent households (152 men, 310 women).
13.4% of residents of 93615 zip code speak English at home.
86.7% of residents speak Spanish at home (44% very well, 21% well, 12% not well, 24% not at all).
0.1% of residents speak other Indo-European language at home (100% very well).
1.5% of residents speak Asian or Pacific Island language at home (51% very well, 15% well, 34% not well).
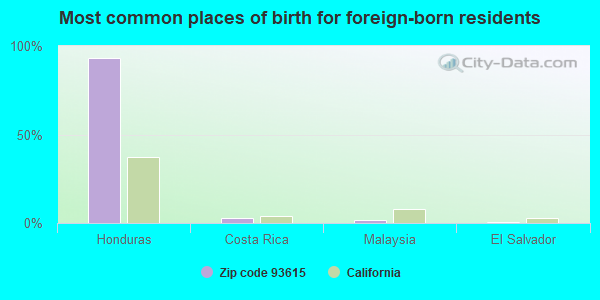
Foreign born population: 2,613 (45.7%) (28.9% of them are naturalized citizens)
This zip code:
45.7%
Whole state:
26.7%
93%Honduras
3%Costa Rica
1%Malaysia
0%El Salvador
0%Mexico
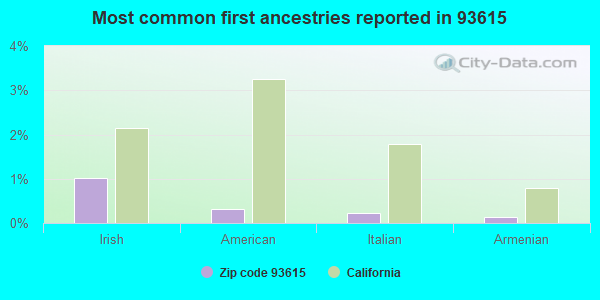
1%Irish
0%American
0%Italian
0%Armenian
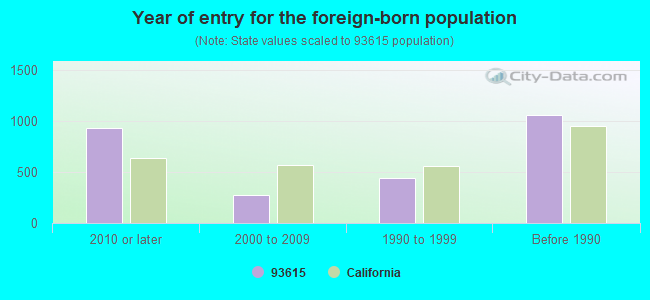
Year of entry for the foreign-born population
9292010 or later
2782000 to 2009
4411990 to 1999
1,057Before 1990
Facilities with environmental interests located in this zip code:
GOLDEN STATE VINTNERS (38558 RD. 128 in CUTLER, CA)
CRITERIA AND HAZARDOUS AIR POLLUTANT INVENTORY (Inventory of air pollution sources) TRI REPORTER (Tracking of toxic chemicals releasing facilities) Business SIC classification: WINES, BRANDY, AND BRANDY SPIRITS
KAWEAH CONTAINER INC (13291 AVENUE 404 in CUTLER, CA)
CRITERIA AND HAZARDOUS AIR POLLUTANT INVENTORY (Inventory of air pollution sources) AIR MAJOR ("Best Available" air pollution technologies tracking) Business SIC classification: CORRUGATED AND SOLID FIBER BOXES Alternative names: KAWEAH CONTAINER, INC.
A T & T WIRELESS SERVICES (12683 AVENUE 400 in CUTLER, CA)
CRITERIA AND HAZARDOUS AIR POLLUTANT INVENTORY (Inventory of air pollution sources) Business SIC classification: TELEPHONE COMMUNICATIONS, EXCEPT RADIOTELEPHONE
Housing units lacking complete plumbing facilities: 1.1% Housing units lacking complete kitchen facilities: 2.7%
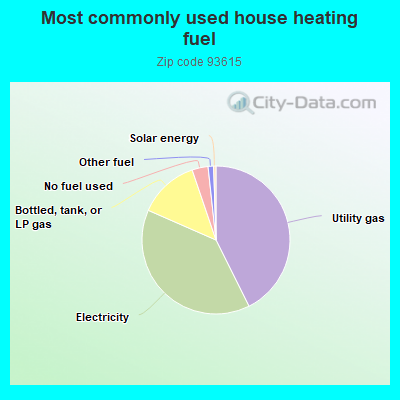
42.6%Utility gas
38.9%Electricity
13.2%Bottled, tank, or LP gas
3.5%No fuel used
1.2%Other fuel
0.5%Solar energy
Population in 1990: 4,901. Population change in the 1990s: +601 (+12.3%).
Place of birth for U.S.-born residents:
This state: 2,748
Northeast: 169
Midwest: 16
South: 124
West: 28
69% of the 93615 zip code residents lived in the same house 5 years ago. Out of people who lived in different houses, 87% lived in this county. Out of people who lived in different counties, 50% lived in California.
97% of the 93615 zip code residents lived in the same house 1 year ago. Out of people who lived in different houses, 44% moved from this county. Out of people who lived in different houses, 78% moved from abroad.
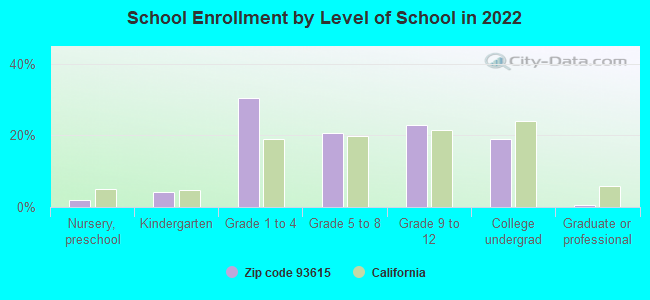
Private vs. public school enrollment:
Students in private schools in grades 1 to 8 (elementary and middle school): 220
Here:
21.1%
California:
10.5%
Students in private schools in grades 9 to 12 (high school): 1
Here:
0.4%
California:
8.5%
Students in private undergraduate colleges:
Here:
0.0%
California:
15.9%
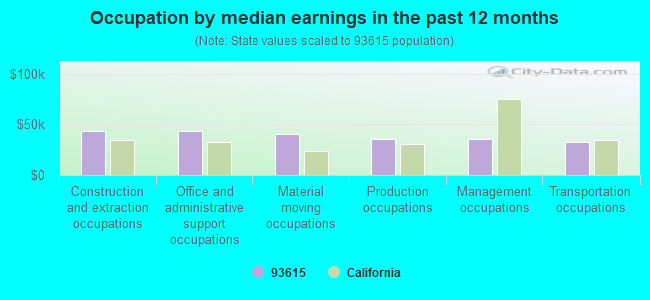
Occupation by median earnings in the past 12 months ($)
43,782Construction and extraction occupations
43,055Office and administrative support occupations
41,040Material moving occupations
35,980Production occupations
35,923Management occupations
32,541Transportation occupations
Top industries in this zip code by the number of employees in 2005:
Wholesale Trade: Fresh Fruit and Vegetable Merchant Wholesalers (250-499 employees: 1 establishment)
Wholesale Trade: Wholesale Trade Agents and Brokers (100-249: 1)
Accommodation and Food Services: Full-Service Restaurants (10-19: 1)
Health Care and Social Assistance: Offices of Dentists (5-9: 1)
Fatal accident statistics in 2012:
Fatal accident count: 1
Vehicles involved in fatal accidents: 1
Fatal accidents caused by drunken drivers: 0
Fatalities: 1
Persons involved in fatal accidents: 1
Pedestrians involved in fatal accidents: 1
Home Mortgage Disclosure Act Aggregated Statistics For Year 2009 (Based on 2 partial tracts)
A) FHA, FSA/RHS & VA Home Purchase Loans
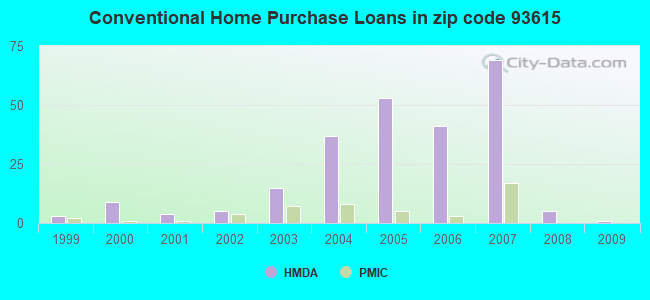
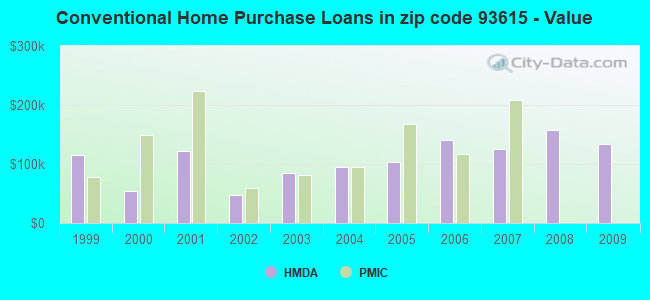
B) Conventional Home Purchase Loans
C) Refinancings
D) Home Improvement Loans
E) Loans on Dwellings For 5+ Families
F) Non-occupant Loans on < 5 Family Dwellings (A B C & D)
Number
Average Value
Number
Average Value
Number
Average Value
Number
Average Value
Number
Average Value
Number
Average Value
LOANS ORIGINATED
7
$133,771
1
$134,530
8
$214,119
0
$0
1
$218,450
0
$0
APPLICATIONS APPROVED, NOT ACCEPTED
0
$0
0
$0
0
$0
1
$33,300
0
$0
0
$0
APPLICATIONS DENIED
0
$0
3
$175,823
21
$105,482
8
$31,469
0
$0
4
$108,890
APPLICATIONS WITHDRAWN
0
$0
1
$130,540
3
$214,897
0
$0
0
$0
1
$133,200
FILES CLOSED FOR INCOMPLETENESS
0
$0
0
$0
4
$142,190
0
$0
0
$0
0
$0
Aggregated Statistics For Year 2008 (Based on 2 partial tracts)
A) FHA, FSA/RHS & VA Home Purchase Loans
B) Conventional Home Purchase Loans
C) Refinancings
D) Home Improvement Loans
E) Loans on Dwellings For 5+ Families
F) Non-occupant Loans on < 5 Family Dwellings (A B C & D)
G) Loans On Manufactured Home Dwelling (A B C & D)
Number
Average Value
Number
Average Value
Number
Average Value
Number
Average Value
Number
Average Value
Number
Average Value
Number
Average Value
LOANS ORIGINATED
1
$177,160
5
$156,910
20
$126,140
3
$84,803
1
$179,820
3
$103,007
0
$0
APPLICATIONS APPROVED, NOT ACCEPTED
0
$0
1
$596,740
9
$129,944
3
$49,727
0
$0
0
$0
0
$0
APPLICATIONS DENIED
0
$0
5
$128,938
43
$133,789
19
$75,503
0
$0
9
$122,396
1
$65,270
APPLICATIONS WITHDRAWN
3
$202,020
0
$0
11
$96,388
1
$13,320
0
$0
0
$0
0
$0
FILES CLOSED FOR INCOMPLETENESS
0
$0
0
$0
5
$147,052
0
$0
0
$0
1
$181,150
0
$0
Aggregated Statistics For Year 2007 (Based on 2 partial tracts)
A) FHA, FSA/RHS & VA Home Purchase Loans
B) Conventional Home Purchase Loans
C) Refinancings
D) Home Improvement Loans
F) Non-occupant Loans on < 5 Family Dwellings (A B C & D)
G) Loans On Manufactured Home Dwelling (A B C & D)
Number
Average Value
Number
Average Value
Number
Average Value
Number
Average Value
Number
Average Value
Number
Average Value
LOANS ORIGINATED
21
$174,048
69
$125,266
73
$137,305
8
$91,075
7
$154,703
0
$0
APPLICATIONS APPROVED, NOT ACCEPTED
0
$0
19
$140,351
39
$125,549
3
$67,043
4
$244,755
1
$83,920
APPLICATIONS DENIED
1
$207,790
32
$183,025
89
$136,073
13
$92,113
25
$139,434
5
$80,186
APPLICATIONS WITHDRAWN
1
$225,110
13
$116,704
35
$153,142
3
$164,280
1
$159,840
0
$0
FILES CLOSED FOR INCOMPLETENESS
0
$0
0
$0
11
$163,715
1
$139,860
0
$0
0
$0
Aggregated Statistics For Year 2006 (Based on 2 partial tracts)
A) FHA, FSA/RHS & VA Home Purchase Loans
B) Conventional Home Purchase Loans
C) Refinancings
D) Home Improvement Loans
E) Loans on Dwellings For 5+ Families
F) Non-occupant Loans on < 5 Family Dwellings (A B C & D)
Number
Average Value
Number
Average Value
Number
Average Value
Number
Average Value
Number
Average Value
Number
Average Value
LOANS ORIGINATED
1
$215,780
41
$140,965
115
$116,938
27
$95,115
3
$306,803
20
$138,462
APPLICATIONS APPROVED, NOT ACCEPTED
0
$0
15
$107,537
29
$130,077
3
$67,487
0
$0
5
$97,502
APPLICATIONS DENIED
0
$0
51
$153,311
75
$122,722
16
$83,250
0
$0
13
$191,603
APPLICATIONS WITHDRAWN
0
$0
24
$125,930
56
$122,972
4
$89,910
0
$0
12
$95,571
FILES CLOSED FOR INCOMPLETENESS
0
$0
5
$168,098
15
$98,657
3
$74,593
0
$0
4
$176,158
Aggregated Statistics For Year 2005 (Based on 2 partial tracts)
A) FHA, FSA/RHS & VA Home Purchase Loans
B) Conventional Home Purchase Loans
C) Refinancings
D) Home Improvement Loans
F) Non-occupant Loans on < 5 Family Dwellings (A B C & D)
Number
Average Value
Number
Average Value
Number
Average Value
Number
Average Value
Number
Average Value
LOANS ORIGINATED
1
$137,200
53
$103,444
100
$106,880
20
$57,609
17
$93,475
APPLICATIONS APPROVED, NOT ACCEPTED
1
$170,500
17
$103,426
33
$113,018
4
$53,945
4
$181,485
APPLICATIONS DENIED
0
$0
23
$89,765
88
$100,082
12
$70,263
16
$93,906
APPLICATIONS WITHDRAWN
0
$0
15
$141,903
85
$108,393
9
$83,176
4
$129,205
FILES CLOSED FOR INCOMPLETENESS
0
$0
0
$0
15
$103,008
0
$0
0
$0
Aggregated Statistics For Year 2004 (Based on 2 partial tracts)
A) FHA, FSA/RHS & VA Home Purchase Loans
B) Conventional Home Purchase Loans
C) Refinancings
D) Home Improvement Loans
F) Non-occupant Loans on < 5 Family Dwellings (A B C & D)
G) Loans On Manufactured Home Dwelling (A B C & D)
Number
Average Value
Number
Average Value
Number
Average Value
Number
Average Value
Number
Average Value
Number
Average Value
LOANS ORIGINATED
5
$105,760
37
$94,356
93
$87,525
13
$66,088
16
$91,242
4
$71,595
APPLICATIONS APPROVED, NOT ACCEPTED
0
$0
11
$90,213
33
$71,726
3
$69,707
8
$70,929
0
$0
APPLICATIONS DENIED
0
$0
15
$100,433
99
$90,939
20
$52,148
11
$81,978
0
$0
APPLICATIONS WITHDRAWN
1
$107,890
11
$125,087
81
$90,527
7
$63,174
4
$110,890
0
$0
FILES CLOSED FOR INCOMPLETENESS
0
$0
0
$0
5
$98,568
1
$127,870
0
$0
0
$0
Aggregated Statistics For Year 2003 (Based on 2 partial tracts)
A) FHA, FSA/RHS & VA Home Purchase Loans
B) Conventional Home Purchase Loans
C) Refinancings
D) Home Improvement Loans
F) Non-occupant Loans on < 5 Family Dwellings (A B C & D)
Number
Average Value
Number
Average Value
Number
Average Value
Number
Average Value
Number
Average Value
LOANS ORIGINATED
17
$88,461
15
$85,515
76
$69,948
1
$22,640
16
$58,691
APPLICATIONS APPROVED, NOT ACCEPTED
1
$85,250
3
$60,383
16
$90,160
3
$14,207
0
$0
APPLICATIONS DENIED
0
$0
7
$62,033
84
$84,186
4
$24,975
15
$84,093
APPLICATIONS WITHDRAWN
0
$0
1
$82,580
48
$104,174
1
$66,600
7
$76,686
FILES CLOSED FOR INCOMPLETENESS
0
$0
3
$136,753
8
$73,760
0
$0
1
$78,590
Aggregated Statistics For Year 2002 (Based on 2 partial tracts)
A) FHA, FSA/RHS & VA Home Purchase Loans
B) Conventional Home Purchase Loans
C) Refinancings
D) Home Improvement Loans
F) Non-occupant Loans on < 5 Family Dwellings (A B C & D)
Number
Average Value
Number
Average Value
Number
Average Value
Number
Average Value
Number
Average Value
LOANS ORIGINATED
12
$84,693
5
$47,686
43
$65,795
4
$19,315
5
$39,960
APPLICATIONS APPROVED, NOT ACCEPTED
3
$81,697
0
$0
8
$57,609
0
$0
0
$0
APPLICATIONS DENIED
1
$109,220
5
$131,068
37
$66,384
8
$29,970
4
$85,580
APPLICATIONS WITHDRAWN
1
$126,540
3
$69,263
27
$76,220
0
$0
1
$83,920
FILES CLOSED FOR INCOMPLETENESS
0
$0
1
$90,580
1
$157,180
0
$0
0
$0
Aggregated Statistics For Year 2001 (Based on 2 partial tracts)
A) FHA, FSA/RHS & VA Home Purchase Loans
B) Conventional Home Purchase Loans
C) Refinancings
D) Home Improvement Loans
F) Non-occupant Loans on < 5 Family Dwellings (A B C & D)
Number
Average Value
Number
Average Value
Number
Average Value
Number
Average Value
Number
Average Value
LOANS ORIGINATED
15
$80,631
4
$121,212
53
$64,187
7
$17,697
7
$40,721
APPLICATIONS APPROVED, NOT ACCEPTED
3
$62,603
1
$171,830
5
$59,674
0
$0
0
$0
APPLICATIONS DENIED
0
$0
3
$77,700
61
$66,731
9
$14,948
5
$69,264
APPLICATIONS WITHDRAWN
1
$122,540
0
$0
27
$79,229
1
$6,660
0
$0
FILES CLOSED FOR INCOMPLETENESS
0
$0
0
$0
5
$78,588
1
$15,980
0
$0
Aggregated Statistics For Year 2000 (Based on 2 partial tracts)
A) FHA, FSA/RHS & VA Home Purchase Loans
B) Conventional Home Purchase Loans
C) Refinancings
D) Home Improvement Loans
E) Loans on Dwellings For 5+ Families
F) Non-occupant Loans on < 5 Family Dwellings (A B C & D)
Number
Average Value
Number
Average Value
Number
Average Value
Number
Average Value
Number
Average Value
Number
Average Value
LOANS ORIGINATED
16
$79,421
9
$54,168
12
$50,949
1
$33,300
0
$0
3
$51,060
APPLICATIONS APPROVED, NOT ACCEPTED
0
$0
5
$90,576
4
$69,265
0
$0
0
$0
1
$82,580
APPLICATIONS DENIED
0
$0
9
$96,200
37
$76,140
5
$18,914
3
$126,097
5
$76,190
APPLICATIONS WITHDRAWN
3
$64,380
3
$59,053
23
$46,620
0
$0
0
$0
3
$27,083
FILES CLOSED FOR INCOMPLETENESS
0
$0
0
$0
5
$72,994
0
$0
0
$0
0
$0
Aggregated Statistics For Year 1999 (Based on 1 partial tract)
A) FHA, FSA/RHS & VA Home Purchase Loans
B) Conventional Home Purchase Loans
C) Refinancings
D) Home Improvement Loans
F) Non-occupant Loans on < 5 Family Dwellings (A B C & D)
Detailed PMIC statistics for the following Tracts:0006.00
2005 - 2018 National Fire Incident Reporting System (NFIRS) incidents
Based on the data from the years 2005 - 2018 the average number of fire incidents per year is 13. The highest number of fire incidents - 36 took place in 2017, and the least - 0 in 2009. The data has a growing trend.
When looking into fire subcategories, the most incidents belonged to: Outside Fires (51.9%), and Structure Fires (28.3%).
Fire incident types reported to NFIRS in Zip Code 93615
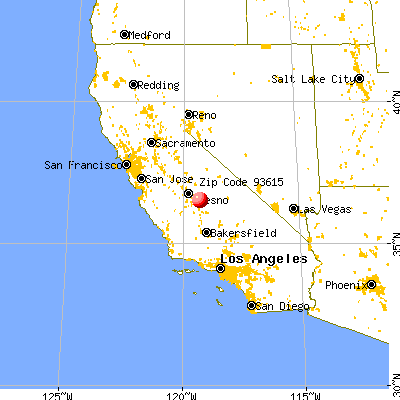


 Nearest zip codes: 93666, 93618, 93235, 93291, 93646, 93647.


 Based on the data from the years 2005 - 2018 the average number of fire incidents per year is 13. The highest number of fire incidents - 36 took place in 2017, and the least - 0 in 2009. The data has a growing trend.
 When looking into fire subcategories, the most incidents belonged to: Outside Fires (51.9%), and Structure Fires (28.3%).