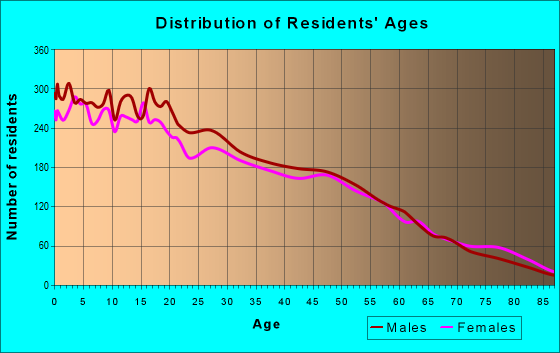
Estimated zip code population in 2022: 32,065 Zip code population in 2010: 28,262 Zip code population in 2000: 24,205
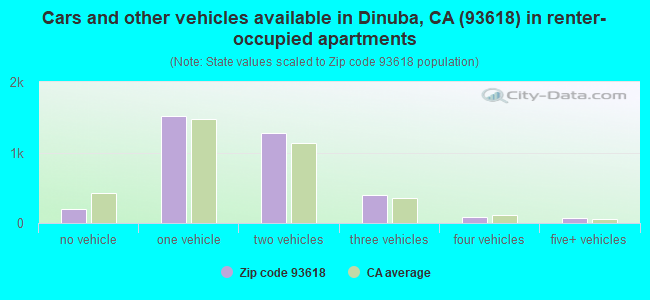
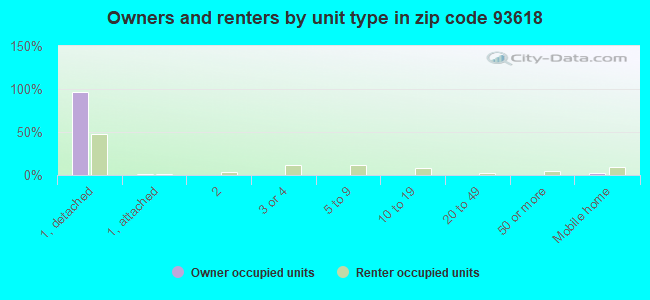
Houses and condos: 8,888 Renter-occupied apartments: 3,548
% of renters here:
42%
State:
44%
March 2022 cost of living index in zip code 93618: 88.6 (less than average, U.S. average is 100)
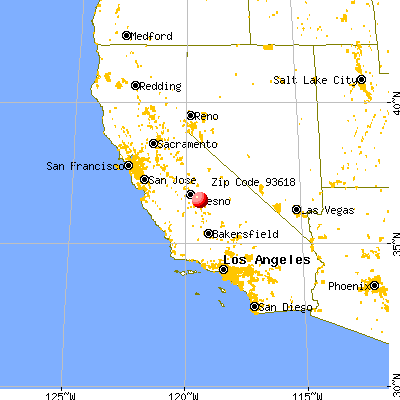
Land area: 66.7 sq. mi. Water area: 0.0 sq. mi.
Population density: 481 people per square mile
(low).
OSM Map
General Map
Google Map
MSN Map
OSM Map
General Map
Google Map
MSN Map
OSM Map
General Map
Google Map
MSN Map
OSM Map
General Map
Google Map
MSN Map
Please wait while loading the map...
Real estate property taxes paid for housing units in 2022:
This zip code:
0.8% ($2,227)
California:
0.7% ($4,831)
Median real estate property taxes paid for housing units with mortgages in 2022: $2,313 (0.8%) Median real estate property taxes paid for housing units with no mortgage in 2022: $1,972 (0.8%)
Averages for the 2020 tax year for zip code 93618, filed in 2021:
Average Adjusted Gross Income (AGI) in 2020: $42,021 (Individual Income Tax Returns)
Here:
$42,021
State:
$95,910
Salary/wage: $36,616 (reported on 89.5% of returns)
Here:
$36,616
State:
$77,331
(% of AGI for various income ranges: 1635.5% for AGIs below $25k, 4234.2% for AGIs $25k-50k, 8262.7% for AGIs $50k-75k, 11829.2% for AGIs $75k-100k, 20294.4% for AGIs $100k-200k, 102050.0% for AGIs over 200k)
Taxable interest for individuals: $690 (reported on 19.7% of returns)
This zip code:
$690
California:
$2,294
(% of AGI for various income ranges: 6.0% for AGIs below $25k, 6.6% for AGIs $25k-50k, 19.9% for AGIs $50k-75k, 47.1% for AGIs $75k-100k, 161.8% for AGIs $100k-200k, 1595.0% for AGIs over 200k)
Ordinary dividends: $5,745 (reported on 3.5% of returns)
Here:
$5,745
State:
$10,949
(% of AGI for various income ranges: 2.8% for AGIs below $25k, 4.0% for AGIs $25k-50k, 20.0% for AGIs $50k-75k, 53.1% for AGIs $75k-100k, 172.1% for AGIs $100k-200k, 6575.0% for AGIs over 200k)
Net capital gain/loss in AGI: +$14,870 (reported on 4.3% of returns)
Here:
+$14,870
State:
+$49,306
(% of AGI for various income ranges: 1.5% for AGIs below $25k, 14.2% for AGIs $25k-50k, 24.1% for AGIs $50k-75k, 52.5% for AGIs $75k-100k, 418.7% for AGIs $100k-200k, 29050.0% for AGIs over 200k)
Profit/loss from business: +$9,363 (reported on 9.8% of returns)
Here:
+$9,363
State:
+$15,671
(% of AGI for various income ranges: 96.0% for AGIs below $25k, 111.7% for AGIs $25k-50k, 169.2% for AGIs $50k-75k, 157.3% for AGIs $75k-100k, 535.9% for AGIs $100k-200k, 3925.0% for AGIs over 200k)
Taxable individual retirement arrangement distribution: $11,993 (reported on 2.1% of returns)
93618:
$11,993
California:
$23,505
(% of AGI for various income ranges: 8.8% for AGIs below $25k, 9.9% for AGIs $25k-50k, 35.3% for AGIs $50k-75k, 125.4% for AGIs $75k-100k, 439.5% for AGIs $100k-200k)
Total itemized deductions: $30,412 (reported on 4.8% of returns)
Here:
$30,412
State:
$39,517
(% of AGI for various income ranges: 21.2% for AGIs below $25k, 77.9% for AGIs $25k-50k, 284.7% for AGIs $50k-75k, 574.8% for AGIs $75k-100k, 1726.9% for AGIs $100k-200k, 17325.0% for AGIs over 200k)
Charity contributions: $7,492 (reported on 3.8% of returns)
Here:
$7,492
State:
$12,598
(% of AGI for various income ranges: 1.2% for AGIs below $25k, 8.3% for AGIs $25k-50k, 37.1% for AGIs $50k-75k, 95.6% for AGIs $75k-100k, 414.6% for AGIs $100k-200k, 4995.0% for AGIs over 200k)
Taxes paid: $7,356 (reported on 4.8% of returns)
93618:
$7,356
State:
$8,807
(% of AGI for various income ranges: 2.9% for AGIs below $25k, 18.0% for AGIs $25k-50k, 78.9% for AGIs $50k-75k, 161.2% for AGIs $75k-100k, 447.9% for AGIs $100k-200k, 2990.0% for AGIs over 200k)
Earned income credit: $2,535 (reported on 29.0% of returns)
Here:
$2,535
State:
$2,074
(% of AGI for various income ranges: 165.2% for AGIs below $25k, 136.8% for AGIs $25k-50k, 4.0% for AGIs $50k-75k)
Percentage of individuals using paid preparers for their 2020 taxes: 89.1%
Here:
89%
State:
92%
(% for various income ranges: 86.0% for AGIs below $25k, 90.3% for AGIs $25k-50k, 91.6% for AGIs $50k-75k, 91.9% for AGIs $75k-100k, 94.7% for AGIs $100k-200k, 91.7% for AGIs over 200k)
Averages for the 2012 tax year for zip code 93618, filed in 2013:
Average Adjusted Gross Income (AGI) in 2012: $31,960 (Individual Income Tax Returns)
Here:
$31,960
State:
$72,726
Salary/wage: $28,084 (reported on 90.9% of returns)
Here:
$28,084
State:
$59,079
(% of AGI for various income ranges: 81.6% for AGIs below $25k, 86.0% for AGIs $25k-50k, 84.8% for AGIs $50k-75k, 81.7% for AGIs $75k-100k, 71.1% for AGIs $100k-200k, 41.4% for AGIs over 200k)
Taxable interest for individuals: $889 (reported on 18.4% of returns)
This zip code:
$889
California:
$2,146
(% of AGI for various income ranges: 0.3% for AGIs below $25k, 0.2% for AGIs $25k-50k, 0.6% for AGIs $50k-75k, 0.4% for AGIs $75k-100k, 1.0% for AGIs $100k-200k, 2.0% for AGIs over 200k)
Ordinary dividends: $3,692 (reported on 4.4% of returns)
Here:
$3,692
State:
$9,308
(% of AGI for various income ranges: 0.2% for AGIs below $25k, 0.2% for AGIs $25k-50k, 0.2% for AGIs $50k-75k, 0.5% for AGIs $75k-100k, 1.4% for AGIs $100k-200k, 2.3% for AGIs over 200k)
Net capital gain/loss in AGI: +$6,355 (reported on 3.8% of returns)
Here:
+$6,355
State:
+$30,460
(% of AGI for various income ranges: 0.1% for AGIs $25k-50k, 0.3% for AGIs $50k-75k, 2.3% for AGIs $100k-200k, 7.0% for AGIs over 200k)
Profit/loss from business: +$10,633 (reported on 9.9% of returns)
Here:
+$10,633
State:
+$17,064
(% of AGI for various income ranges: 5.1% for AGIs below $25k, 2.6% for AGIs $25k-50k, 1.7% for AGIs $50k-75k, 2.1% for AGIs $75k-100k, 5.7% for AGIs $100k-200k)
Taxable individual retirement arrangement distribution: $10,364 (reported on 3.0% of returns)
93618:
$10,364
California:
$19,557
(% of AGI for various income ranges: 0.6% for AGIs below $25k, 0.7% for AGIs $25k-50k, 0.9% for AGIs $50k-75k, 1.6% for AGIs $75k-100k, 2.2% for AGIs $100k-200k)
Total itemized deductions: $20,234 (28% of AGI, reported on 16.6% of returns)
Here:
$20,234
State:
$34,004
Here:
27.8% of AGI
State:
22.7% of AGI
(% of AGI for various income ranges: 3.1% for AGIs below $25k, 8.2% for AGIs $25k-50k, 13.2% for AGIs $50k-75k, 16.1% for AGIs $75k-100k, 17.5% for AGIs $100k-200k, 19.4% for AGIs over 200k)
Charity contributions: $3,485 (reported on 13.7% of returns)
Here:
$3,485
State:
$4,659
(% of AGI for various income ranges: 0.3% for AGIs below $25k, 0.7% for AGIs $25k-50k, 1.7% for AGIs $50k-75k, 2.5% for AGIs $75k-100k, 3.5% for AGIs $100k-200k, 3.2% for AGIs over 200k)
Taxes paid: $5,624 (reported on 16.5% of returns)
93618:
$5,624
State:
$14,448
(% of AGI for various income ranges: 0.5% for AGIs below $25k, 1.7% for AGIs $25k-50k, 3.2% for AGIs $50k-75k, 4.4% for AGIs $75k-100k, 6.3% for AGIs $100k-200k, 7.8% for AGIs over 200k)
Earned income credit: $2,686 (reported on 37.3% of returns)
Here:
$2,686
State:
$2,286
(% of AGI for various income ranges: 9.6% for AGIs below $25k, 2.8% for AGIs $25k-50k)
Percentage of individuals using paid preparers for their 2012 taxes: 69.7%
Here:
70%
State:
64%
(% for various income ranges: 66.9% for AGIs below $25k, 71.2% for AGIs $25k-50k, 75.5% for AGIs $50k-75k, 75.0% for AGIs $75k-100k, 81.1% for AGIs $100k-200k, 83.3% for AGIs over 200k)
Averages for the 2004 tax year for zip code 93618, filed in 2005:
Average Adjusted Gross Income (AGI) in 2004: $27,938 (Individual Income Tax Returns)
Here:
$27,938
State:
$58,600
Salary/wage: $25,081 (reported on 90.5% of returns)
Here:
$25,081
State:
$49,455
(% of AGI for various income ranges: 210.4% for AGIs below $10k, 82.7% for AGIs $10k-25k, 86.1% for AGIs $25k-50k, 84.2% for AGIs $50k-75k, 81.4% for AGIs $75k-100k, 50.4% for AGIs over 100k)
Taxable interest for individuals: $1,338 (reported on 24.6% of returns)
This zip code:
$1,338
California:
$2,365
(% of AGI for various income ranges: 6.5% for AGIs below $10k, 1.0% for AGIs $10k-25k, 0.5% for AGIs $25k-50k, 0.9% for AGIs $50k-75k, 1.1% for AGIs $75k-100k, 2.4% for AGIs over 100k)
Taxable dividends: $2,452 (reported on 7.4% of returns)
Here:
$2,452
State:
$4,746
(% of AGI for various income ranges: 2.4% for AGIs below $10k, 0.3% for AGIs $10k-25k, 0.4% for AGIs $25k-50k, 0.5% for AGIs $50k-75k, 0.9% for AGIs $75k-100k, 1.5% for AGIs over 100k)
Net capital gain/loss: +$11,111 (reported on 7.2% of returns)
Here:
+$11,111
State:
+$23,418
(% of AGI for various income ranges: 3.3% for AGIs below $10k, 0.1% for AGIs $10k-25k, 0.6% for AGIs $25k-50k, 2.0% for AGIs $50k-75k, 2.6% for AGIs $75k-100k, 12.3% for AGIs over 100k)
Profit/loss from business: +$11,185 (reported on 10.7% of returns)
Here:
+$11,185
State:
+$16,826
(% of AGI for various income ranges: 7.2% for AGIs below $10k, 4.1% for AGIs $10k-25k, 3.2% for AGIs $25k-50k, 2.7% for AGIs $50k-75k, 3.3% for AGIs $75k-100k, 8.7% for AGIs over 100k)
IRA payment deduction: $3,612 (reported on 1.0% of returns)
93618:
$3,612
California:
$3,192
(% of AGI for various income ranges: 0.0% for AGIs $10k-25k, 0.1% for AGIs $25k-50k, 0.1% for AGIs $50k-75k, 0.2% for AGIs $75k-100k, 0.3% for AGIs over 100k)
Self-employed pension: $12,148 (reported on 0.3% of returns)
Here:
$12,148
California:
$17,688
Total itemized deductions: $18,776 (29% of AGI, reported on 19.1% of returns)
Here:
$18,776
State:
$28,113
Here:
28.8% of AGI
State:
25.3% of AGI
(% of AGI for various income ranges: 11.3% for AGIs below $10k, 4.4% for AGIs $10k-25k, 13.7% for AGIs $25k-50k, 16.1% for AGIs $50k-75k, 19.0% for AGIs $75k-100k, 15.5% for AGIs over 100k)
Charity contributions deductions: $3,314 (5% of AGI, reported on 17.2% of returns)
Here:
$3,314
State:
$3,923
Here:
4.9% of AGI
State:
3.3% of AGI
(% of AGI for various income ranges: 0.7% for AGIs below $10k, 0.5% for AGIs $10k-25k, 1.4% for AGIs $25k-50k, 2.7% for AGIs $50k-75k, 3.3% for AGIs $75k-100k, 4.1% for AGIs over 100k)
Total tax: $3,875 (reported on 50.7% of returns)
93618:
$3,875
State:
$10,761
(% of AGI for various income ranges: 4.1% for AGIs below $10k, 2.2% for AGIs $10k-25k, 4.2% for AGIs $25k-50k, 7.1% for AGIs $50k-75k, 9.4% for AGIs $75k-100k, 18.0% for AGIs over 100k)
Earned income credit: $2,110 (reported on 40.3% of returns)
Here:
$2,110
State:
$1,763
Percentage of individuals using paid preparers for their 2004 taxes: 71.0%
Here:
71%
State:
66%
(% for various income ranges: 64.6% for AGIs below $10k, 72.4% for AGIs $10k-25k, 72.5% for AGIs $25k-50k, 73.0% for AGIs $50k-75k, 73.4% for AGIs $75k-100k, 84.2% for AGIs over 100k)
Likely homosexual households (counted as self-reported same-sex unmarried-partner households)
Lesbian couples: 0.0% of all households
Gay men: 0.2% of all households
Household received Food Stamps/SNAP in the past 12 months: 2,864 Household did not receive Food Stamps/SNAP in the past 12 months: 6,001
Women who had a birth in the past 12 months: 441 (282 now married, 159 unmarried) Women who did not have a birth in the past 12 months: 8,009 (2,941 now married, 5,078 unmarried)
Housing units in zip code 93618 with a mortgage: 3,412 (265 second mortgage, 10 home equity loan, 216 both second mortgage and home equity loan) Houses without a mortgage: 65
Median monthly owner costs for units with a mortgage: $1,520 Median monthly owner costs for units without a mortgage: $548
Residents with income below the poverty level in 2022:
This zip code:
27.3%
Whole state:
12.2%
Residents with income below 50% of the poverty level in 2022:
This zip code:
15.9%
Whole state:
6.2%
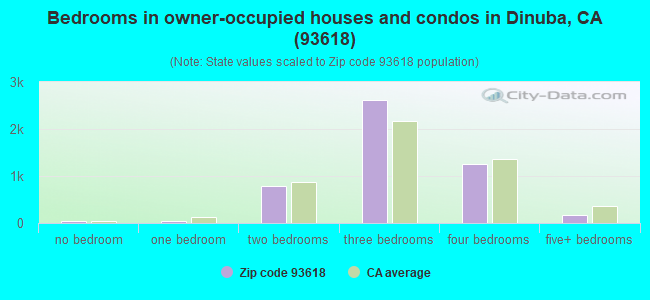
Median number of rooms in houses and condos:
Here:
5.7
State:
6.0
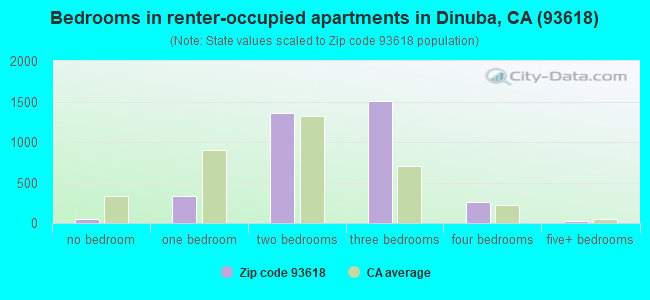
Median number of rooms in apartments:
Here:
4.6
State:
3.9
Notable locations in this zip code not listed on our city pages
Notable locations in zip code 93618: Lopes Dairy (A), Sunrise Dairy (B), Elkhorn Dairy (C), Vanderham Dairy (D), Tulare County Fire Department Battalion 1 Dinuba Fire Station 3 (E), Dinuba Fire Department (F), Dinuba Womens Club (G), Dinuba City Hall (H), Dinuba Branch Tulare County Library (I), Tulare County Building (J), Dinuba Senior Citizens Center (K), Dinuba Public School Administration Building (L), Dinuba Community Center (M). Display/hide their locations on the map
Shopping Centers: United Market Shopping Center (1), Palm Village Shopping Center (2), Northgate Plaza Shopping Centr (3), El Monte Shopping Center (4). Display/hide their locations on the map
Churches in zip code 93618 include: Assembly of God Tabernacle (A), Church of Christ (B), Church of God (C), Dinuba Christian Church (D), First Baptist Church (E), First Lutheran Church (F), First Presbyterian Church (G), First Southern Baptist Church (H), Foursquare Gospel Church (I). Display/hide their locations on the map
5,265 married couples with children.
3,543 single-parent households (657 men, 2,886 women).
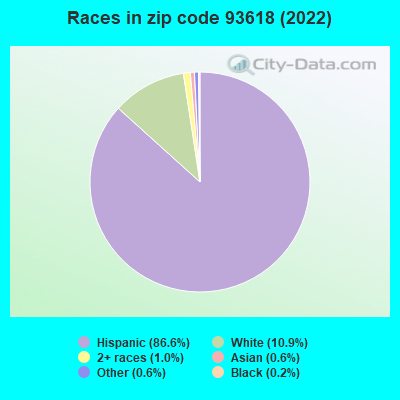
35.4% of residents of 93618 zip code speak English at home.
63.9% of residents speak Spanish at home (57% very well, 16% well, 12% not well, 15% not at all).
0.6% of residents speak other Indo-European language at home (89% very well, 2% well, 8% not well).
0.2% of residents speak Asian or Pacific Island language at home (66% very well, 10% well, 11% not well, 13% not at all).
0.1% of residents speak other language at home (89% very well, 11% not well).
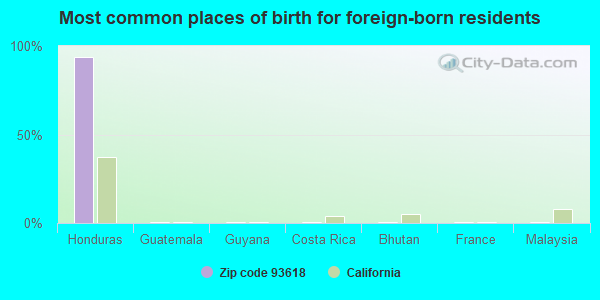
Foreign born population: 7,944 (24.8%) (36.1% of them are naturalized citizens)
This zip code:
24.8%
Whole state:
26.7%
94%Honduras
1%Guatemala
1%Guyana
1%Costa Rica
0%Bhutan
0%France
0%Malaysia
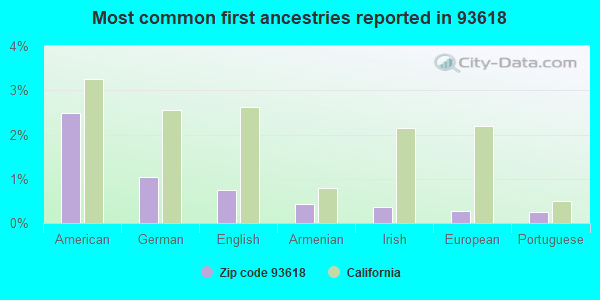
2%American
1%German
1%English
0%Armenian
0%Irish
0%European
0%Portuguese
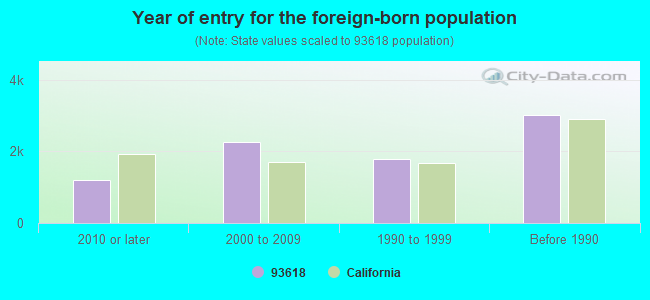
Year of entry for the foreign-born population
1,1932010 or later
2,2652000 to 2009
1,7771990 to 1999
3,020Before 1990
Facilities with environmental interests located in this zip code:
ENNS PACKING COMPANY INCORPORATED (4572 AVE 400 in DINUBA, CA)
STATE MASTER (California - Hazardous Waste Tracking) - HAZARDOU WASTE PROGRAM Small Quantity Generators, between 100 kg and 1000 kg of hazardous waste/month (Resource Conservation and Recovery Act (tracking hazardous waste)) - notification
CALPINE CONTAINERS INC DINUBA (42779 RD 80 ALTA in DINUBA, CA)
STATE MASTER (California - Hazardous Waste Tracking) - HAZARDOU WASTE PROGRAM Small Quantity Generators, between 100 kg and 1000 kg of hazardous waste/month (Resource Conservation and Recovery Act (tracking hazardous waste)) - notification
GRAND VIEW ELEMENTARY (39746 ROAD 64 in DINUBA, CA)
(National Center for Education Statistics) - STATE ID-6053961 Organizations: DINUBA UNIFIED (SCHOOL DISTRICT)
JEFFERSON ELEMENTARY (1160 SIERRA WAY in DINUBA, CA)
(National Center for Education Statistics) - STATE ID-6053979 Organizations: DINUBA UNIFIED (SCHOOL DISTRICT)
KINGS CANYON CONTINUATION (10026 S. CRAWFORD AVE. in DINUBA, CA)
(National Center for Education Statistics) - STATE ID-1033703 Organizations: KINGS CANYON JOINT UNIFIED (SCHOOL DISTRICT)
LINCOLN ELEMENTARY (850 N. EATON AVE. in DINUBA, CA)
(National Center for Education Statistics) - STATE ID-6053987 Organizations: DINUBA UNIFIED (SCHOOL DISTRICT)
ADDAX CORP (301 N M ST in DINUBA, CA)
Small Quantity Generators, between 100 kg and 1000 kg of hazardous waste/month (Resource Conservation and Recovery Act (tracking hazardous waste))
JIM MANNING DODGE INC (194 W TULARE ST in DINUBA, CA)
Small Quantity Generators, between 100 kg and 1000 kg of hazardous waste/month (Resource Conservation and Recovery Act (tracking hazardous waste)) - notification Organizations: JAMES T MANNING (CONTACT/OWNER)
CAL AG ENTERPRISES INC (149 W TULARE ST in DINUBA, CA)
COMPLIANCE ACTIVITY (Tracking inspections of insecticide, fungicide, and rodenticide, and toxic substances)
A T & T WIRELESS SERVICES (6675 AVENUE 412 in DINUBA, CA)
CRITERIA AND HAZARDOUS AIR POLLUTANT INVENTORY (Inventory of air pollution sources) Business SIC classification: TELEPHONE COMMUNICATIONS, EXCEPT RADIOTELEPHONE
ALTA IRRIGATION DISTRICT (289 NORTH L STREET in DINUBA, CA)
CRITERIA AND HAZARDOUS AIR POLLUTANT INVENTORY (Inventory of air pollution sources)
LOMAX PLATING AND POLISHING (273 SOUTH M STREET in DINUBA, CA)
SUPERFUND (Superfund database) Alternative names: DINUBA CHROME PLATING FACILITY
Housing units lacking complete plumbing facilities: 1.9% Housing units lacking complete kitchen facilities: 1.7%
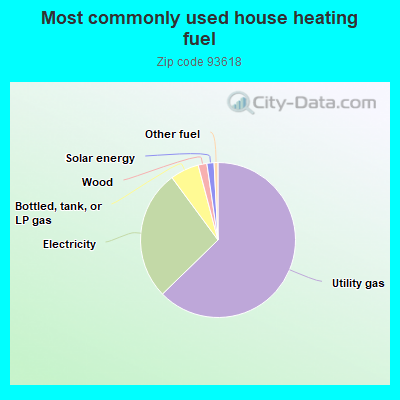
62.6%Utility gas
27.1%Electricity
6.0%Bottled, tank, or LP gas
1.8%Wood
1.5%Solar energy
0.8%Other fuel
Population in 1990: 20,012. Population change in the 1990s: +4,193 (+21.0%).
Place of birth for U.S.-born residents:
This state: 21,937
Northeast: 75
Midwest: 381
South: 877
West: 514
58% of the 93618 zip code residents lived in the same house 5 years ago. Out of people who lived in different houses, 74% lived in this county. Out of people who lived in different counties, 50% lived in California.
93% of the 93618 zip code residents lived in the same house 1 year ago. Out of people who lived in different houses, 41% moved from this county. Out of people who lived in different houses, 56% moved from different county within same state. Out of people who lived in different houses, 5% moved from different state. Out of people who lived in different houses, 1% moved from abroad.
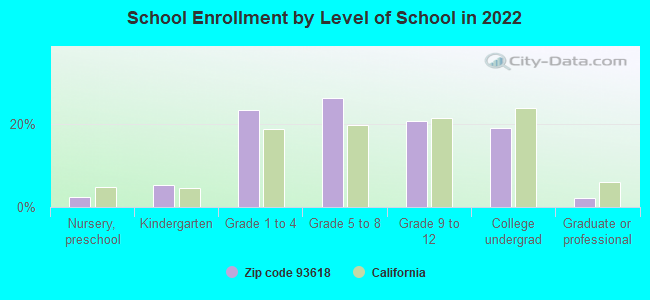
Private vs. public school enrollment:
Students in private schools in grades 1 to 8 (elementary and middle school): 858
Here:
15.9%
California:
10.5%
Students in private schools in grades 9 to 12 (high school): 1
Here:
0.1%
California:
8.5%
Students in private undergraduate colleges: 199
Here:
9.8%
California:
15.9%
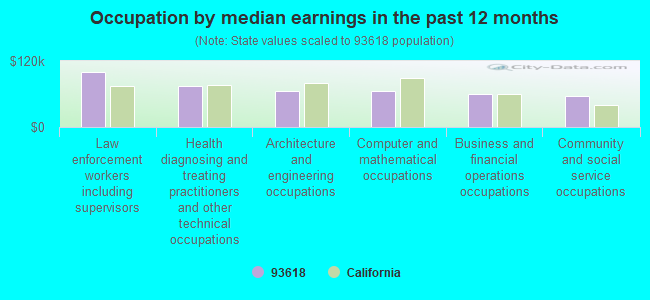
Occupation by median earnings in the past 12 months ($)
99,967Law enforcement workers including supervisors
74,373Health diagnosing and treating practitioners and other technical occupations
65,029Architecture and engineering occupations
65,020Computer and mathematical occupations
60,752Business and financial operations occupations
55,934Community and social service occupations
Companies with federal contracts located in this zip code:
RUIZ FOOD PRODUCTS, INC (501 S ALTA AVE in DINUBA, CA) : $2,796,895 in 7 contractsfrom 2004 to 2005
Contracts for Food Items For Resale, Non-Food Items For Resale by Defense Commissary Agency Signed by year:2000: $0; 2001: $0; 2002: $0; 2003: $0; 2004: $817,303; 2005: $1,979,592; 2006: $0.
Biggest contracts:
$911,934 with Defense Commissary Agency for Food Items For Resale. Signed on 2005-04-01. Completion date: 2005-08-31.
$542,535 with Defense Commissary Agency for Non-Food Items For Resale. Signed on 2005-10-01. Completion date: 2005-12-31.
$523,971 with Defense Commissary Agency for Food Items For Resale. Signed on 2004-10-01. Completion date: 2005-02-28.
$339,508, same as above.Signed on 2005-01-01. Completion date: 2005-03-31.
MIRAMONTE SANITATION INC (42605 ROAD 72 in DINUBA, CA; small business) : $104,005 in 11 contractsfrom 2003 to 2006
Contracts for Trash/Garbage Collection Services - Including Portable Sanitation Services by U.S. Army Corps of Engineers - civil program financing only, Army Signed by year:2000: $0; 2001: $0; 2002: $0; 2003: $38,908; 2004: $0; 2005: $41,401; 2006: $23,696.
Biggest contracts:
$21,460 with U.S. Army Corps of Engineers - civil program financing only for Trash/Garbage Collection Services - Including Portable Sanitation Services. Signed on 2005-03-16. Completion date: 2004-09-30.
$21,460 with Army for Trash/Garbage Collection Services - Including Portable Sanitation Services. Signed on 2005-03-16. Completion date: 2004-09-30.
$19,454 with U.S. Army Corps of Engineers - civil program financing only for Trash/Garbage Collection Services - Including Portable Sanitation Services. Signed on 2003-11-19. Completion date: 2004-09-30.
$19,454 with Army for Trash/Garbage Collection Services - Including Portable Sanitation Services. Signed on 2003-11-19. Completion date: 2004-09-30.
DINUBA R V CENTER, INC (391 S ALTA AVE in DINUBA, CA; small business)
$44,370 with Air Force for Trailers. Signed on 2002-09-28. Completion date: 2002-10-31.
Top industries in this zip code by the number of employees in 2005:
Construction: New Single-Family Housing Construction (except Operative Builders) (20-49 employees: 4 establishments, 1-4 employees: 1 establishment)
Wholesale Trade: Fresh Fruit and Vegetable Merchant Wholesalers (20-49: 3, 10-19: 1, 5-9: 1, 1-4: 3)
2005 - 2018 National Fire Incident Reporting System (NFIRS) incidents
Based on the data from the years 2005 - 2018 the average number of fire incidents per year is 120. The highest number of fire incidents - 173 took place in 2013, and the least - 70 in 2009. The data has a growing trend.
When looking into fire subcategories, the most incidents belonged to: Outside Fires (50.7%), and Structure Fires (28.3%).
Fire incident types reported to NFIRS in Zip Code 93618


 Nearest zip codes: 93666, 93615, 93673, 93291, 93654, 93631.


 Based on the data from the years 2005 - 2018 the average number of fire incidents per year is 120. The highest number of fire incidents - 173 took place in 2013, and the least - 70 in 2009. The data has a growing trend.
 When looking into fire subcategories, the most incidents belonged to: Outside Fires (50.7%), and Structure Fires (28.3%).