Estimated zip code population in 2022: 2,329 Zip code population in 2010: 2,285 Zip code population in 2000: 2,223
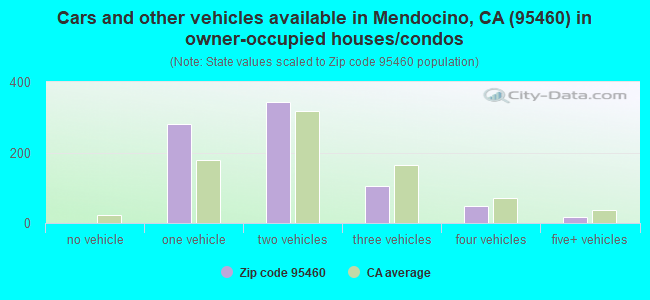
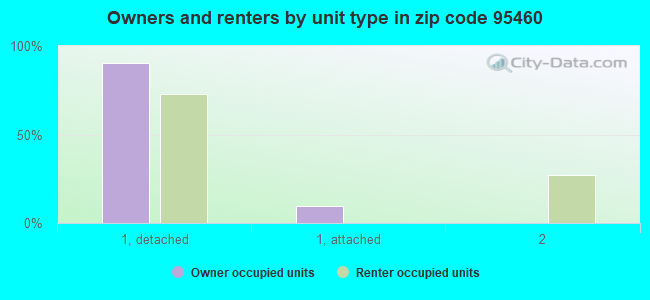
Houses and condos: 1,433 Renter-occupied apartments: 288
% of renters here:
27%
State:
44%
March 2022 cost of living index in zip code 95460: 101.4 (near average, U.S. average is 100)
Land area: 27.3 sq. mi. Water area: 2.4 sq. mi.
Population density: 85 people per square mile
(very low).
OSM Map
General Map
Google Map
MSN Map
OSM Map
General Map
Google Map
MSN Map
OSM Map
General Map
Google Map
MSN Map
OSM Map
General Map
Google Map
MSN Map
Please wait while loading the map...
Real estate property taxes paid for housing units in 2022:
This zip code:
0.6% ($3,810)
California:
0.7% ($4,831)
Median real estate property taxes paid for housing units with mortgages in 2022: $5,706 (1.0%) Median real estate property taxes paid for housing units with no mortgage in 2022: $3,611 (0.5%)
Estimated median house/condo value in 2022: $672,357
95460:
$672,357
California:
$715,900
According to our research of California and other state lists, there was 1 registered sex offender living in 95460 zip code as of April 25, 2024. The ratio of all residents to sex offenders in zip code 95460 is 2,334 to 1. The ratio of registered sex offenders to all residents in this zip code is much lower than the state average.
Median resident age:
This zip code:
61.2 years
California median age:
37.9 years
Average household size:
This zip code:
2.1 people
California:
2.8 people
Averages for the 2020 tax year for zip code 95460, filed in 2021:
Average Adjusted Gross Income (AGI) in 2020: $87,873 (Individual Income Tax Returns)
Here:
$87,873
State:
$95,910
Salary/wage: $51,265 (reported on 53.9% of returns)
Here:
$51,265
State:
$77,331
(% of AGI for various income ranges: 1047.7% for AGIs below $25k, 3347.5% for AGIs $25k-50k, 6183.8% for AGIs $50k-75k, 9024.0% for AGIs $75k-100k, 16051.7% for AGIs $100k-200k, 78995.0% for AGIs over 200k)
Taxable interest for individuals: $3,501 (reported on 53.2% of returns)
This zip code:
$3,501
California:
$2,294
(% of AGI for various income ranges: 96.8% for AGIs below $25k, 188.8% for AGIs $25k-50k, 247.5% for AGIs $50k-75k, 176.0% for AGIs $75k-100k, 1170.0% for AGIs $100k-200k, 6840.0% for AGIs over 200k)
Ordinary dividends: $11,232 (reported on 37.0% of returns)
Here:
$11,232
State:
$10,949
(% of AGI for various income ranges: 175.9% for AGIs below $25k, 426.9% for AGIs $25k-50k, 598.8% for AGIs $50k-75k, 888.0% for AGIs $75k-100k, 2343.3% for AGIs $100k-200k, 15015.0% for AGIs over 200k)
Net capital gain/loss in AGI: +$40,227 (reported on 35.7% of returns)
Here:
+$40,227
State:
+$49,306
(% of AGI for various income ranges: 70.9% for AGIs below $25k, 283.1% for AGIs $25k-50k, 458.8% for AGIs $50k-75k, 1094.0% for AGIs $75k-100k, 5973.3% for AGIs $100k-200k, 85090.0% for AGIs over 200k)
Profit/loss from business: +$22,994 (reported on 31.8% of returns)
Here:
+$22,994
State:
+$15,671
(% of AGI for various income ranges: 401.4% for AGIs below $25k, 1128.1% for AGIs $25k-50k, 820.0% for AGIs $50k-75k, 2152.0% for AGIs $75k-100k, 3083.3% for AGIs $100k-200k, 24985.0% for AGIs over 200k)
Taxable individual retirement arrangement distribution: $16,673 (reported on 19.5% of returns)
95460:
$16,673
California:
$23,505
(% of AGI for various income ranges: 113.6% for AGIs below $25k, 270.0% for AGIs $25k-50k, 575.0% for AGIs $50k-75k, 1642.0% for AGIs $75k-100k, 2583.3% for AGIs $100k-200k, 7445.0% for AGIs over 200k)
Self-employed (Keogh) retirement plans: $16,000 (reported on 1.9% of returns)
95460:
$16,000
California:
$30,163
(% of AGI for various income ranges: 600.0% for AGIs $50k-75k)
Total itemized deductions: $31,504 (reported on 18.2% of returns)
Here:
$31,504
State:
$39,517
(% of AGI for various income ranges: 239.5% for AGIs below $25k, 801.9% for AGIs $25k-50k, 1518.8% for AGIs $50k-75k, 1158.0% for AGIs $75k-100k, 3441.7% for AGIs $100k-200k, 15760.0% for AGIs over 200k)
Charity contributions: $6,700 (reported on 14.3% of returns)
Here:
$6,700
State:
$12,598
(% of AGI for various income ranges: 103.1% for AGIs $25k-50k, 52.5% for AGIs $50k-75k, 144.0% for AGIs $75k-100k, 498.3% for AGIs $100k-200k, 4480.0% for AGIs over 200k)
Taxes paid: $8,018 (reported on 18.2% of returns)
95460:
$8,018
State:
$8,807
(% of AGI for various income ranges: 225.0% for AGIs $25k-50k, 338.8% for AGIs $50k-75k, 402.0% for AGIs $75k-100k, 1066.7% for AGIs $100k-200k, 3865.0% for AGIs over 200k)
Earned income credit: $1,682 (reported on 11.0% of returns)
Here:
$1,682
State:
$2,074
(% of AGI for various income ranges: 86.8% for AGIs below $25k, 59.4% for AGIs $25k-50k)
Percentage of individuals using paid preparers for their 2020 taxes: 90.9%
Here:
91%
State:
92%
(% for various income ranges: 88.5% for AGIs below $25k, 91.4% for AGIs $25k-50k, 94.4% for AGIs $50k-75k, 92.3% for AGIs $75k-100k, 95.5% for AGIs $100k-200k, 85.7% for AGIs over 200k)
Averages for the 2012 tax year for zip code 95460, filed in 2013:
Average Adjusted Gross Income (AGI) in 2012: $63,656 (Individual Income Tax Returns)
Here:
$63,656
State:
$72,726
Salary/wage: $37,138 (reported on 59.7% of returns)
Here:
$37,138
State:
$59,079
(% of AGI for various income ranges: 48.1% for AGIs below $25k, 50.4% for AGIs $25k-50k, 45.3% for AGIs $50k-75k, 45.2% for AGIs $75k-100k, 33.9% for AGIs $100k-200k, 19.3% for AGIs over 200k)
Taxable interest for individuals: $3,096 (reported on 48.6% of returns)
This zip code:
$3,096
California:
$2,146
(% of AGI for various income ranges: 3.5% for AGIs below $25k, 2.3% for AGIs $25k-50k, 1.9% for AGIs $50k-75k, 1.9% for AGIs $75k-100k, 2.7% for AGIs $100k-200k, 2.2% for AGIs over 200k)
Ordinary dividends: $8,436 (reported on 34.7% of returns)
Here:
$8,436
State:
$9,308
(% of AGI for various income ranges: 4.3% for AGIs below $25k, 5.7% for AGIs $25k-50k, 5.3% for AGIs $50k-75k, 3.3% for AGIs $75k-100k, 5.2% for AGIs $100k-200k, 3.9% for AGIs over 200k)
Net capital gain/loss in AGI: +$14,354 (reported on 33.3% of returns)
Here:
+$14,354
State:
+$30,460
(% of AGI for various income ranges: 1.0% for AGIs $25k-50k, 1.7% for AGIs $50k-75k, 1.2% for AGIs $75k-100k, 4.7% for AGIs $100k-200k, 18.1% for AGIs over 200k)
Profit/loss from business: +$19,758 (reported on 38.2% of returns)
Here:
+$19,758
State:
+$17,064
(% of AGI for various income ranges: 27.1% for AGIs below $25k, 18.5% for AGIs $25k-50k, 14.6% for AGIs $50k-75k, 10.9% for AGIs $75k-100k, 13.4% for AGIs $100k-200k, 3.8% for AGIs over 200k)
Taxable individual retirement arrangement distribution: $16,037 (reported on 18.8% of returns)
95460:
$16,037
California:
$19,557
(% of AGI for various income ranges: 4.7% for AGIs below $25k, 5.1% for AGIs $25k-50k, 6.1% for AGIs $50k-75k, 8.1% for AGIs $75k-100k, 9.1% for AGIs $100k-200k)
Self-employment retirement plans: $18,033 (reported on 2.1% of returns)
95460:
$18,033
California:
$24,530
Total itemized deductions: $29,405 (25% of AGI, reported on 40.3% of returns)
Here:
$29,405
State:
$34,004
Here:
25.4% of AGI
State:
22.7% of AGI
(% of AGI for various income ranges: 26.1% for AGIs below $25k, 21.6% for AGIs $25k-50k, 18.6% for AGIs $50k-75k, 18.0% for AGIs $75k-100k, 19.8% for AGIs $100k-200k, 15.1% for AGIs over 200k)
Charity contributions: $3,651 (reported on 32.6% of returns)
Here:
$3,651
State:
$4,659
(% of AGI for various income ranges: 0.9% for AGIs below $25k, 1.5% for AGIs $25k-50k, 2.5% for AGIs $50k-75k, 2.2% for AGIs $75k-100k, 2.6% for AGIs $100k-200k, 1.4% for AGIs over 200k)
Taxes paid: $11,674 (reported on 40.3% of returns)
95460:
$11,674
State:
$14,448
(% of AGI for various income ranges: 5.4% for AGIs below $25k, 5.4% for AGIs $25k-50k, 4.9% for AGIs $50k-75k, 6.0% for AGIs $75k-100k, 7.6% for AGIs $100k-200k, 9.9% for AGIs over 200k)
Earned income credit: $1,710 (reported on 14.6% of returns)
Here:
$1,710
State:
$2,286
(% of AGI for various income ranges: 3.7% for AGIs below $25k, 0.7% for AGIs $25k-50k)
Percentage of individuals using paid preparers for their 2012 taxes: 67.4%
Here:
67%
State:
64%
(% for various income ranges: 62.9% for AGIs below $25k, 64.3% for AGIs $25k-50k, 76.2% for AGIs $50k-75k, 63.6% for AGIs $75k-100k, 75.0% for AGIs $100k-200k, 83.3% for AGIs over 200k)
Averages for the 2004 tax year for zip code 95460, filed in 2005:
Average Adjusted Gross Income (AGI) in 2004: $52,012 (Individual Income Tax Returns)
Here:
$52,012
State:
$58,600
Salary/wage: $32,425 (reported on 59.9% of returns)
Here:
$32,425
State:
$49,455
(% of AGI for various income ranges: 53.1% for AGIs $10k-25k, 49.2% for AGIs $25k-50k, 37.1% for AGIs $50k-75k, 40.9% for AGIs $75k-100k, 27.8% for AGIs over 100k)
Taxable interest for individuals: $3,370 (reported on 66.6% of returns)
This zip code:
$3,370
California:
$2,365
(% of AGI for various income ranges: 7.3% for AGIs $10k-25k, 4.8% for AGIs $25k-50k, 5.0% for AGIs $50k-75k, 5.0% for AGIs $75k-100k, 2.8% for AGIs over 100k)
Taxable dividends: $5,358 (reported on 39.4% of returns)
Here:
$5,358
State:
$4,746
(% of AGI for various income ranges: 4.1% for AGIs $10k-25k, 3.6% for AGIs $25k-50k, 4.5% for AGIs $50k-75k, 4.7% for AGIs $75k-100k, 3.6% for AGIs over 100k)
Net capital gain/loss: +$21,410 (reported on 39.0% of returns)
Here:
+$21,410
State:
+$23,418
(% of AGI for various income ranges: 1.4% for AGIs $10k-25k, 3.2% for AGIs $25k-50k, 3.8% for AGIs $50k-75k, 8.4% for AGIs $75k-100k, 26.7% for AGIs over 100k)
Profit/loss from business: +$22,139 (reported on 38.2% of returns)
Here:
+$22,139
State:
+$16,826
(% of AGI for various income ranges: 21.0% for AGIs $10k-25k, 23.7% for AGIs $25k-50k, 17.6% for AGIs $50k-75k, 14.1% for AGIs $75k-100k, 13.0% for AGIs over 100k)
IRA payment deduction: $3,227 (reported on 6.4% of returns)
95460:
$3,227
California:
$3,192
(% of AGI for various income ranges: 1.0% for AGIs $10k-25k, 0.9% for AGIs $25k-50k, 0.6% for AGIs $50k-75k, 0.2% for AGIs over 100k)
Self-employed pension: $15,296 (reported on 4.7% of returns)
Here:
$15,296
California:
$17,688
Total itemized deductions: $24,461 (26% of AGI, reported on 40.4% of returns)
Here:
$24,461
State:
$28,113
Here:
26.1% of AGI
State:
25.3% of AGI
(% of AGI for various income ranges: 21.5% for AGIs $10k-25k, 19.8% for AGIs $25k-50k, 18.9% for AGIs $50k-75k, 21.8% for AGIs $75k-100k, 15.8% for AGIs over 100k)
Charity contributions deductions: $3,517 (4% of AGI, reported on 33.6% of returns)
Here:
$3,517
State:
$3,923
Here:
3.5% of AGI
State:
3.3% of AGI
(% of AGI for various income ranges: 1.4% for AGIs $10k-25k, 1.7% for AGIs $25k-50k, 2.5% for AGIs $50k-75k, 3.0% for AGIs $75k-100k, 2.3% for AGIs over 100k)
Total tax: $9,435 (reported on 82.1% of returns)
95460:
$9,435
State:
$10,761
(% of AGI for various income ranges: 7.0% for AGIs $10k-25k, 9.8% for AGIs $25k-50k, 11.2% for AGIs $50k-75k, 11.1% for AGIs $75k-100k, 18.9% for AGIs over 100k)
Earned income credit: $1,093 (reported on 11.3% of returns)
Here:
$1,093
State:
$1,763
Percentage of individuals using paid preparers for their 2004 taxes: 68.5%
Here:
69%
State:
66%
(% for various income ranges: 57.7% for AGIs below $10k, 63.6% for AGIs $10k-25k, 71.3% for AGIs $25k-50k, 78.4% for AGIs $50k-75k, 70.0% for AGIs $75k-100k, 84.3% for AGIs over 100k)
Likely homosexual households (counted as self-reported same-sex unmarried-partner households)
Lesbian couples: 1.4% of all households
Gay men: 0.0% of all households
Household received Food Stamps/SNAP in the past 12 months: 45 Household did not receive Food Stamps/SNAP in the past 12 months: 1,012
Women who had a birth in the past 12 months: 7 (7 now married, 0 unmarried) Women who did not have a birth in the past 12 months: 467 (61 now married, 411 unmarried)
Housing units in zip code 95460 with a mortgage: 271 (72 second mortgage, 75 both second mortgage and home equity loan) Median monthly owner costs for units with a mortgage: $2,276 Median monthly owner costs for units without a mortgage: $874
Residents with income below the poverty level in 2022:
This zip code:
6.0%
Whole state:
12.2%
Residents with income below 50% of the poverty level in 2022:
This zip code:
3.5%
Whole state:
6.2%
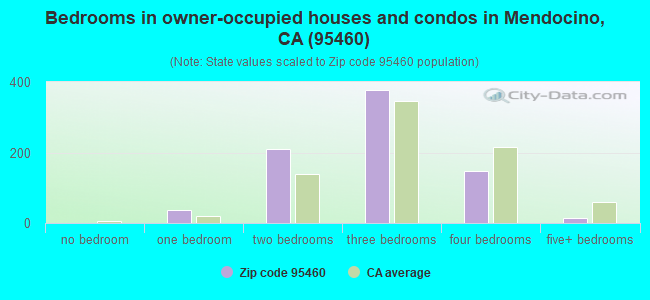
Median number of rooms in houses and condos:
Here:
5.4
State:
6.0
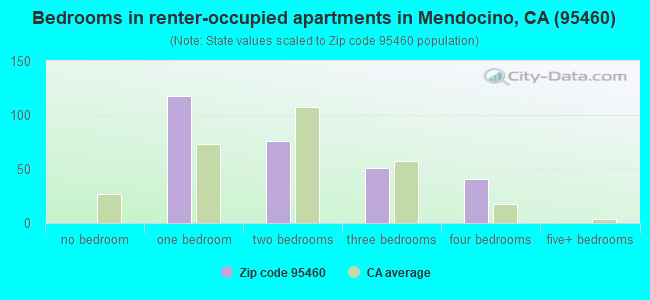
Median number of rooms in apartments:
Here:
3.5
State:
3.9
Notable locations in this zip code not listed on our city pages
Notable locations in zip code 95460: Reep Ranch (A), Woodlands Station (B), Mathison Peak Lookout (C), Point Cabrillo Light Station (D), Mendocino Community Library (E), Mendocino Art Center (F), Kelley House Museum (G), Ford House Museum (H), California Department of Forestry and Fire Protection Woodlands (I), Mendocino Volunteer Fire Department Station 840 (J), Mendocino Volunteer Fire Department Station 841 (K), Mendocino Volunteer Fire Department Woodland Substation (L). Display/hide their locations on the map
Churches in zip code 95460 include: Mendocino Baptist Church (A), Mendocino Presbyterian Church (B), Saint Anthony Catholic Church (C), Temple of Kwan Ti (D). Display/hide their locations on the map
Parks in zip code 95460 include: Point Cabrillo Light Station State Historic Park (1), Russian Gulch State Park (2), Van Damme State Park (3), Friendship Park (4), Mendocino and Headlands Historic District (5), Mendocino Headlands State Park (6). Display/hide their locations on the map
In group quarters: 77 (-1 institutionalized population)
Size of family households: 477 2-persons, 72 3-persons, 37 4-persons, 21 5-persons, 13 7-or-more-persons
Size of nonfamily households: 380 1-person, 86 2-persons
64 married couples with children.
168 single-parent households (41 men, 127 women).
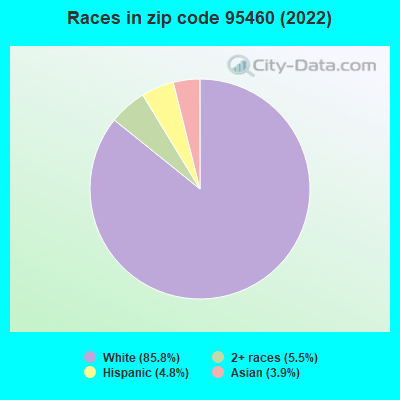
96.2% of residents of 95460 zip code speak English at home.
1.9% of residents speak Spanish at home (100% very well).
2.5% of residents speak Asian or Pacific Island language at home (64% very well, 36% well).
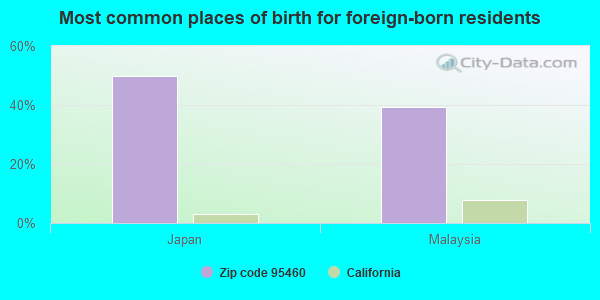
Foreign born population: 77 (3.3%) (69.2% of them are naturalized citizens)
This zip code:
3.3%
Whole state:
26.7%
50%Japan
39%Malaysia
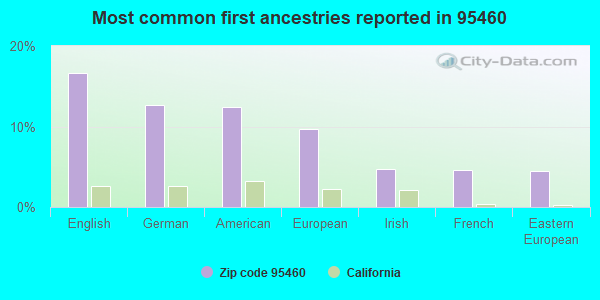
17%English
13%German
12%American
10%European
5%Irish
5%French
4%Eastern European
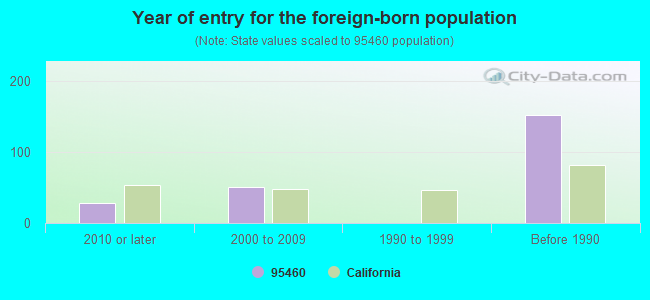
Year of entry for the foreign-born population
282010 or later
512000 to 2009
01990 to 1999
152Before 1990
Facilities with environmental interests located in this zip code:
MENDOCINO ACADEMY (ALTERN) (45000 CAHTO ST. in MENDOCINO, CA)
(National Center for Education Statistics) - STATE ID-2330306 Organizations: MENDOCINO UNIFIED (SCHOOL DISTRICT)
MENDOCINO ALTERNATIVE LEARNING CENTER (44302 LITTLE LAKE ROAD in MENDOCINO, CA)
(National Center for Education Statistics) - STATE ID-6117121 Organizations: MENDOCINO UNIFIED (SCHOOL DISTRICT)
MENDOCINO COMMUNITY HIGH (CONT.) (44801 LITTLE LAKE ROAD in MENDOCINO, CA)
(National Center for Education Statistics) - STATE ID-2330090 Organizations: MENDOCINO UNIFIED (SCHOOL DISTRICT)
MENDOCINO ELEMENTARY (44261 LITTLE LAKE ROAD in MENDOCINO, CA)
(National Center for Education Statistics) - STATE ID-6025167 Organizations: MENDOCINO UNIFIED (SCHOOL DISTRICT)
MENDOCINO HIGH (10700 FORD ST. in MENDOCINO, CA)
(National Center for Education Statistics) - STATE ID-2333185 Organizations: MENDOCINO UNIFIED (SCHOOL DISTRICT)
MENDOCINO MIDDLE (44301 LITTLE LAKE ROAD in MENDOCINO, CA)
(National Center for Education Statistics) - STATE ID-6096747 Organizations: MENDOCINO UNIFIED (SCHOOL DISTRICT)
MENDOCINO CITY CSD (10500 KELLY ST in MENDOCINO, CA)
National Pollutant Discharge Elimination System NON-MAJOR (Tracking pollutant discharge elimination systems) - permit Business SIC classification: SEWERAGE SYSTEMS
MCGILL AND SHEPHERD (5 MI WEST OF GRIMES - MENDOCINO NTL FOREST in MENDOCINO, CA)
CRITERIA AND HAZARDOUS AIR POLLUTANT INVENTORY (Inventory of air pollution sources) Business SIC and NAICS classification: DRILLING OIL AND GAS WELLS
CRITERIA AND HAZARDOUS AIR POLLUTANT INVENTORY (Inventory of air pollution sources) Business SIC classification: REFUSE SYSTEMS Business NAICS classification: SOLID WASTE LANDFILL.
MENDOSA'S (10501 LANSING ST in MENDOCINO, CA)
COMPLIANCE ACTIVITY (Tracking inspections of insecticide, fungicide, and rodenticide, and toxic substances)
NOT TONIGHT DEER (P.O. BOX 71 in MENDOCINO, CA)
COMPLIANCE ACTIVITY (Tracking inspections of insecticide, fungicide, and rodenticide, and toxic substances)
Housing units lacking complete plumbing facilities: 1.3% Housing units lacking complete kitchen facilities: 3.6%
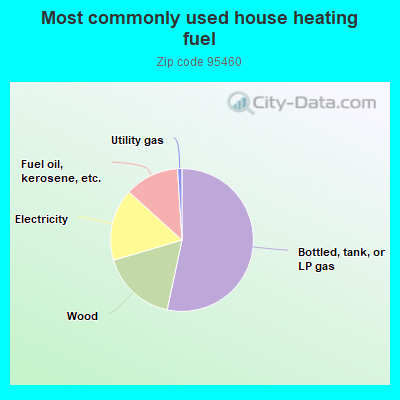
53.4%Bottled, tank, or LP gas
17.1%Wood
16.3%Electricity
12.3%Fuel oil, kerosene, etc.
1.0%Utility gas
Population in 1990: 1,876. Population change in the 1990s: +347 (+18.5%).
Place of birth for U.S.-born residents:
This state: 1,337
Northeast: 238
Midwest: 181
South: 117
West: 200
71% of the 95460 zip code residents lived in the same house 5 years ago. Out of people who lived in different houses, 65% lived in this county. Out of people who lived in different counties, 50% lived in California.
86% of the 95460 zip code residents lived in the same house 1 year ago. Out of people who lived in different houses, 48% moved from this county. Out of people who lived in different houses, 13% moved from different county within same state. Out of people who lived in different houses, 38% moved from different state.
Private vs. public school enrollment:
Students in private schools in grades 1 to 8 (elementary and middle school):
Here:
0.0%
California:
10.5%
Students in private schools in grades 9 to 12 (high school):
Here:
0.0%
California:
8.5%
Students in private undergraduate colleges: 13
Here:
12.9%
California:
15.9%
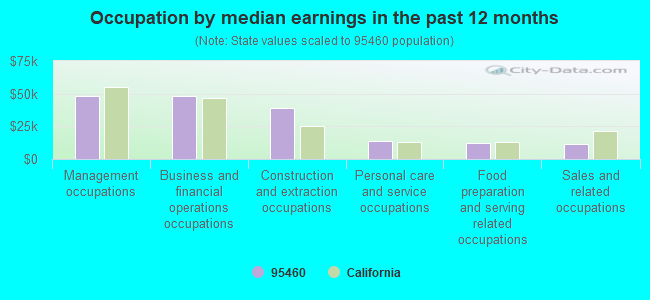
Occupation by median earnings in the past 12 months ($)
48,149Management occupations
48,039Business and financial operations occupations
39,346Construction and extraction occupations
13,939Personal care and service occupations
12,150Food preparation and serving related occupations
11,573Sales and related occupations
Top industries in this zip code by the number of employees in 2005:
Utilities: Electric Power Distribution (100-249 employees: 1 establishment)
Accommodation and Food Services: Hotels (except Casino Hotels) and Motels (50-99: 1, 20-49: 1, 10-19: 1, 5-9: 1, 1-4: 2)
Construction: New Single-Family Housing Construction (except Operative Builders) (20-49: 1, 10-19: 1, 5-9: 1, 1-4: 7)
Health Care and Social Assistance: Homes for the Elderly (20-49: 1)
Accommodation and Food Services: Snack and Nonalcoholic Beverage Bars (10-19: 2)
Real Estate and Rental and Leasing: Residential Property Managers (10-19: 2)
People in group quarters in 2010:
50 people in other noninstitutional facilities
14 people in college/university student housing
People in group quarters in 2000:
2 people in other noninstitutional group quarters
Fatal accident statistics in 2014:
Fatal accident count: 1
Vehicles involved in fatal accidents: 1
Fatal accidents caused by drunken drivers: 1
Fatalities: 1
Persons involved in fatal accidents: 1
Pedestrians involved in fatal accidents: 0
2005 - 2018 National Fire Incident Reporting System (NFIRS) incidents
Based on the data from the years 2005 - 2018 the average number of fire incidents per year is 18. The highest number of fire incidents - 34 took place in 2018, and the least - 4 in 2014. The data has a growing trend.
When looking into fire subcategories, the most reports belonged to: Outside Fires (51.6%), and Structure Fires (34.8%).
Fire incident types reported to NFIRS in Zip Code 95460


 Nearest zip codes: 95456, 95420, 95410, 95437, 95427, 95432.


 Based on the data from the years 2005 - 2018 the average number of fire incidents per year is 18. The highest number of fire incidents - 34 took place in 2018, and the least - 4 in 2014. The data has a growing trend.
 When looking into fire subcategories, the most reports belonged to: Outside Fires (51.6%), and Structure Fires (34.8%).