Estimated zip code population in 2022: 1,460 Zip code population in 2010: 1,878 Zip code population in 2000: 1,575
Houses and condos: 736 Renter-occupied apartments: 342
% of renters here:
56%
State:
37%
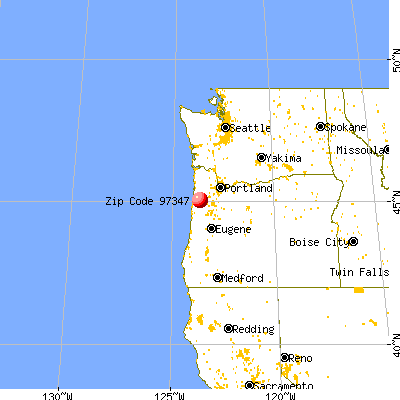
March 2022 cost of living index in zip code 97347: 99.0 (near average, U.S. average is 100)
Land area: 43.0 sq. mi. Water area: 0.0 sq. mi.
Population density: 34 people per square mile
(very low).
OSM Map
General Map
Google Map
MSN Map
OSM Map
General Map
Google Map
MSN Map
OSM Map
General Map
Google Map
MSN Map
OSM Map
General Map
Google Map
MSN Map
Please wait while loading the map...
Real estate property taxes paid for housing units in 2022:
This zip code:
0.4% ($1,237)
Oregon:
0.8% ($3,646)
Median real estate property taxes paid for housing units with mortgages in 2022: $1,242 (0.3%) Median real estate property taxes paid for housing units with no mortgage in 2022: $1,213 (0.6%)
Business Search- 14 Million verified businesses
Males: 579
(39.7%)
Females: 881
(60.3%)
For population 25 years and over in 97347:
High school or higher: 70.1%
Bachelor's degree or higher: 6.5%
Graduate or professional degree: 2.7%
Unemployed: 5.7%
Mean travel time to work (commute): 33.1 minutes
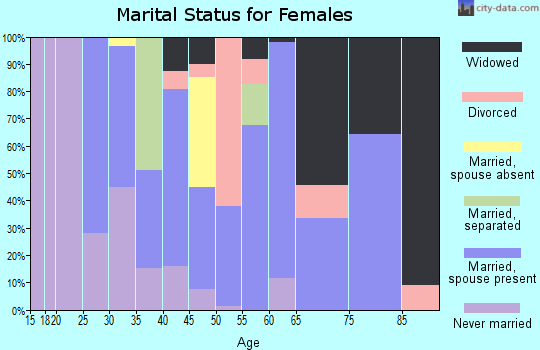
For population 15 years and over in 97347:
Never married: 31.1%
Now married: 42.9%
Separated: 5.6%
Widowed: 7.8%
Divorced: 12.6%
Zip code 97347 compared to state average:
Median household income significantly below state average.
Black race population percentage significantly below state average.
Hispanic race population percentage below state average.
Median age significantly above state average.
Foreign-born population percentage significantly below state average.
Renting percentage above state average.
Length of stay since moving in significantly above state average.
House age below state average.
Number of college students significantly below state average.
Percentage of population with a bachelor's degree or higher significantly below state average.
Averages for the 2020 tax year for zip code 97347, filed in 2021:
Average Adjusted Gross Income (AGI) in 2020: $45,983 (Individual Income Tax Returns)
Here:
$45,983
State:
$76,001
Salary/wage: $40,468 (reported on 77.4% of returns)
Here:
$40,468
State:
$61,959
(% of AGI for various income ranges: 1230.5% for AGIs below $25k, 4000.5% for AGIs $25k-50k, 6437.5% for AGIs $50k-75k, 14390.0% for AGIs $75k-100k, 18724.0% for AGIs $100k-200k)
Taxable interest for individuals: $810 (reported on 22.6% of returns)
This zip code:
$810
Oregon:
$1,628
(% of AGI for various income ranges: 8.6% for AGIs below $25k, 51.1% for AGIs $25k-50k, 38.8% for AGIs $50k-75k, 46.0% for AGIs $100k-200k)
Ordinary dividends: $1,020 (reported on 5.4% of returns)
Here:
$1,020
State:
$7,165
(% of AGI for various income ranges: 15.5% for AGIs below $25k, 56.7% for AGIs $75k-100k)
Net capital gain/loss in AGI: +$7,585 (reported on 14.0% of returns)
Here:
+$7,585
State:
+$23,403
(% of AGI for various income ranges: 19.5% for AGIs below $25k, 68.9% for AGIs $25k-50k, 1624.0% for AGIs $100k-200k)
Profit/loss from business: +$3,812 (reported on 8.6% of returns)
Here:
+$3,812
State:
+$16,511
(% of AGI for various income ranges: 47.7% for AGIs below $25k, 71.1% for AGIs $25k-50k, 216.7% for AGIs $75k-100k)
Taxable individual retirement arrangement distribution: $9,080 (reported on 5.4% of returns)
97347:
$9,080
Oregon:
$20,730
(% of AGI for various income ranges: 238.9% for AGIs $25k-50k)
Total itemized deductions: $29,075 (reported on 4.3% of returns)
Here:
$29,075
State:
$31,050
(% of AGI for various income ranges: 246.4% for AGIs below $25k, 1242.0% for AGIs $100k-200k)
Taxes paid: $6,475 (reported on 4.3% of returns)
97347:
$6,475
State:
$8,487
(% of AGI for various income ranges: 37.7% for AGIs below $25k, 352.0% for AGIs $100k-200k)
Earned income credit: $2,322 (reported on 19.4% of returns)
Here:
$2,322
State:
$1,977
(% of AGI for various income ranges: 129.5% for AGIs below $25k, 70.0% for AGIs $25k-50k)
Percentage of individuals using paid preparers for their 2020 taxes: 89.2%
Here:
89%
State:
93%
(% for various income ranges: 86.8% for AGIs below $25k, 92.6% for AGIs $25k-50k, 91.7% for AGIs $50k-75k, 71.4% for AGIs $75k-100k, 100.0% for AGIs $100k-200k)
Averages for the 2012 tax year for zip code 97347, filed in 2013:
Average Adjusted Gross Income (AGI) in 2012: $37,924 (Individual Income Tax Returns)
Here:
$37,924
State:
$57,845
Salary/wage: $31,693 (reported on 78.9% of returns)
Here:
$31,693
State:
$47,723
(% of AGI for various income ranges: 58.3% for AGIs below $25k, 73.4% for AGIs $25k-50k, 74.8% for AGIs $50k-75k, 69.8% for AGIs $75k-100k, 51.4% for AGIs $100k-200k)
Taxable interest for individuals: $571 (reported on 23.9% of returns)
This zip code:
$571
Oregon:
$1,848
(% of AGI for various income ranges: 1.0% for AGIs below $25k, 0.3% for AGIs $25k-50k, 0.1% for AGIs $50k-75k, 0.6% for AGIs $75k-100k)
Ordinary dividends: $480 (reported on 7.0% of returns)
Here:
$480
State:
$5,987
Net capital gain/loss in AGI: +$480 (reported on 14.1% of returns)
Here:
+$480
State:
+$13,095
(% of AGI for various income ranges: 0.5% for AGIs $25k-50k, 0.2% for AGIs $50k-75k)
Profit/loss from business: +$6,400 (reported on 12.7% of returns)
Here:
+$6,400
State:
+$13,871
(% of AGI for various income ranges: 4.8% for AGIs below $25k, 1.5% for AGIs $25k-50k, 4.5% for AGIs $50k-75k)
Taxable individual retirement arrangement distribution: $8,360 (reported on 7.0% of returns)
97347:
$8,360
Oregon:
$16,036
Total itemized deductions: $17,469 (26% of AGI, reported on 22.5% of returns)
Here:
$17,469
State:
$24,430
Here:
26.2% of AGI
State:
23.2% of AGI
(% of AGI for various income ranges: 12.4% for AGIs $25k-50k, 10.5% for AGIs $50k-75k, 16.0% for AGIs $75k-100k, 12.0% for AGIs $100k-200k)
Charity contributions: $1,700 (reported on 15.5% of returns)
Here:
$1,700
State:
$3,648
(% of AGI for various income ranges: 0.6% for AGIs $25k-50k, 1.0% for AGIs $50k-75k, 1.1% for AGIs $75k-100k, 0.7% for AGIs $100k-200k)
Taxes paid: $5,340 (reported on 21.1% of returns)
97347:
$5,340
State:
$10,269
(% of AGI for various income ranges: 2.0% for AGIs $25k-50k, 3.0% for AGIs $50k-75k, 5.1% for AGIs $75k-100k, 5.1% for AGIs $100k-200k)
Earned income credit: $2,488 (reported on 22.5% of returns)
Here:
$2,488
State:
$2,021
(% of AGI for various income ranges: 6.7% for AGIs below $25k, 1.4% for AGIs $25k-50k)
Percentage of individuals using paid preparers for their 2012 taxes: 52.1%
Here:
52%
State:
47%
(% for various income ranges: 50.0% for AGIs below $25k, 50.0% for AGIs $25k-50k, 55.6% for AGIs $50k-75k, 50.0% for AGIs $75k-100k, 75.0% for AGIs $100k-200k)
Averages for the 2004 tax year for zip code 97347, filed in 2005:
Average Adjusted Gross Income (AGI) in 2004: $33,787 (Individual Income Tax Returns)
Here:
$33,787
State:
$46,788
Salary/wage: $29,619 (reported on 79.5% of returns)
Here:
$29,619
State:
$39,788
(% of AGI for various income ranges: 52.3% for AGIs below $10k, 67.9% for AGIs $10k-25k, 79.1% for AGIs $25k-50k, 75.2% for AGIs $50k-75k, 70.6% for AGIs $75k-100k, 33.0% for AGIs over 100k)
Taxable interest for individuals: $701 (reported on 31.0% of returns)
This zip code:
$701
Oregon:
$2,126
(% of AGI for various income ranges: 5.5% for AGIs below $10k, 0.6% for AGIs $10k-25k, 0.4% for AGIs $25k-50k, 0.3% for AGIs $50k-75k, 0.5% for AGIs $75k-100k, 1.1% for AGIs over 100k)
Taxable dividends: $234 (reported on 11.9% of returns)
Here:
$234
State:
$3,427
(% of AGI for various income ranges: 0.3% for AGIs below $10k, 0.1% for AGIs $10k-25k, 0.0% for AGIs $25k-50k, 0.1% for AGIs $50k-75k, 0.1% for AGIs $75k-100k)
Net capital gain/loss: +$13,306 (reported on 13.1% of returns)
Here:
+$13,306
State:
+$12,447
(% of AGI for various income ranges: -1.4% for AGIs below $10k, 0.1% for AGIs $10k-25k, 0.1% for AGIs $25k-50k, 1.9% for AGIs $50k-75k, 36.0% for AGIs $75k-100k)
Profit/loss from business: +$7,365 (reported on 13.1% of returns)
Here:
+$7,365
State:
+$11,682
(% of AGI for various income ranges: 6.0% for AGIs below $10k, 2.5% for AGIs $10k-25k, 3.1% for AGIs $25k-50k, 5.0% for AGIs $50k-75k)
Total itemized deductions: $15,863 (28% of AGI, reported on 28.2% of returns)
Here:
$15,863
State:
$20,209
Here:
28.2% of AGI
State:
24.7% of AGI
(% of AGI for various income ranges: 12.3% for AGIs $10k-25k, 10.4% for AGIs $25k-50k, 15.8% for AGIs $50k-75k, 13.0% for AGIs $75k-100k, 20.6% for AGIs over 100k)
Charity contributions deductions: $3,126 (5% of AGI, reported on 19.6% of returns)
Here:
$3,126
State:
$3,145
Here:
5.1% of AGI
State:
3.6% of AGI
(% of AGI for various income ranges: 1.3% for AGIs $10k-25k, 0.6% for AGIs $25k-50k, 1.4% for AGIs $50k-75k, 1.1% for AGIs $75k-100k, 8.7% for AGIs over 100k)
Total tax: $3,541 (reported on 71.3% of returns)
97347:
$3,541
State:
$7,148
(% of AGI for various income ranges: 3.5% for AGIs below $10k, 3.4% for AGIs $10k-25k, 6.2% for AGIs $25k-50k, 8.3% for AGIs $50k-75k, 10.6% for AGIs $75k-100k, 12.4% for AGIs over 100k)
Earned income credit: $1,669 (reported on 18.2% of returns)
Here:
$1,669
State:
$1,605
Percentage of individuals using paid preparers for their 2004 taxes: 55.7%
Here:
56%
State:
53%
(% for various income ranges: 49.6% for AGIs below $10k, 56.0% for AGIs $10k-25k, 54.4% for AGIs $25k-50k, 61.7% for AGIs $50k-75k, 58.8% for AGIs $75k-100k, 75.0% for AGIs over 100k)
Likely homosexual households (counted as self-reported same-sex unmarried-partner households)
Lesbian couples: 0.2% of all households
Gay men: 0.0% of all households
Household received Food Stamps/SNAP in the past 12 months: 329 Household did not receive Food Stamps/SNAP in the past 12 months: 295
Women who had a birth in the past 12 months: 82 (3 now married, 77 unmarried) Women who did not have a birth in the past 12 months: 262 (96 now married, 167 unmarried)
Housing units in zip code 97347 with a mortgage: 172 (5 second mortgage, 5 both second mortgage and home equity loan) Median monthly owner costs for units with a mortgage: $1,292 Median monthly owner costs for units without a mortgage: $444
Residents with income below the poverty level in 2022:
This zip code:
36.5%
Whole state:
12.1%
Residents with income below 50% of the poverty level in 2022:
This zip code:
22.9%
Whole state:
6.2%
Median number of rooms in houses and condos:
Here:
6.4
State:
6.2
Median number of rooms in apartments:
Here:
3.7
State:
4.0
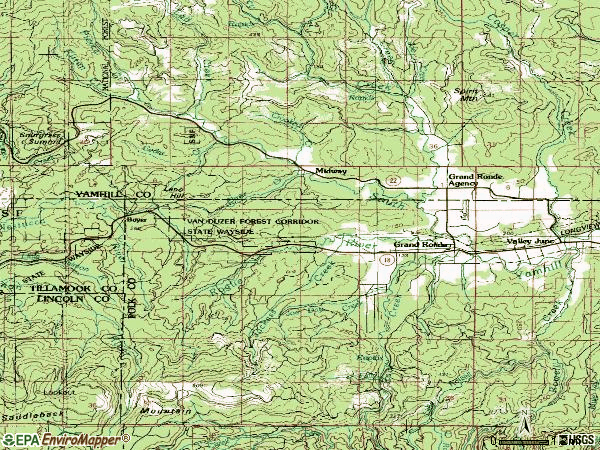
Notable locations in this zip code not listed on our city pages
Notable locations in zip code 97347: Spirit Mountain Rodeo Grounds (A), Grand Ronde Sanitary District (B), Rock Creek Hideout (C), West Valley Fire District Substation (D), Confederated Tribes of Grand Ronde (E). Display/hide their locations on the map
Rivers and creeks: Kitten Creek (A), Joe Day Creek (B), Jackass Creek (C), Hanchet Creek (D), Elmer Creek (E), Ead Creek (F), Crooked Creek (G), Agency Creek (H), Cow Creek (I). Display/hide their locations on the map
In group quarters: 13 (-1 institutionalized population)
Size of family households: 213 2-persons, 151 3-persons, 48 4-persons, 4 5-persons, 8 6-persons, 10 7-or-more-persons
Size of nonfamily households: 135 1-person, 27 2-persons, 3 3-persons
114 married couples with children.
149 single-parent households (35 men, 114 women).
94.4% of residents of 97347 zip code speak English at home.
1.5% of residents speak Spanish at home (65% very well, 35% well).
0.1% of residents speak other Indo-European language at home (100% very well).
1.3% of residents speak Asian or Pacific Island language at home (33% very well, 28% well, 39% not well).
2.1% of residents speak other language at home (75% very well, 11% well, 14% not well).
Foreign born population: 28 (2.0%) (24.2% of them are naturalized citizens)
This zip code:
2.0%
Whole state:
9.9%
25%Bhutan
21%Honduras
7%Micronesia
5%American
3%Dutch
3%English
2%European
2%German
2%Hungarian
1%Scotch-Irish
Year of entry for the foreign-born population
172010 or later
02000 to 2009
11990 to 1999
10Before 1990
Facilities with environmental interests located in this zip code:
FORT HILL LUMBER COMPANY (8900 FORT HILL ROAD in GRAND RONDE, OR)
AIR MINOR (AIRS/AFS) COMPLIANCE ACTIVITY (Tracking inspections of insecticide, fungicide, and rodenticide, and toxic substances) CRITERIA AND HAZARDOUS AIR POLLUTANT INVENTORY (Inventory of air pollution sources) STATE MASTER (Oregon inspections and permits database) - OR-ACSIS-273001, AIR PROGRAM STATE MASTER (Oregon inspections and permits database) - OR-SIS-30585-10270, NPDES STORMWATER PERMIT, OR-SIS-30585-10271, NPDES NON-MAJOR, OR-SIS-30585-10269, NPDES STORMWATER PERMIT, ACSIS-273001-, AIR PROGRAM STATE MASTER (Oregon inspections and permits database) - OR-ECSI-359, SUPERFUND, OR-LUST-27-91-4059, LEAKING STORAGE TANK National Pollutant Discharge Elimination System NON-MAJOR (Tracking pollutant discharge elimination systems) - permit (Resource Conservation and Recovery Act (tracking hazardous waste)) TRI REPORTER (Tracking of toxic chemicals releasing facilities) Business SIC classification: SAWMILLS AND PLANING MILLS, GENERAL; STEAM AND AIR-CONDITIONING SUPPLY Business NAICS classification: SAWMILLS.; SAWMILLS.; SAWMILLS.; CUT STOCK, RESAWING LUMBER, AND PLANING.; CUT STOCK, RESAWING LUMBER, AND PLANING.; CUT STOCK, RESAWING LUMBER, AND PLANING.; OTHER MILLWORK (INCLUDING FLOORING ).; OTHER MILLWORK (INCLUDING FLOORING ).; OTHER MILLWORK (INCLUDING FLOORING ).; ALL OTHER MISCELLANEOUS WOOD PRODUCT MANUFACTURING.; ALL OTHER MISCELLANEOUS WOOD PRODUCT MANUFACTURING.; ALL OTHER MISCELLANEOUS WOOD PRODUCT MANUFACTURING. Organizations: WILLAMINA LUMBER CO. (CONTACT/GENERAL)
, HAMPTON LUMBER MILLS, INC. (CONTACT/GENERAL)
ERICKSON HARDWOOD CO (29695 SALMON RIV HWY in GRAND RONDE, OR)
COMPLIANCE ACTIVITY (Tracking inspections of insecticide, fungicide, and rodenticide, and toxic substances) STATE MASTER (Oregon inspections and permits database) - OR-ECSI-1085, SUPERFUND (Resource Conservation and Recovery Act (tracking hazardous waste)) Business SIC classification: SAWMILLS AND PLANING MILLS, GENERAL; HARDWOOD VENEER AND PLYWOOD Business NAICS classification: SAWMILLS.; HARDWOOD VENEER AND PLYWOOD MANUFACTURING.; CUT STOCK, RESAWING LUMBER, AND PLANING.; OTHER MILLWORK (INCLUDING FLOORING ).; ALL OTHER MISCELLANEOUS WOOD PRODUCT MANUFACTURING. Organizations: LARRY TANNER (CONTACT/OWNER)
GRAND RONDE SANITARY DISTRICT (8630 GRAND RONDE ROAD in GRAND RONDE, OR)
STATE MASTER (Oregon inspections and permits database) - OR-SIS-100050-100116, NPDES NON-MAJOR, OR-SIS-100050-100845, OR-SIS-100050-101429, National Pollutant Discharge Elimination System NON-MAJOR (Tracking pollutant discharge elimination systems) - permit Business SIC classification: SEWERAGE SYSTEMS
GRAND RONDE ELEM. SCHOOL (8720 GRAND RONDE RD in GRAND RONDE, OR)
(National Center for Education Statistics) - STATE ID-1223 Organizations: WILLAMINA SCH DIST 30J (SCHOOL DISTRICT)
ELDER HOUSING SEWER TREATMENT (28450 TYEE ROAD in GRAND RONDE, OR)
National Pollutant Discharge Elimination System NON-MAJOR (Tracking pollutant discharge elimination systems) - permit Business SIC classification: SEWERAGE SYSTEMS Organizations: GRAND RONDE HOUSING AUTHORITY (CONTACT/OPERATOR)
Alternative names: GRAND RONDE HOUSING AUTHORITY
GRAND RONDE PHASE II & III (28450 TYEE ROAD in GRAND RONDE, OR)
National Pollutant Discharge Elimination System NON-MAJOR (Tracking pollutant discharge elimination systems) - permit Business SIC classification: SEWERAGE SYSTEMS Organizations: GRANDE RONDE HOUSING AUTHORITY (CONTACT/OPERATOR)
, GRAND RONDE HOUSING AUTHORITY (CONTACT/OWNER)
Alternative names: GRAND RONDE HOUSING AUTHORITY
H. R. JONES VENEER, INCORPORATED (28925 SALMON RIVER HIGHWAY in GRANDE RONDE, OR)
CRITERIA AND HAZARDOUS AIR POLLUTANT INVENTORY (Inventory of air pollution sources) Business SIC and NAICS classification: HARDWOOD VENEER AND PLYWOOD
Housing units lacking complete plumbing facilities: 0.4% Housing units lacking complete kitchen facilities: 2.6%
38.2%Electricity
30.5%Utility gas
23.3%Wood
5.3%Other fuel
2.2%Bottled, tank, or LP gas
1.0%Fuel oil, kerosene, etc.
Population in 1990: 1,151. Population change in the 1990s: +424 (+36.8%).
Place of birth for U.S.-born residents:
This state: 927
Northeast: 38
Midwest: 44
South: 41
West: 377
59% of the 97347 zip code residents lived in the same house 5 years ago. Out of people who lived in different houses, 32% lived in this county. Out of people who lived in different counties, 50% lived in Oregon.
95% of the 97347 zip code residents lived in the same house 1 year ago. Out of people who lived in different houses, 38% moved from this county. Out of people who lived in different houses, 73% moved from different county within same state. Out of people who lived in different houses, 2% moved from abroad.
Private vs. public school enrollment:
Students in private schools in grades 1 to 8 (elementary and middle school): 10
Here:
11.5%
Oregon:
13.7%
Students in private schools in grades 9 to 12 (high school):
Here:
2.2%
Oregon:
8.8%
Students in private undergraduate colleges:
Here:
0.0%
Oregon:
17.7%
Occupation by median earnings in the past 12 months ($)
47,134Production occupations
40,274Office and administrative support occupations
38,246Business and financial operations occupations
34,769Sales and related occupations
30,543Building and grounds cleaning and maintenance occupations
25,268Arts, design, entertainment, sports, and media occupations
Top industries in this zip code by the number of employees in 2005:
Utilities: Water Supply and Irrigation Systems (5-9 employees: 1 establishment)
Accommodation and Food Services: Full-Service Restaurants (5-9: 1)
Construction: New Single-Family Housing Construction (except Operative Builders) (1-4: 2)
Administrative and Support and Waste Management and Remediation Services: Travel Agencies (1-4: 1)
Construction: Poured Concrete Foundation and Structure Contractors (1-4: 1)
Administrative and Support and Waste Management and Remediation Services: Landscaping Services (1-4: 1)
Fatal accident statistics in 2014:
Fatal accident count: 1
Vehicles involved in fatal accidents: 2
Fatal accidents caused by drunken drivers: 1
Fatalities: 1
Persons involved in fatal accidents: 3
Pedestrians involved in fatal accidents: 0
Fatal accident statistics in 2010:
Fatal accident count: 1
Vehicles involved in fatal accidents: 2
Fatal accidents caused by drunken drivers: 0
Fatalities: 1
Persons involved in fatal accidents: 3
Pedestrians involved in fatal accidents: 0
Home Mortgage Disclosure Act Aggregated Statistics For Year 2009 (Based on 2 partial tracts)
A) FHA, FSA/RHS & VA Home Purchase Loans
B) Conventional Home Purchase Loans
C) Refinancings
D) Home Improvement Loans
F) Non-occupant Loans on < 5 Family Dwellings (A B C & D)
G) Loans On Manufactured Home Dwelling (A B C & D)
Number
Average Value
Number
Average Value
Number
Average Value
Number
Average Value
Number
Average Value
Number
Average Value
LOANS ORIGINATED
6
$164,368
2
$133,185
19
$176,507
1
$140,270
2
$137,615
4
$126,410
APPLICATIONS APPROVED, NOT ACCEPTED
0
$0
0
$0
4
$141,918
1
$50,640
0
$0
1
$91,150
APPLICATIONS DENIED
1
$203,830
1
$173,440
18
$197,721
2
$85,455
2
$80,520
2
$172,935
APPLICATIONS WITHDRAWN
1
$86,090
1
$260,800
8
$179,550
0
$0
1
$64,060
1
$244,590
FILES CLOSED FOR INCOMPLETENESS
0
$0
0
$0
1
$171,160
1
$52,920
0
$0
0
$0
Aggregated Statistics For Year 2008 (Based on 2 partial tracts)
A) FHA, FSA/RHS & VA Home Purchase Loans
B) Conventional Home Purchase Loans
C) Refinancings
D) Home Improvement Loans
F) Non-occupant Loans on < 5 Family Dwellings (A B C & D)
G) Loans On Manufactured Home Dwelling (A B C & D)
Number
Average Value
Number
Average Value
Number
Average Value
Number
Average Value
Number
Average Value
Number
Average Value
LOANS ORIGINATED
5
$162,756
7
$153,006
25
$160,519
3
$73,090
5
$118,650
6
$155,550
APPLICATIONS APPROVED, NOT ACCEPTED
1
$121,030
1
$147,620
3
$147,953
0
$0
1
$147,620
1
$146,100
APPLICATIONS DENIED
2
$120,395
3
$182,473
20
$165,884
5
$77,024
1
$222,560
4
$171,290
APPLICATIONS WITHDRAWN
1
$132,420
1
$162,550
8
$167,966
0
$0
1
$84,060
1
$173,700
FILES CLOSED FOR INCOMPLETENESS
0
$0
1
$62,290
1
$149,890
0
$0
0
$0
1
$116,980
Aggregated Statistics For Year 2007 (Based on 2 partial tracts)
A) FHA, FSA/RHS & VA Home Purchase Loans
B) Conventional Home Purchase Loans
C) Refinancings
D) Home Improvement Loans
F) Non-occupant Loans on < 5 Family Dwellings (A B C & D)
G) Loans On Manufactured Home Dwelling (A B C & D)
Number
Average Value
Number
Average Value
Number
Average Value
Number
Average Value
Number
Average Value
Number
Average Value
LOANS ORIGINATED
5
$178,404
21
$132,230
23
$141,308
5
$83,910
5
$163,922
7
$139,441
APPLICATIONS APPROVED, NOT ACCEPTED
1
$65,830
4
$122,928
6
$184,963
1
$44,310
1
$136,220
1
$144,320
APPLICATIONS DENIED
2
$146,095
7
$156,514
28
$150,934
5
$79,758
3
$101,703
4
$157,870
APPLICATIONS WITHDRAWN
1
$144,070
3
$131,917
9
$139,626
1
$30,380
1
$81,780
1
$90,900
FILES CLOSED FOR INCOMPLETENESS
0
$0
1
$105,330
3
$138,417
0
$0
0
$0
0
$0
Aggregated Statistics For Year 2006 (Based on 2 partial tracts)
A) FHA, FSA/RHS & VA Home Purchase Loans
B) Conventional Home Purchase Loans
C) Refinancings
D) Home Improvement Loans
F) Non-occupant Loans on < 5 Family Dwellings (A B C & D)
G) Loans On Manufactured Home Dwelling (A B C & D)
Number
Average Value
Number
Average Value
Number
Average Value
Number
Average Value
Number
Average Value
Number
Average Value
LOANS ORIGINATED
3
$126,177
24
$116,958
24
$132,392
4
$59,122
6
$99,592
5
$127,460
APPLICATIONS APPROVED, NOT ACCEPTED
0
$0
6
$111,028
7
$150,763
0
$0
1
$163,570
2
$120,775
APPLICATIONS DENIED
1
$84,060
11
$135,278
25
$121,496
3
$139,937
4
$159,642
5
$140,222
APPLICATIONS WITHDRAWN
1
$124,830
6
$82,838
18
$132,888
2
$45,955
3
$99,760
1
$67,100
FILES CLOSED FOR INCOMPLETENESS
0
$0
1
$58,490
4
$135,210
0
$0
2
$85,330
0
$0
Aggregated Statistics For Year 2005 (Based on 2 partial tracts)
A) FHA, FSA/RHS & VA Home Purchase Loans
B) Conventional Home Purchase Loans
C) Refinancings
D) Home Improvement Loans
F) Non-occupant Loans on < 5 Family Dwellings (A B C & D)
G) Loans On Manufactured Home Dwelling (A B C & D)
Number
Average Value
Number
Average Value
Number
Average Value
Number
Average Value
Number
Average Value
Number
Average Value
LOANS ORIGINATED
4
$125,968
29
$106,064
25
$106,749
3
$52,327
6
$107,103
4
$119,952
APPLICATIONS APPROVED, NOT ACCEPTED
1
$119,760
5
$89,836
6
$97,903
1
$41,520
1
$45,580
1
$132,420
APPLICATIONS DENIED
1
$132,930
13
$96,547
27
$118,910
6
$35,617
3
$91,573
5
$103,204
APPLICATIONS WITHDRAWN
1
$103,810
8
$116,756
20
$122,131
0
$0
2
$115,080
2
$160,400
FILES CLOSED FOR INCOMPLETENESS
0
$0
1
$82,540
2
$113,435
0
$0
0
$0
0
$0
Aggregated Statistics For Year 2004 (Based on 2 partial tracts)
A) FHA, FSA/RHS & VA Home Purchase Loans
B) Conventional Home Purchase Loans
C) Refinancings
D) Home Improvement Loans
F) Non-occupant Loans on < 5 Family Dwellings (A B C & D)
G) Loans On Manufactured Home Dwelling (A B C & D)
Number
Average Value
Number
Average Value
Number
Average Value
Number
Average Value
Number
Average Value
Number
Average Value
LOANS ORIGINATED
3
$106,513
16
$99,792
25
$101,027
3
$48,023
4
$92,735
4
$103,938
APPLICATIONS APPROVED, NOT ACCEPTED
0
$0
4
$118,118
7
$86,703
1
$27,090
1
$96,470
1
$68,870
APPLICATIONS DENIED
1
$53,680
7
$102,437
21
$108,852
2
$44,435
2
$103,810
3
$100,350
APPLICATIONS WITHDRAWN
0
$0
2
$157,615
13
$111,291
2
$60,640
1
$95,710
1
$140,780
FILES CLOSED FOR INCOMPLETENESS
1
$50,390
1
$72,670
1
$78,240
0
$0
0
$0
0
$0
Aggregated Statistics For Year 2003 (Based on 2 partial tracts)
A) FHA, FSA/RHS & VA Home Purchase Loans
B) Conventional Home Purchase Loans
C) Refinancings
D) Home Improvement Loans
F) Non-occupant Loans on < 5 Family Dwellings (A B C & D)
Detailed PMIC statistics for the following Tracts:0305.02
2002 - 2018 National Fire Incident Reporting System (NFIRS) incidents
According to the data from the years 2002 - 2018 the average number of fires per year is 15. The highest number of reported fires - 24 took place in 2012, and the least - 2 in 2017. The data has a rising trend.
When looking into fire subcategories, the most incidents belonged to: Outside Fires (37.7%), and Structure Fires (36.0%).
Fire incident types reported to NFIRS in Zip Code 97347


 Nearest zip codes: 97396, 97122, 97108, 97378, 97368, 97344.


 According to the data from the years 2002 - 2018 the average number of fires per year is 15. The highest number of reported fires - 24 took place in 2012, and the least - 2 in 2017. The data has a rising trend.
 When looking into fire subcategories, the most incidents belonged to: Outside Fires (37.7%), and Structure Fires (36.0%).