Estimated zip code population in 2022: 3,469 Zip code population in 2010: 3,061 Zip code population in 2000: 2,785
Houses and condos: 1,311 Renter-occupied apartments: 145
% of renters here:
11%
State:
36%
March 2022 cost of living index in zip code 98240: 90.8 (less than average, U.S. average is 100)
Land area: 20.7 sq. mi. Water area: 0.0 sq. mi.
Population density: 168 people per square mile
(very low).
OSM Map
General Map
Google Map
MSN Map
OSM Map
General Map
Google Map
MSN Map
OSM Map
General Map
Google Map
MSN Map
OSM Map
General Map
Google Map
MSN Map
Please wait while loading the map...
Real estate property taxes paid for housing units in 2022:
This zip code:
0.5% ($3,033)
Washington:
0.8% ($4,283)
Median real estate property taxes paid for housing units with mortgages in 2022: $2,987 (0.5%) Median real estate property taxes paid for housing units with no mortgage in 2022: $3,309 (0.6%)
Estimated median house/condo value in 2022: $614,011
98240:
$614,011
Washington:
$569,500
According to our research of Washington and other state lists, there were 3 registered sex offenders living in 98240 zip code as of May 24, 2024. The ratio of all residents to sex offenders in zip code 98240 is 1,048 to 1. The ratio of registered sex offenders to all residents in this zip code is near the state average.
Median resident age:
This zip code:
41.1 years
Washington median age:
38.4 years
Average household size:
This zip code:
2.7 people
Washington:
2.5 people
Averages for the 2020 tax year for zip code 98240, filed in 2021:
Average Adjusted Gross Income (AGI) in 2020: $70,041 (Individual Income Tax Returns)
Here:
$70,041
State:
$99,264
Salary/wage: $57,947 (reported on 79.2% of returns)
Here:
$57,947
State:
$80,347
(% of AGI for various income ranges: 1141.2% for AGIs below $25k, 3658.5% for AGIs $25k-50k, 6835.3% for AGIs $50k-75k, 9942.3% for AGIs $75k-100k, 17268.8% for AGIs $100k-200k, 41355.0% for AGIs over 200k)
Taxable interest for individuals: $1,059 (reported on 37.5% of returns)
This zip code:
$1,059
Washington:
$2,077
(% of AGI for various income ranges: 12.8% for AGIs below $25k, 18.9% for AGIs $25k-50k, 59.5% for AGIs $50k-75k, 53.8% for AGIs $75k-100k, 113.5% for AGIs $100k-200k, 995.0% for AGIs over 200k)
Ordinary dividends: $7,300 (reported on 15.5% of returns)
Here:
$7,300
State:
$10,013
(% of AGI for various income ranges: 37.2% for AGIs below $25k, 48.1% for AGIs $25k-50k, 38.4% for AGIs $50k-75k, 163.1% for AGIs $75k-100k, 325.9% for AGIs $100k-200k, 4050.0% for AGIs over 200k)
Net capital gain/loss in AGI: +$37,643 (reported on 16.7% of returns)
Here:
+$37,643
State:
+$40,092
(% of AGI for various income ranges: 9.7% for AGIs below $25k, 17.4% for AGIs $25k-50k, 81.1% for AGIs $50k-75k, 142.3% for AGIs $75k-100k, 1040.0% for AGIs $100k-200k, 41775.0% for AGIs over 200k)
Profit/loss from business: +$9,368 (reported on 14.9% of returns)
Here:
+$9,368
State:
+$18,312
(% of AGI for various income ranges: 126.2% for AGIs below $25k, 72.6% for AGIs $25k-50k, 100.0% for AGIs $50k-75k, 422.3% for AGIs $75k-100k, 590.0% for AGIs $100k-200k)
Taxable individual retirement arrangement distribution: $21,278 (reported on 10.7% of returns)
98240:
$21,278
Washington:
$24,221
(% of AGI for various income ranges: 76.2% for AGIs below $25k, 96.7% for AGIs $25k-50k, 292.1% for AGIs $50k-75k, 392.3% for AGIs $75k-100k, 1329.4% for AGIs $100k-200k)
Total itemized deductions: $31,346 (reported on 7.7% of returns)
Here:
$31,346
State:
$39,068
(% of AGI for various income ranges: 180.3% for AGIs below $25k, 267.9% for AGIs $50k-75k, 384.6% for AGIs $75k-100k, 722.9% for AGIs $100k-200k, 6300.0% for AGIs over 200k)
Charity contributions: $9,144 (reported on 5.4% of returns)
Here:
$9,144
State:
$15,331
(% of AGI for various income ranges: 83.2% for AGIs $50k-75k, 145.9% for AGIs $100k-200k, 2085.0% for AGIs over 200k)
Taxes paid: $6,500 (reported on 7.7% of returns)
98240:
$6,500
State:
$7,774
(% of AGI for various income ranges: 30.3% for AGIs below $25k, 60.5% for AGIs $50k-75k, 76.9% for AGIs $75k-100k, 174.1% for AGIs $100k-200k, 1185.0% for AGIs over 200k)
Earned income credit: $1,724 (reported on 10.1% of returns)
Here:
$1,724
State:
$2,020
(% of AGI for various income ranges: 56.9% for AGIs below $25k, 41.1% for AGIs $25k-50k)
Percentage of individuals using paid preparers for their 2020 taxes: 91.1%
Here:
91%
State:
93%
(% for various income ranges: 89.6% for AGIs below $25k, 88.9% for AGIs $25k-50k, 92.9% for AGIs $50k-75k, 90.0% for AGIs $75k-100k, 93.3% for AGIs $100k-200k, 100.0% for AGIs over 200k)
Averages for the 2012 tax year for zip code 98240, filed in 2013:
Average Adjusted Gross Income (AGI) in 2012: $57,306 (Individual Income Tax Returns)
Here:
$57,306
State:
$69,533
Salary/wage: $48,012 (reported on 82.8% of returns)
Here:
$48,012
State:
$57,267
(% of AGI for various income ranges: 75.9% for AGIs below $25k, 69.9% for AGIs $25k-50k, 70.7% for AGIs $50k-75k, 75.4% for AGIs $75k-100k, 80.8% for AGIs $100k-200k, 33.1% for AGIs over 200k)
Taxable interest for individuals: $1,137 (reported on 39.3% of returns)
This zip code:
$1,137
Washington:
$1,816
(% of AGI for various income ranges: 0.9% for AGIs below $25k, 0.7% for AGIs $25k-50k, 1.3% for AGIs $50k-75k, 0.3% for AGIs $75k-100k, 1.1% for AGIs $100k-200k)
Ordinary dividends: $5,552 (reported on 17.2% of returns)
Here:
$5,552
State:
$8,163
(% of AGI for various income ranges: 2.2% for AGIs below $25k, 0.8% for AGIs $25k-50k, 0.7% for AGIs $50k-75k, 0.4% for AGIs $75k-100k, 4.2% for AGIs $100k-200k)
Net capital gain/loss in AGI: +$10,835 (reported on 13.8% of returns)
Here:
+$10,835
State:
+$21,568
(% of AGI for various income ranges: 0.4% for AGIs $50k-75k, 9.2% for AGIs $100k-200k)
Profit/loss from business: +$11,279 (reported on 16.6% of returns)
Here:
+$11,279
State:
+$16,521
(% of AGI for various income ranges: 5.6% for AGIs below $25k, 4.6% for AGIs $25k-50k, 2.7% for AGIs $50k-75k, 5.3% for AGIs $75k-100k, 2.6% for AGIs $100k-200k)
Taxable individual retirement arrangement distribution: $13,913 (reported on 10.3% of returns)
98240:
$13,913
Washington:
$18,648
(% of AGI for various income ranges: 3.8% for AGIs below $25k, 3.4% for AGIs $25k-50k, 5.9% for AGIs $50k-75k, 2.6% for AGIs $100k-200k)
Total itemized deductions: $20,534 (21% of AGI, reported on 32.4% of returns)
Here:
$20,534
State:
$23,872
Here:
21.1% of AGI
State:
18.2% of AGI
(% of AGI for various income ranges: 12.6% for AGIs below $25k, 10.3% for AGIs $25k-50k, 11.4% for AGIs $50k-75k, 13.9% for AGIs $75k-100k, 13.1% for AGIs $100k-200k, 6.9% for AGIs over 200k)
Charity contributions: $3,412 (reported on 23.4% of returns)
Here:
$3,412
State:
$4,465
(% of AGI for various income ranges: 1.0% for AGIs below $25k, 0.7% for AGIs $25k-50k, 1.0% for AGIs $50k-75k, 1.6% for AGIs $75k-100k, 1.5% for AGIs $100k-200k, 2.3% for AGIs over 200k)
Taxes paid: $5,302 (reported on 32.4% of returns)
98240:
$5,302
State:
$6,400
(% of AGI for various income ranges: 2.5% for AGIs below $25k, 2.3% for AGIs $25k-50k, 2.6% for AGIs $50k-75k, 3.2% for AGIs $75k-100k, 4.2% for AGIs $100k-200k, 1.8% for AGIs over 200k)
Earned income credit: $1,945 (reported on 13.8% of returns)
Here:
$1,945
State:
$2,073
(% of AGI for various income ranges: 4.4% for AGIs below $25k, 1.0% for AGIs $25k-50k)
Percentage of individuals using paid preparers for their 2012 taxes: 45.5%
Here:
46%
State:
43%
(% for various income ranges: 38.8% for AGIs below $25k, 45.7% for AGIs $25k-50k, 52.2% for AGIs $50k-75k, 47.1% for AGIs $75k-100k, 50.0% for AGIs $100k-200k, 66.7% for AGIs over 200k)
Averages for the 2004 tax year for zip code 98240, filed in 2005:
Average Adjusted Gross Income (AGI) in 2004: $48,212 (Individual Income Tax Returns)
Here:
$48,212
State:
$54,331
Salary/wage: $39,323 (reported on 84.8% of returns)
Here:
$39,323
State:
$45,761
(% of AGI for various income ranges: 96.9% for AGIs below $10k, 74.1% for AGIs $10k-25k, 79.7% for AGIs $25k-50k, 82.5% for AGIs $50k-75k, 84.7% for AGIs $75k-100k, 43.9% for AGIs over 100k)
Taxable interest for individuals: $1,286 (reported on 46.8% of returns)
This zip code:
$1,286
Washington:
$2,110
(% of AGI for various income ranges: 3.9% for AGIs below $10k, 2.0% for AGIs $10k-25k, 1.4% for AGIs $25k-50k, 0.4% for AGIs $50k-75k, 0.2% for AGIs $75k-100k, 2.0% for AGIs over 100k)
Taxable dividends: $2,378 (reported on 20.2% of returns)
Here:
$2,378
State:
$5,879
(% of AGI for various income ranges: 3.1% for AGIs below $10k, 1.0% for AGIs $10k-25k, 1.0% for AGIs $25k-50k, 0.6% for AGIs $50k-75k, 0.6% for AGIs $75k-100k, 1.4% for AGIs over 100k)
Net capital gain/loss: +$28,654 (reported on 17.9% of returns)
Here:
+$28,654
State:
+$15,835
(% of AGI for various income ranges: -3.1% for AGIs below $10k, 0.5% for AGIs $10k-25k, 1.7% for AGIs $25k-50k, 0.7% for AGIs $50k-75k, 3.9% for AGIs $75k-100k, 29.4% for AGIs over 100k)
Profit/loss from business: +$7,275 (reported on 16.9% of returns)
Here:
+$7,275
State:
+$13,994
(% of AGI for various income ranges: 12.2% for AGIs below $10k, 8.8% for AGIs $10k-25k, 2.8% for AGIs $25k-50k, 2.4% for AGIs $50k-75k, -0.3% for AGIs $75k-100k, 1.8% for AGIs over 100k)
IRA payment deduction: $3,089 (reported on 3.3% of returns)
98240:
$3,089
Washington:
$3,001
Total itemized deductions: $16,973 (23% of AGI, reported on 34.6% of returns)
Here:
$16,973
State:
$19,669
Here:
22.9% of AGI
State:
20.7% of AGI
(% of AGI for various income ranges: 12.3% for AGIs $10k-25k, 12.2% for AGIs $25k-50k, 15.7% for AGIs $50k-75k, 16.1% for AGIs $75k-100k, 8.3% for AGIs over 100k)
Charity contributions deductions: $2,655 (3% of AGI, reported on 26.9% of returns)
Here:
$2,655
State:
$3,569
Here:
3.3% of AGI
State:
3.5% of AGI
(% of AGI for various income ranges: 0.9% for AGIs $10k-25k, 1.1% for AGIs $25k-50k, 1.6% for AGIs $50k-75k, 1.4% for AGIs $75k-100k, 1.9% for AGIs over 100k)
Total tax: $6,358 (reported on 78.8% of returns)
98240:
$6,358
State:
$9,065
(% of AGI for various income ranges: 3.8% for AGIs below $10k, 4.7% for AGIs $10k-25k, 6.1% for AGIs $25k-50k, 8.4% for AGIs $50k-75k, 10.1% for AGIs $75k-100k, 16.4% for AGIs over 100k)
Earned income credit: $1,604 (reported on 11.5% of returns)
Here:
$1,604
State:
$1,607
Percentage of individuals using paid preparers for their 2004 taxes: 50.9%
Here:
51%
State:
49%
(% for various income ranges: 39.2% for AGIs below $10k, 46.7% for AGIs $10k-25k, 55.6% for AGIs $25k-50k, 50.4% for AGIs $50k-75k, 55.4% for AGIs $75k-100k, 68.7% for AGIs over 100k)
Household received Food Stamps/SNAP in the past 12 months: 168 Household did not receive Food Stamps/SNAP in the past 12 months: 1,098
Women who had a birth in the past 12 months: 25 (22 now married, 3 unmarried) Women who did not have a birth in the past 12 months: 582 (246 now married, 336 unmarried)
Housing units in zip code 98240 with a mortgage: 883 (36 second mortgage, 37 both second mortgage and home equity loan) Median monthly owner costs for units with a mortgage: $2,194 Median monthly owner costs for units without a mortgage: $605
Residents with income below the poverty level in 2022:
This zip code:
3.5%
Whole state:
10.0%
Residents with income below 50% of the poverty level in 2022:
This zip code:
1.7%
Whole state:
4.6%
Median number of rooms in houses and condos:
Here:
7.3
State:
6.5
Median number of rooms in apartments:
Here:
5.5
State:
3.9
Notable locations in this zip code not listed on our city pages
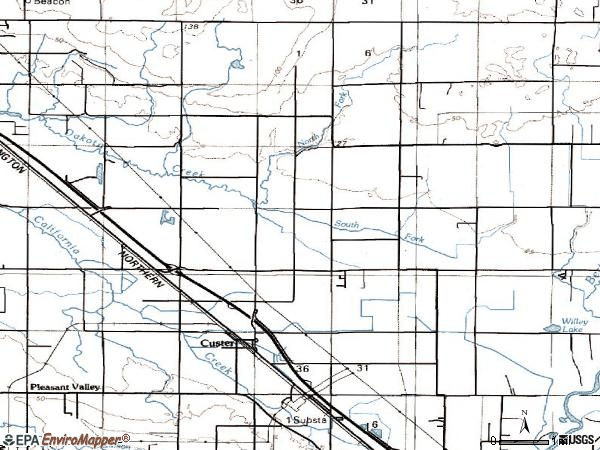
Notable locations in zip code 98240: Bellingham Omni Radio Range Station (A), Haynie Community Hall (B), Haynie (C), Grandview Golf Course (D), R T J Farms (E), Paul Dairy (F), Sunrise Dairy (G), James Dairy (H), Hilverda Dairy (I), Delanges Dairy (J), Tiersma Dairy (K), Kooiman Dairy (L), Van Ingen Dairy (M), Lar A Lin Dairy (N), A A Dairy (O), Kortus Farm (P), Pomeroy Farm (Q), North Whatcom Fire and Rescue Station 64 Custer (R), Grace Harbor Farms Museum (S). Display/hide their locations on the map
Churches in zip code 98240 include: Sunrise Church (A), Custer United Methodist Church (B), Kingdom Hall of Jehovahs Witnesses (C). Display/hide their locations on the map
In group quarters: 10 (-1 institutionalized population)
Size of family households: 499 2-persons, 182 3-persons, 240 4-persons, 30 5-persons, 95 6-persons, 7 7-or-more-persons
Size of nonfamily households: 107 1-person, 39 2-persons, 42 5-persons
545 married couples with children.
189 single-parent households (85 men, 104 women).
85.5% of residents of 98240 zip code speak English at home.
13.1% of residents speak Spanish at home (70% very well, 20% well, 8% not well, 2% not at all).
0.4% of residents speak other Indo-European language at home (100% very well).
Foreign born population: 406 (11.7%) (21.5% of them are naturalized citizens)
This zip code:
11.7%
Whole state:
15.3%
30%Honduras
3%France
14%German
13%Norwegian
11%English
6%Dutch
5%American
4%Irish
3%European
Year of entry for the foreign-born population
132010 or later
1462000 to 2009
1191990 to 1999
259Before 1990
Facilities with environmental interests located in this zip code:
BONNEVILLE POWER ADMIN CUSTER SUBSTATION (7357 PORTAL WAY in CUSTER, WA) . Federal Facility. DOE - POWER ADMINISTRATIONS
Conditionally Exempt Small Quantity Generators, less than 100 kg/month of hazardous waste (Resource Conservation and Recovery Act (tracking hazardous waste)) - notification TRANSPORTER (Resource Conservation and Recovery Act (tracking hazardous waste)) STATE MASTER (Washington State Department of Ecology's Facility/Site identification system) - TOXICS-, UNDERGROUND STORAGE TANK PROGRAM, HAZWASTE-WA4891419653, CESQG Business SIC classification: ELECTRIC SERVICES; GENERAL GOVERNMENT Business NAICS classification: ELECTRIC BULK POWER TRANSMISSION AND CONTROL.; ELECTRIC BULK POWER TRANSMISSION AND CONTROL. Organizations: US DOE BONNEVILLE POWER ADMINISTRATION (CONTACT/OPERATOR)
BURKHALTER RESIDENCE (8445 VALLEY VIEW RD in CUSTER, WA)
HAZARDOUS WASTE BIENNIAL REPORTER (Resource Conservation and Recovery Act (tracking hazardous waste)) (Resource Conservation and Recovery Act (tracking hazardous waste)) Organizations: GARY LITTLE (CONTACT/OPERATOR)
, COMMERCE LAND CO (CONTACT/OWNER)
Housing units lacking complete plumbing facilities: 3.7% Housing units lacking complete kitchen facilities: 3.8%
48.2%Electricity
25.0%Bottled, tank, or LP gas
10.4%Fuel oil, kerosene, etc.
7.0%Utility gas
6.5%Wood
3.3%Other fuel
Population in 1990: 2,791.
Place of birth for U.S.-born residents:
This state: 2,097
Northeast: 6
Midwest: 225
South: 56
West: 508
67% of the 98240 zip code residents lived in the same house 5 years ago. Out of people who lived in different houses, 63% lived in this county. Out of people who lived in different counties, 50% lived in Washington.
90% of the 98240 zip code residents lived in the same house 1 year ago. Out of people who lived in different houses, 13% moved from this county. Out of people who lived in different houses, 80% moved from different county within same state. Out of people who lived in different houses, 12% moved from abroad.
Private vs. public school enrollment:
Students in private schools in grades 1 to 8 (elementary and middle school): 67
Here:
11.1%
Washington:
12.4%
Students in private schools in grades 9 to 12 (high school): 21
Here:
9.6%
Washington:
9.2%
Students in private undergraduate colleges:
Here:
0.0%
Washington:
16.5%
Occupation by median earnings in the past 12 months ($)
75,839Transportation occupations
74,018Installation, maintenance, and repair occupations
70,184Construction and extraction occupations
62,559Management occupations
56,193Farming, fishing, and forestry occupations
47,025Building and grounds cleaning and maintenance occupations
Companies with federal contracts located in this zip code:
CALLEN CONSTRUCTION COMPANY, I (8632 STEIN ROAD in CUSTER, WA; small business) : $32,206 in 5 contractsfrom 2002 to 2004
Contracts for Construction of Structures and Facilities -- Restoration of real property by Army, U.S. Army Corps of Engineers - civil program financing only Signed by year:2000: $0; 2001: $0; 2002: $760; 2003: $0; 2004: $31,446; 2005: $0; 2006: $0.
Biggest contracts:
$34,577 with Army for Construction of Structures and Facilities -- Restoration of real property. Signed on 2004-08-26. Completion date: 2004-10-15.
$34,577 with U.S. Army Corps of Engineers - civil program financing only for Construction of Structures and Facilities -- Restoration of real property. Signed on 2004-08-26. Completion date: 2004-10-15.
$760, same as above.Signed on 2002-01-28. Completion date: 2002-01-12.
-$18,854 with Army for Construction of Structures and Facilities -- Restoration of real property. Signed on 2004-12-06. Completion date: 2004-09-10.
IVERSON EARTH WORKS LLC (2330 BIRCH BAY LYNDEN RD in CUSTER, WA; small business) : $14,210 in 2 contractsin 2003
$7,105 with Army for Construction of Structures and Facilities -- Highways, Roads, Streets, Bridges, and Railways (includes resurfacing). Signed on 2003-11-05. Completion date: 2003-10-23.
$7,105 with U.S. Army Corps of Engineers - civil program financing only for Construction of Structures and Facilities -- Highways, Roads, Streets, Bridges, and Railways (includes resurfacing). Signed on 2003-11-05. Completion date: 2003-10-23.
Top industries in this zip code by the number of employees in 2005:
Arts, Entertainment, and Recreation: Golf Courses and Country Clubs (10-19 employees: 1 establishment, 5-9 employees: 1 establishment)
Construction: Site Preparation Contractors (10-19: 1, 1-4: 2)
Other Services (except Public Administration): Religious Organizations (10-19: 1, 1-4: 2)
Construction: New Single-Family Housing Construction (except Operative Builders) (10-19: 1, 1-4: 1)
Professional, Scientific, and Technical Services: Other Scientific and Technical Consulting Services (10-19: 1)
Accommodation and Food Services: Snack and Nonalcoholic Beverage Bars (10-19: 1)
Construction: Electrical Contractors (5-9: 2)
Health Care and Social Assistance: Homes for the Elderly (5-9: 1, 1-4: 1)
People in group quarters in 2010:
6 people in nursing facilities/skilled-nursing facilities
Fatal accident statistics in 2014:
Fatal accident count: 1
Vehicles involved in fatal accidents: 2
Fatal accidents caused by drunken drivers: 0
Fatalities: 1
Persons involved in fatal accidents: 3
Pedestrians involved in fatal accidents: 0
Fatal accident statistics in 2013:
Fatal accident count: 1
Vehicles involved in fatal accidents: 1
Fatal accidents caused by drunken drivers: 0
Fatalities: 1
Persons involved in fatal accidents: 2
Pedestrians involved in fatal accidents: 0
Home Mortgage Disclosure Act Aggregated Statistics For Year 2009 (Based on 6 partial tracts)
A) FHA, FSA/RHS & VA Home Purchase Loans
B) Conventional Home Purchase Loans
C) Refinancings
D) Home Improvement Loans
F) Non-occupant Loans on < 5 Family Dwellings (A B C & D)
G) Loans On Manufactured Home Dwelling (A B C & D)
Number
Average Value
Number
Average Value
Number
Average Value
Number
Average Value
Number
Average Value
Number
Average Value
LOANS ORIGINATED
62
$206,748
77
$241,229
435
$232,204
22
$154,124
45
$270,133
59
$178,560
APPLICATIONS APPROVED, NOT ACCEPTED
8
$191,945
11
$213,043
52
$228,749
6
$70,443
8
$210,339
9
$145,486
APPLICATIONS DENIED
15
$183,119
15
$229,225
126
$243,811
9
$124,946
20
$221,269
13
$137,881
APPLICATIONS WITHDRAWN
13
$215,373
14
$189,526
93
$238,918
6
$171,967
13
$253,852
11
$157,899
FILES CLOSED FOR INCOMPLETENESS
1
$378,540
1
$144,800
18
$242,099
0
$0
1
$84,110
3
$239,067
Aggregated Statistics For Year 2008 (Based on 6 partial tracts)
A) FHA, FSA/RHS & VA Home Purchase Loans
B) Conventional Home Purchase Loans
C) Refinancings
D) Home Improvement Loans
E) Loans on Dwellings For 5+ Families
F) Non-occupant Loans on < 5 Family Dwellings (A B C & D)
G) Loans On Manufactured Home Dwelling (A B C & D)
Number
Average Value
Number
Average Value
Number
Average Value
Number
Average Value
Number
Average Value
Number
Average Value
Number
Average Value
LOANS ORIGINATED
30
$238,543
100
$251,562
243
$223,614
27
$124,218
1
$3,303,220
46
$239,340
46
$170,482
APPLICATIONS APPROVED, NOT ACCEPTED
3
$179,773
9
$251,314
42
$243,521
3
$55,613
0
$0
10
$257,564
5
$108,690
APPLICATIONS DENIED
6
$225,805
22
$244,955
142
$253,621
23
$149,502
2
$436,035
22
$216,130
25
$151,114
APPLICATIONS WITHDRAWN
7
$211,611
15
$276,645
71
$256,448
7
$198,721
0
$0
12
$230,677
14
$187,024
FILES CLOSED FOR INCOMPLETENESS
1
$271,470
2
$158,525
13
$269,249
3
$169,557
0
$0
2
$259,635
1
$237,150
Aggregated Statistics For Year 2007 (Based on 6 partial tracts)
A) FHA, FSA/RHS & VA Home Purchase Loans
B) Conventional Home Purchase Loans
C) Refinancings
D) Home Improvement Loans
E) Loans on Dwellings For 5+ Families
F) Non-occupant Loans on < 5 Family Dwellings (A B C & D)
G) Loans On Manufactured Home Dwelling (A B C & D)
Number
Average Value
Number
Average Value
Number
Average Value
Number
Average Value
Number
Average Value
Number
Average Value
Number
Average Value
LOANS ORIGINATED
18
$209,265
228
$238,254
282
$235,219
62
$92,769
1
$366,690
84
$261,344
63
$152,662
APPLICATIONS APPROVED, NOT ACCEPTED
3
$239,660
30
$182,763
53
$248,435
13
$133,232
0
$0
11
$226,519
16
$160,646
APPLICATIONS DENIED
3
$333,843
50
$240,890
163
$226,266
33
$134,113
1
$143,600
24
$246,421
27
$143,440
APPLICATIONS WITHDRAWN
2
$208,235
26
$211,118
69
$243,289
9
$119,727
0
$0
9
$194,424
12
$168,094
FILES CLOSED FOR INCOMPLETENESS
1
$65,640
3
$200,000
31
$262,736
2
$41,170
0
$0
3
$163,397
2
$121,900
Aggregated Statistics For Year 2006 (Based on 6 partial tracts)
A) FHA, FSA/RHS & VA Home Purchase Loans
B) Conventional Home Purchase Loans
C) Refinancings
D) Home Improvement Loans
E) Loans on Dwellings For 5+ Families
F) Non-occupant Loans on < 5 Family Dwellings (A B C & D)
G) Loans On Manufactured Home Dwelling (A B C & D)
Number
Average Value
Number
Average Value
Number
Average Value
Number
Average Value
Number
Average Value
Number
Average Value
Number
Average Value
LOANS ORIGINATED
20
$202,942
309
$204,375
297
$205,655
62
$97,610
2
$298,915
107
$226,094
60
$152,089
APPLICATIONS APPROVED, NOT ACCEPTED
1
$301,730
38
$178,084
45
$202,367
4
$182,930
0
$0
6
$182,168
8
$154,659
APPLICATIONS DENIED
3
$193,830
58
$184,858
157
$206,295
36
$110,751
0
$0
17
$162,974
36
$125,013
APPLICATIONS WITHDRAWN
1
$374,950
35
$190,433
127
$203,492
11
$83,190
0
$0
18
$190,298
15
$115,741
FILES CLOSED FOR INCOMPLETENESS
0
$0
5
$226,386
24
$225,861
3
$77,263
0
$0
2
$167,515
1
$190,790
Aggregated Statistics For Year 2005 (Based on 6 partial tracts)
A) FHA, FSA/RHS & VA Home Purchase Loans
B) Conventional Home Purchase Loans
C) Refinancings
D) Home Improvement Loans
E) Loans on Dwellings For 5+ Families
F) Non-occupant Loans on < 5 Family Dwellings (A B C & D)
G) Loans On Manufactured Home Dwelling (A B C & D)
Number
Average Value
Number
Average Value
Number
Average Value
Number
Average Value
Number
Average Value
Number
Average Value
Number
Average Value
LOANS ORIGINATED
21
$179,584
384
$189,184
395
$172,484
58
$103,401
3
$317,117
109
$192,688
79
$132,892
APPLICATIONS APPROVED, NOT ACCEPTED
3
$144,920
42
$177,815
57
$161,222
6
$131,275
0
$0
14
$184,184
12
$129,108
APPLICATIONS DENIED
7
$163,861
68
$163,393
180
$168,524
30
$105,537
1
$158,640
25
$183,320
39
$114,579
APPLICATIONS WITHDRAWN
2
$274,200
56
$182,041
135
$183,991
18
$143,731
1
$260,750
11
$193,005
19
$149,484
FILES CLOSED FOR INCOMPLETENESS
0
$0
12
$165,426
47
$190,243
4
$95,242
0
$0
3
$210,273
10
$163,537
Aggregated Statistics For Year 2004 (Based on 6 partial tracts)
A) FHA, FSA/RHS & VA Home Purchase Loans
B) Conventional Home Purchase Loans
C) Refinancings
D) Home Improvement Loans
F) Non-occupant Loans on < 5 Family Dwellings (A B C & D)
G) Loans On Manufactured Home Dwelling (A B C & D)
Number
Average Value
Number
Average Value
Number
Average Value
Number
Average Value
Number
Average Value
Number
Average Value
LOANS ORIGINATED
29
$152,039
335
$156,611
337
$153,172
46
$75,925
91
$153,118
73
$125,705
APPLICATIONS APPROVED, NOT ACCEPTED
5
$125,370
45
$139,255
67
$160,557
6
$92,145
11
$156,930
16
$126,005
APPLICATIONS DENIED
4
$160,255
55
$134,609
178
$147,772
39
$52,846
15
$135,842
44
$120,492
APPLICATIONS WITHDRAWN
4
$168,240
44
$161,923
145
$142,306
12
$74,843
12
$123,867
17
$110,888
FILES CLOSED FOR INCOMPLETENESS
1
$183,560
4
$200,378
42
$150,630
3
$69,710
1
$220,570
5
$128,742
Aggregated Statistics For Year 2003 (Based on 6 partial tracts)
A) FHA, FSA/RHS & VA Home Purchase Loans
B) Conventional Home Purchase Loans
C) Refinancings
D) Home Improvement Loans
E) Loans on Dwellings For 5+ Families
F) Non-occupant Loans on < 5 Family Dwellings (A B C & D)
Number
Average Value
Number
Average Value
Number
Average Value
Number
Average Value
Number
Average Value
Number
Average Value
LOANS ORIGINATED
29
$144,700
297
$144,063
676
$141,541
26
$30,207
1
$1,167,040
115
$136,365
APPLICATIONS APPROVED, NOT ACCEPTED
1
$102,440
23
$138,593
73
$141,951
4
$38,858
0
$0
13
$163,478
APPLICATIONS DENIED
4
$114,968
52
$135,317
178
$140,648
19
$40,993
1
$51,280
18
$127,836
APPLICATIONS WITHDRAWN
1
$172,880
35
$161,682
137
$154,569
3
$65,950
0
$0
11
$186,206
FILES CLOSED FOR INCOMPLETENESS
0
$0
6
$136,013
22
$139,355
0
$0
0
$0
2
$89,425
Aggregated Statistics For Year 2002 (Based on 4 partial tracts)
A) FHA, FSA/RHS & VA Home Purchase Loans
B) Conventional Home Purchase Loans
C) Refinancings
D) Home Improvement Loans
E) Loans on Dwellings For 5+ Families
F) Non-occupant Loans on < 5 Family Dwellings (A B C & D)
Number
Average Value
Number
Average Value
Number
Average Value
Number
Average Value
Number
Average Value
Number
Average Value
LOANS ORIGINATED
34
$119,710
199
$129,742
357
$139,083
16
$30,228
1
$529,920
61
$109,892
APPLICATIONS APPROVED, NOT ACCEPTED
3
$121,813
19
$120,610
34
$127,098
5
$14,382
0
$0
6
$81,918
APPLICATIONS DENIED
5
$115,476
26
$98,172
130
$120,924
6
$22,132
0
$0
15
$91,374
APPLICATIONS WITHDRAWN
4
$109,350
30
$141,261
94
$131,776
5
$37,340
0
$0
7
$126,953
FILES CLOSED FOR INCOMPLETENESS
1
$122,270
10
$88,892
21
$127,187
0
$0
0
$0
1
$138,770
Aggregated Statistics For Year 2001 (Based on 4 partial tracts)
A) FHA, FSA/RHS & VA Home Purchase Loans
B) Conventional Home Purchase Loans
C) Refinancings
D) Home Improvement Loans
E) Loans on Dwellings For 5+ Families
F) Non-occupant Loans on < 5 Family Dwellings (A B C & D)
Number
Average Value
Number
Average Value
Number
Average Value
Number
Average Value
Number
Average Value
Number
Average Value
LOANS ORIGINATED
25
$122,280
157
$130,478
276
$134,181
15
$30,625
2
$351,505
47
$116,733
APPLICATIONS APPROVED, NOT ACCEPTED
3
$109,627
22
$119,438
28
$121,352
1
$23,930
0
$0
6
$101,532
APPLICATIONS DENIED
1
$108,970
41
$90,400
104
$133,238
20
$20,485
1
$247,540
11
$84,227
APPLICATIONS WITHDRAWN
4
$104,855
23
$123,959
92
$128,431
2
$33,865
0
$0
5
$109,414
FILES CLOSED FOR INCOMPLETENESS
1
$100,520
5
$119,142
20
$145,451
0
$0
0
$0
0
$0
Aggregated Statistics For Year 2000 (Based on 4 partial tracts)
A) FHA, FSA/RHS & VA Home Purchase Loans
B) Conventional Home Purchase Loans
C) Refinancings
D) Home Improvement Loans
E) Loans on Dwellings For 5+ Families
F) Non-occupant Loans on < 5 Family Dwellings (A B C & D)
Number
Average Value
Number
Average Value
Number
Average Value
Number
Average Value
Number
Average Value
Number
Average Value
LOANS ORIGINATED
23
$117,518
148
$187,783
87
$116,584
25
$46,563
1
$191,460
29
$124,871
APPLICATIONS APPROVED, NOT ACCEPTED
3
$108,410
22
$108,036
22
$115,243
8
$24,370
0
$0
6
$163,027
APPLICATIONS DENIED
4
$122,395
47
$115,451
71
$121,794
22
$28,449
0
$0
19
$149,853
APPLICATIONS WITHDRAWN
2
$163,775
15
$148,823
35
$101,976
4
$71,042
0
$0
2
$200,730
FILES CLOSED FOR INCOMPLETENESS
0
$0
2
$132,710
15
$105,271
1
$15,040
0
$0
1
$124,790
Aggregated Statistics For Year 1999 (Based on 3 partial tracts)
A) FHA, FSA/RHS & VA Home Purchase Loans
B) Conventional Home Purchase Loans
C) Refinancings
D) Home Improvement Loans
F) Non-occupant Loans on < 5 Family Dwellings (A B C & D)
2002 - 2018 National Fire Incident Reporting System (NFIRS) incidents
According to the data from the years 2002 - 2018 the average number of fires per year is 19. The highest number of reported fire incidents - 31 took place in 2007, and the least - 6 in 2002. The data has an increasing trend.
When looking into fire subcategories, the most incidents belonged to: Outside Fires (47.6%), and Structure Fires (32.5%).
Fire incident types reported to NFIRS in Zip Code 98240


 Nearest zip codes: 98248, 98230, 98264, 98225, 98226, 98262.


 . Federal Facility. DOE - POWER ADMINISTRATIONS


 According to the data from the years 2002 - 2018 the average number of fires per year is 19. The highest number of reported fire incidents - 31 took place in 2007, and the least - 6 in 2002. The data has an increasing trend.
 When looking into fire subcategories, the most incidents belonged to: Outside Fires (47.6%), and Structure Fires (32.5%).