Estimated zip code population in 2022: 1,948 Zip code population in 2010: 1,944 Zip code population in 2000: 2,257
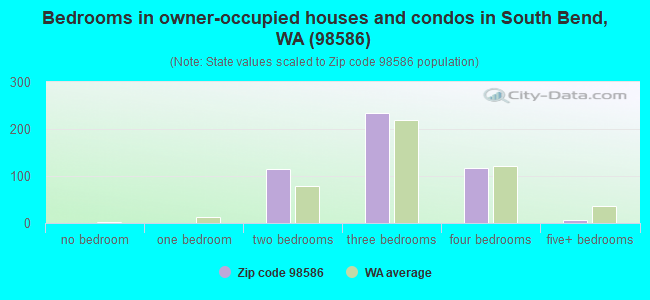
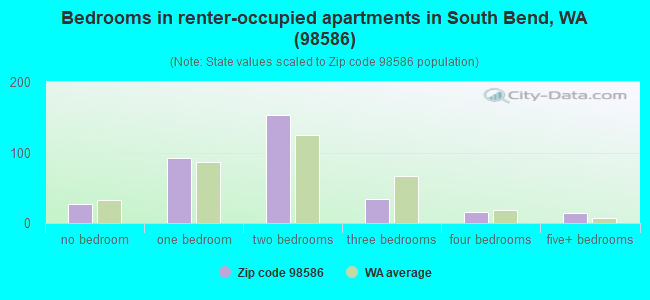
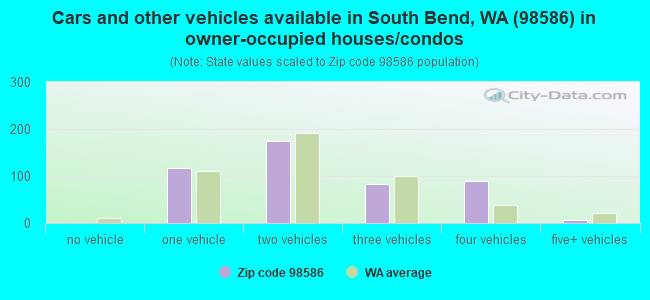
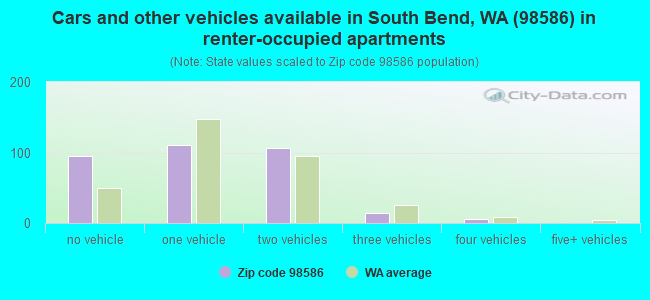
Houses and condos: 929 Renter-occupied apartments: 331
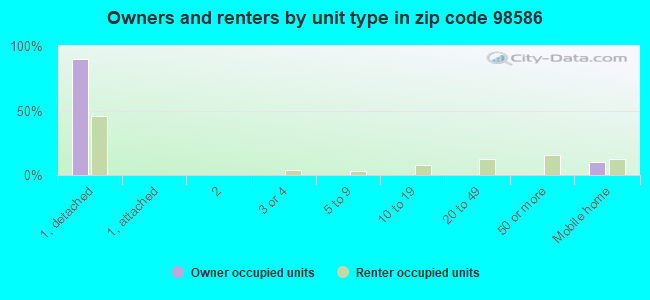
% of renters here:
41%
State:
36%
March 2022 cost of living index in zip code 98586: 89.3 (less than average, U.S. average is 100)
Land area: 135.5 sq. mi. Water area: 39.3 sq. mi.
Population density: 14 people per square mile
(very low).
OSM Map
General Map
Google Map
MSN Map
OSM Map
General Map
Google Map
MSN Map
OSM Map
General Map
Google Map
MSN Map
OSM Map
General Map
Google Map
MSN Map
Please wait while loading the map...
Real estate property taxes paid for housing units in 2022:
This zip code:
0.6% ($1,693)
Washington:
0.8% ($4,283)
Median real estate property taxes paid for housing units with mortgages in 2022: $1,826 (0.7%) Median real estate property taxes paid for housing units with no mortgage in 2022: $1,335 (0.5%)
Business Search- 14 Million verified businesses
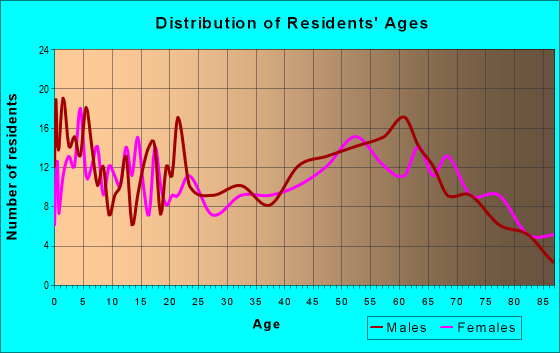
Males: 1,099
(56.4%)
Females: 848
(43.6%)
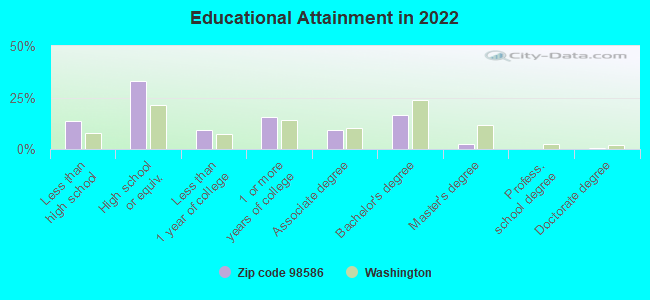
For population 25 years and over in 98586:
High school or higher: 84.5%
Bachelor's degree or higher: 19.0%
Graduate or professional degree: 3.1%
Unemployed: 2.3%
Mean travel time to work (commute): 22.2 minutes
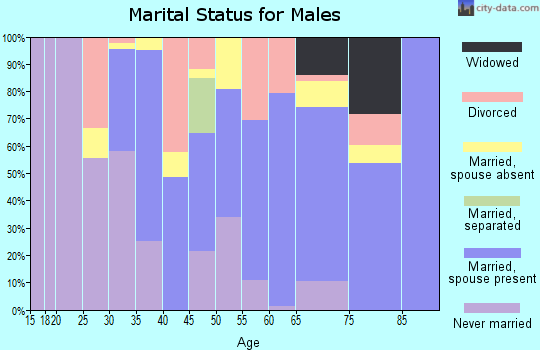
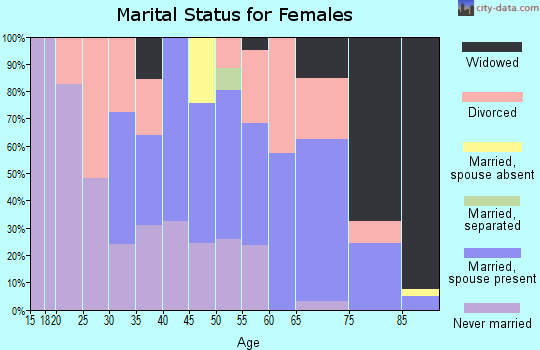
For population 15 years and over in 98586:
Never married: 30.7%
Now married: 39.2%
Separated: 2.1%
Widowed: 6.9%
Divorced: 21.2%
Zip code 98586 compared to state average:
Median household income below state average.
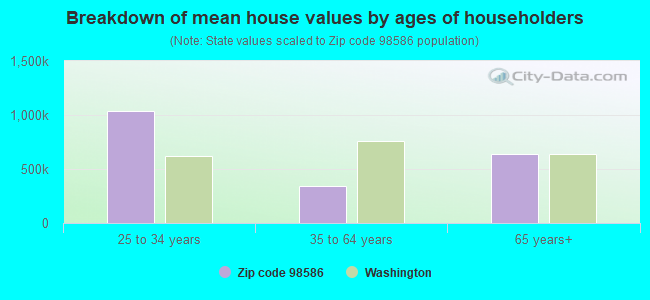
Median house value below state average.
Unemployed percentage below state average.
Median age above state average.
Length of stay since moving in above state average.
House age above state average.
Number of college students significantly below state average.
Percentage of population with a bachelor's degree or higher below state average.
Averages for the 2020 tax year for zip code 98586, filed in 2021:
Average Adjusted Gross Income (AGI) in 2020: $55,609 (Individual Income Tax Returns)
Here:
$55,609
State:
$99,264
Salary/wage: $48,262 (reported on 76.8% of returns)
Here:
$48,262
State:
$80,347
(% of AGI for various income ranges: 1197.3% for AGIs below $25k, 3276.1% for AGIs $25k-50k, 6585.6% for AGIs $50k-75k, 11590.0% for AGIs $75k-100k, 13382.9% for AGIs $100k-200k)
Taxable interest for individuals: $742 (reported on 33.3% of returns)
This zip code:
$742
Washington:
$2,077
(% of AGI for various income ranges: 26.4% for AGIs below $25k, 13.5% for AGIs $25k-50k, 23.3% for AGIs $50k-75k, 44.0% for AGIs $75k-100k, 47.1% for AGIs $100k-200k)
Ordinary dividends: $3,577 (reported on 13.1% of returns)
Here:
$3,577
State:
$10,013
(% of AGI for various income ranges: 57.8% for AGIs $25k-50k, 66.7% for AGIs $50k-75k, 68.0% for AGIs $75k-100k, 340.0% for AGIs $100k-200k)
Net capital gain/loss in AGI: +$18,085 (reported on 13.1% of returns)
Here:
+$18,085
State:
+$40,092
(% of AGI for various income ranges: 29.6% for AGIs $25k-50k, 65.6% for AGIs $50k-75k, 358.0% for AGIs $75k-100k, 2921.4% for AGIs $100k-200k)
Profit/loss from business: +$7,140 (reported on 10.1% of returns)
Here:
+$7,140
State:
+$18,312
(% of AGI for various income ranges: 151.4% for AGIs below $25k, 395.6% for AGIs $50k-75k, 35.7% for AGIs $100k-200k)
Taxable individual retirement arrangement distribution: $14,025 (reported on 8.1% of returns)
98586:
$14,025
Washington:
$24,221
(% of AGI for various income ranges: 87.7% for AGIs below $25k, 543.3% for AGIs $50k-75k, 628.6% for AGIs $100k-200k)
Total itemized deductions: $23,625 (reported on 4.0% of returns)
Here:
$23,625
State:
$39,068
(% of AGI for various income ranges: 1050.0% for AGIs $50k-75k)
Charity contributions: $1,950 (reported on 2.0% of returns)
Here:
$1,950
State:
$15,331
(% of AGI for various income ranges: 43.3% for AGIs $50k-75k)
Taxes paid: $5,150 (reported on 4.0% of returns)
98586:
$5,150
State:
$7,774
(% of AGI for various income ranges: 228.9% for AGIs $50k-75k)
Earned income credit: $2,118 (reported on 17.2% of returns)
Here:
$2,118
State:
$2,020
(% of AGI for various income ranges: 81.8% for AGIs below $25k, 78.3% for AGIs $25k-50k)
Percentage of individuals using paid preparers for their 2020 taxes: 91.9%
Here:
92%
State:
93%
(% for various income ranges: 90.9% for AGIs below $25k, 90.0% for AGIs $25k-50k, 92.9% for AGIs $50k-75k, 100.0% for AGIs $75k-100k, 90.0% for AGIs $100k-200k, 100.0% for AGIs over 200k)
Averages for the 2012 tax year for zip code 98586, filed in 2013:
Average Adjusted Gross Income (AGI) in 2012: $45,163 (Individual Income Tax Returns)
Here:
$45,163
State:
$69,533
Salary/wage: $38,922 (reported on 77.9% of returns)
Here:
$38,922
State:
$57,267
(% of AGI for various income ranges: 66.4% for AGIs below $25k, 69.9% for AGIs $25k-50k, 69.5% for AGIs $50k-75k, 74.9% for AGIs $75k-100k, 61.1% for AGIs $100k-200k)
Taxable interest for individuals: $1,320 (reported on 34.9% of returns)
This zip code:
$1,320
Washington:
$1,816
(% of AGI for various income ranges: 1.3% for AGIs below $25k, 0.7% for AGIs $25k-50k, 0.4% for AGIs $50k-75k, 2.2% for AGIs $75k-100k, 0.9% for AGIs $100k-200k)
Ordinary dividends: $3,257 (reported on 16.3% of returns)
Here:
$3,257
State:
$8,163
(% of AGI for various income ranges: 0.8% for AGIs below $25k, 0.7% for AGIs $25k-50k, 1.4% for AGIs $50k-75k, 1.0% for AGIs $75k-100k, 1.6% for AGIs $100k-200k)
Net capital gain/loss in AGI: +$7,445 (reported on 12.8% of returns)
Here:
+$7,445
State:
+$21,568
(% of AGI for various income ranges: 0.3% for AGIs $25k-50k, 0.2% for AGIs $50k-75k, 6.0% for AGIs $100k-200k)
Profit/loss from business: +$7,700 (reported on 11.6% of returns)
Here:
+$7,700
State:
+$16,521
(% of AGI for various income ranges: 4.6% for AGIs below $25k, 5.5% for AGIs $25k-50k, 0.9% for AGIs $75k-100k)
Taxable individual retirement arrangement distribution: $9,060 (reported on 11.6% of returns)
98586:
$9,060
Washington:
$18,648
(% of AGI for various income ranges: 3.0% for AGIs below $25k, 2.8% for AGIs $25k-50k, 8.0% for AGIs $50k-75k)
Total itemized deductions: $17,121 (21% of AGI, reported on 16.3% of returns)
Here:
$17,121
State:
$23,872
Here:
20.6% of AGI
State:
18.2% of AGI
(% of AGI for various income ranges: 7.6% for AGIs $25k-50k, 14.2% for AGIs $50k-75k, 6.2% for AGIs $100k-200k)
Charity contributions: $2,667 (reported on 10.5% of returns)
Here:
$2,667
State:
$4,465
(% of AGI for various income ranges: 1.0% for AGIs $25k-50k, 1.1% for AGIs $50k-75k, 0.6% for AGIs $100k-200k)
Taxes paid: $4,136 (reported on 16.3% of returns)
98586:
$4,136
State:
$6,400
(% of AGI for various income ranges: 1.7% for AGIs $25k-50k, 3.2% for AGIs $50k-75k, 1.7% for AGIs $100k-200k)
Earned income credit: $2,040 (reported on 17.4% of returns)
Here:
$2,040
State:
$2,073
(% of AGI for various income ranges: 4.9% for AGIs below $25k, 0.7% for AGIs $25k-50k)
Percentage of individuals using paid preparers for their 2012 taxes: 58.1%
Here:
58%
State:
43%
(% for various income ranges: 52.8% for AGIs below $25k, 64.0% for AGIs $25k-50k, 54.5% for AGIs $50k-75k, 66.7% for AGIs $75k-100k, 62.5% for AGIs $100k-200k)
Averages for the 2004 tax year for zip code 98586, filed in 2005:
Average Adjusted Gross Income (AGI) in 2004: $34,257 (Individual Income Tax Returns)
Here:
$34,257
State:
$54,331
Salary/wage: $30,775 (reported on 80.2% of returns)
Here:
$30,775
State:
$45,761
(% of AGI for various income ranges: 132.0% for AGIs below $10k, 74.2% for AGIs $10k-25k, 73.5% for AGIs $25k-50k, 77.9% for AGIs $50k-75k, 78.8% for AGIs $75k-100k, 48.3% for AGIs over 100k)
Taxable interest for individuals: $1,318 (reported on 41.6% of returns)
This zip code:
$1,318
Washington:
$2,110
(% of AGI for various income ranges: 12.9% for AGIs below $10k, 1.9% for AGIs $10k-25k, 1.8% for AGIs $25k-50k, 1.6% for AGIs $50k-75k, 0.3% for AGIs $75k-100k, 1.1% for AGIs over 100k)
Taxable dividends: $2,615 (reported on 21.0% of returns)
Here:
$2,615
State:
$5,879
(% of AGI for various income ranges: 8.1% for AGIs below $10k, 0.8% for AGIs $10k-25k, 1.6% for AGIs $25k-50k, 1.7% for AGIs $50k-75k, 0.5% for AGIs $75k-100k, 2.4% for AGIs over 100k)
Net capital gain/loss: +$7,032 (reported on 17.7% of returns)
Here:
+$7,032
State:
+$15,835
(% of AGI for various income ranges: 0.6% for AGIs below $10k, 0.8% for AGIs $10k-25k, 1.9% for AGIs $25k-50k, 0.4% for AGIs $50k-75k, 0.6% for AGIs $75k-100k, 15.5% for AGIs over 100k)
Profit/loss from business: +$2,374 (reported on 12.9% of returns)
Here:
+$2,374
State:
+$13,994
(% of AGI for various income ranges: 2.8% for AGIs below $10k, 4.4% for AGIs $10k-25k, 1.3% for AGIs $25k-50k, -0.7% for AGIs $50k-75k, 0.4% for AGIs $75k-100k)
Profit/loss from farming: +$438 (reported on 1.8% of returns)
Here:
+$438
State:
-$6,197
IRA payment deduction: $3,176 (reported on 1.9% of returns)
98586:
$3,176
Washington:
$3,001
Total itemized deductions: $14,813 (24% of AGI, reported on 17.4% of returns)
Here:
$14,813
State:
$19,669
Here:
23.8% of AGI
State:
20.7% of AGI
(% of AGI for various income ranges: 10.1% for AGIs $10k-25k, 6.1% for AGIs $25k-50k, 8.0% for AGIs $50k-75k, 7.0% for AGIs $75k-100k, 8.0% for AGIs over 100k)
Charity contributions deductions: $2,973 (5% of AGI, reported on 12.6% of returns)
Here:
$2,973
State:
$3,569
Here:
5.0% of AGI
State:
3.5% of AGI
(% of AGI for various income ranges: 1.1% for AGIs $10k-25k, 0.5% for AGIs $25k-50k, 1.9% for AGIs $50k-75k, 1.0% for AGIs $75k-100k, 1.2% for AGIs over 100k)
Total tax: $4,572 (reported on 66.5% of returns)
98586:
$4,572
State:
$9,065
(% of AGI for various income ranges: 4.1% for AGIs below $10k, 3.0% for AGIs $10k-25k, 6.1% for AGIs $25k-50k, 8.4% for AGIs $50k-75k, 10.5% for AGIs $75k-100k, 16.7% for AGIs over 100k)
Earned income credit: $1,691 (reported on 19.6% of returns)
Here:
$1,691
State:
$1,607
Percentage of individuals using paid preparers for their 2004 taxes: 62.2%
Here:
62%
State:
49%
(% for various income ranges: 55.9% for AGIs below $10k, 63.9% for AGIs $10k-25k, 63.6% for AGIs $25k-50k, 58.1% for AGIs $50k-75k, 73.8% for AGIs $75k-100k, 73.5% for AGIs over 100k)
Household received Food Stamps/SNAP in the past 12 months: 281 Household did not receive Food Stamps/SNAP in the past 12 months: 529
Women who had a birth in the past 12 months: 30 (0 now married, 27 unmarried) Women who did not have a birth in the past 12 months: 275 (69 now married, 208 unmarried)
Housing units in zip code 98586 with a mortgage: 285 (5 second mortgage, 5 both second mortgage and home equity loan) Houses without a mortgage: 20
Median monthly owner costs for units with a mortgage: $1,211 Median monthly owner costs for units without a mortgage: $489
Residents with income below the poverty level in 2022:
This zip code:
27.0%
Whole state:
10.0%
Residents with income below 50% of the poverty level in 2022:
This zip code:
13.7%
Whole state:
4.6%
Median number of rooms in houses and condos:
Here:
6.3
State:
6.5
Median number of rooms in apartments:
Here:
3.7
State:
3.9
Notable locations in this zip code not listed on our city pages
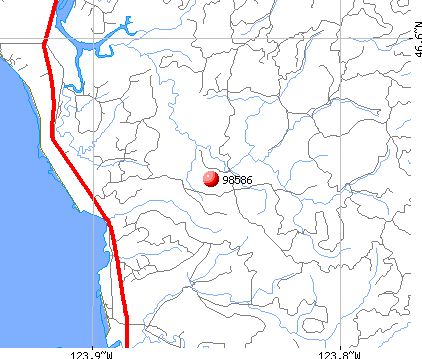
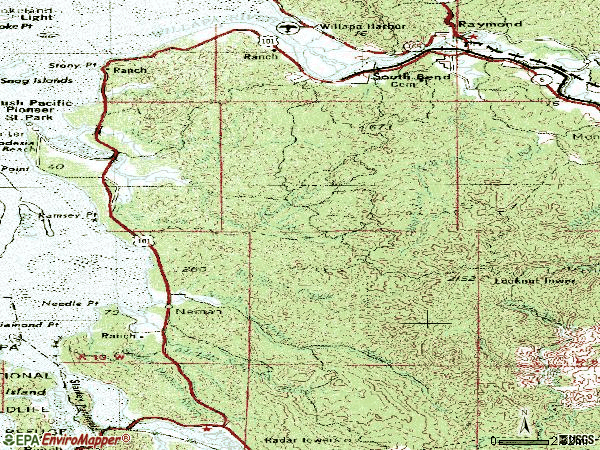
Notable locations in zip code 98586: Holton Ranch (A), Lagergren Ranch (B), Nemah Hatchery (C), Sunshine (D), Minks Ranch (E), Trap Creek Lookout (F), Welsh Ranch (G), Alder House Assisted Living Facility (H), City of South Bend Volunteer Fire Department (I), Pacific County Courthouse Annex (J), Pacific County Courthouse (K), Pacific County Museum (L), South Bend Timberland Library (M). Display/hide their locations on the map
Churches in zip code 98586 include: First Baptist Church (A), First Lutheran Church (B), South Bend United Methodist Church (C). Display/hide their locations on the map
Streams, rivers, and creeks: Canyon Creek (A), Clearwater Creek (B), Finn Creek (C), Freshwater Creek (D), Hansen Creek (E), Lewis Slough (F), Middle Nemah River (G), Niawiakum River (H), Potter Slu (I). Display/hide their locations on the map
In group quarters: 80 (-1 institutionalized population)
Size of family households: 180 2-persons, 91 3-persons, 98 4-persons, 54 5-persons, 19 6-persons, 7 7-or-more-persons
Size of nonfamily households: 288 1-person, 69 2-persons
65 married couples with children.
148 single-parent households (88 men, 60 women).
80.5% of residents of 98586 zip code speak English at home.
15.4% of residents speak Spanish at home (42% very well, 30% well, 12% not well, 16% not at all).
0.4% of residents speak other Indo-European language at home (100% very well).
4.1% of residents speak Asian or Pacific Island language at home (87% very well, 13% not well).
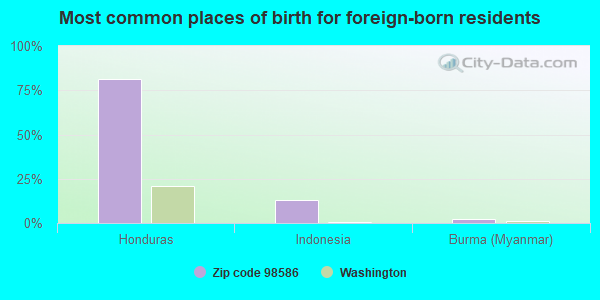
Foreign born population: 268 (13.8%) (43.4% of them are naturalized citizens)
This zip code:
13.8%
Whole state:
15.3%
81%Honduras
13%Indonesia
2%Burma (Myanmar)
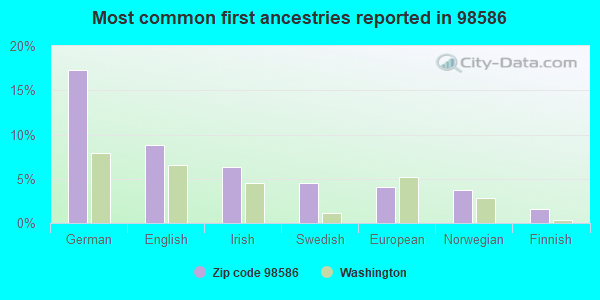
17%German
9%English
6%Irish
5%Swedish
4%European
4%Norwegian
2%Finnish
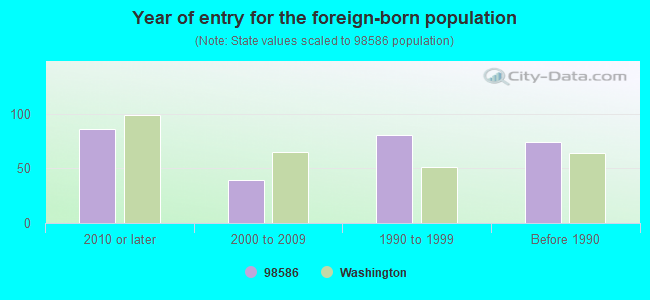
Year of entry for the foreign-born population
862010 or later
392000 to 2009
811990 to 1999
74Before 1990
Facilities with environmental interests located in this zip code:
COAST SEAFOOD SOUTH BEND (1200 ROBERT BUSH DR in SOUTH BEND, WA)
National Pollutant Discharge Elimination System NON-MAJOR (Tracking pollutant discharge elimination systems) - permit National Pollutant Discharge Elimination System NON-MAJOR (Tracking pollutant discharge elimination systems) - permit STATE MASTER (Washington State Department of Ecology's Facility/Site identification system) - WATQUAL-SO3002920, NPDES STORMWATER PERMIT, WATQUAL-WA0002186, NPDES NON-MAJOR Business SIC classification: CANNED AND CURED FISH AND SEAFOODS; PREPARED FRESH OR FROZEN FISH AND SEAFOODS Organizations: COAST OYSTER CO (CONTACT/OPERATOR)
, COAST SEAFOODS CO (CONTACT/OWNER)
Alternative names: COAST OYSTER CO, COAST SEAFOODS CO
CHAUNCEY DAVIS ELEMENTARY (500 E 1ST in SOUTH BEND, WA)
(National Center for Education Statistics) - STATE ID-2804 Organizations: SOUTH BEND SCH DIST 118 (SCHOOL DISTRICT)
Housing units lacking complete plumbing facilities: 0.9% Housing units lacking complete kitchen facilities: 0.9%
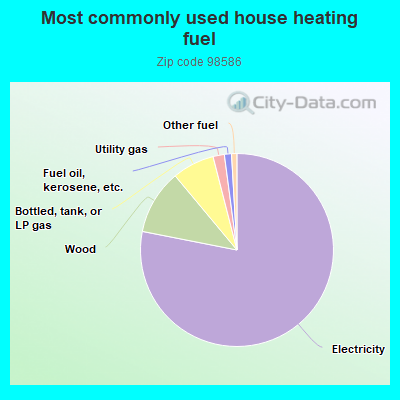
78.4%Electricity
10.9%Wood
7.1%Bottled, tank, or LP gas
1.9%Utility gas
1.2%Fuel oil, kerosene, etc.
0.9%Other fuel
Population in 1990: 2,575.
Place of birth for U.S.-born residents:
This state: 1,026
Northeast: 62
Midwest: 131
South: 123
West: 317
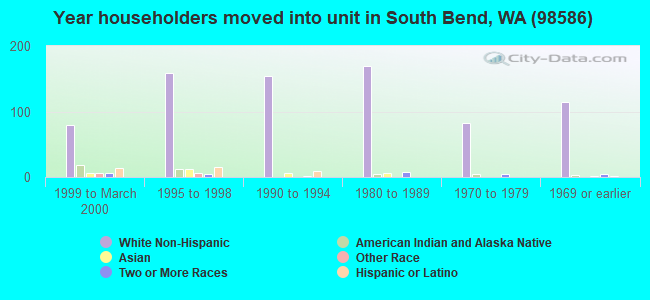
65% of the 98586 zip code residents lived in the same house 5 years ago. Out of people who lived in different houses, 66% lived in this county. Out of people who lived in different counties, 50% lived in Washington.
92% of the 98586 zip code residents lived in the same house 1 year ago. Out of people who lived in different houses, 17% moved from this county. Out of people who lived in different houses, 77% moved from different county within same state. Out of people who lived in different houses, 13% moved from different state.
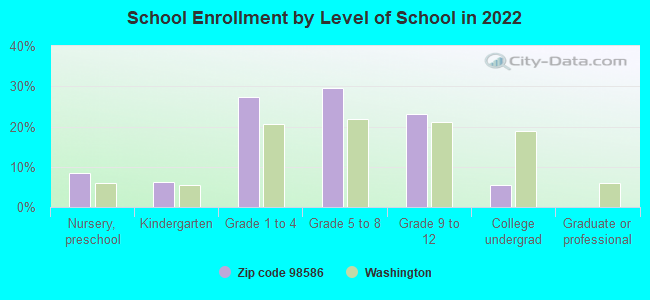
Private vs. public school enrollment:
Students in private schools in grades 1 to 8 (elementary and middle school):
Here:
0.0%
Washington:
12.4%
Students in private schools in grades 9 to 12 (high school):
Here:
0.0%
Washington:
9.2%
Students in private undergraduate colleges:
Here:
0.0%
Washington:
16.5%
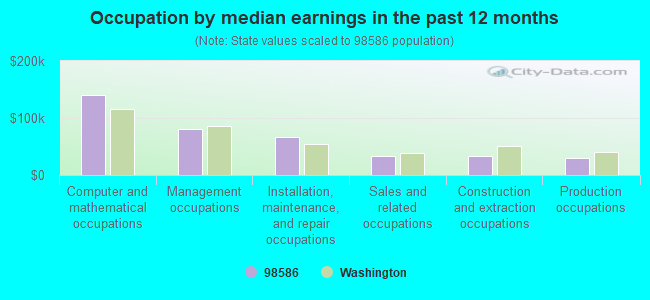
Occupation by median earnings in the past 12 months ($)
140,793Computer and mathematical occupations
80,119Management occupations
66,039Installation, maintenance, and repair occupations
34,000Sales and related occupations
33,716Construction and extraction occupations
29,806Production occupations
Top industries in this zip code by the number of employees in 2005:
Health Care and Social Assistance: General Medical and Surgical Hospitals (100-249 employees: 1 establishment)
Wholesale Trade: Fish and Seafood Merchant Wholesalers (50-99: 1, 10-19: 1)
Arts, Entertainment, and Recreation: Bowling Centers (20-49: 1)
Health Care and Social Assistance: Homes for the Elderly (20-49: 1)
Accommodation and Food Services: Limited-Service Restaurants (20-49: 1)
People in group quarters in 2010:
35 people in group homes intended for adults
21 people in local jails and other municipal confinement facilities
2 people in nursing facilities/skilled-nursing facilities
People in group quarters in 2000:
45 people in local jails and other confinement facilities (including police lockups)
18 people in other noninstitutional group quarters
Fatal accident statistics in 2012:
Fatal accident count: 1
Vehicles involved in fatal accidents: 2
Fatal accidents caused by drunken drivers: 0
Fatalities: 1
Persons involved in fatal accidents: 3
Pedestrians involved in fatal accidents: 0
Fatal accident statistics in 2011:
Fatal accident count: 1
Vehicles involved in fatal accidents: 1
Fatal accidents caused by drunken drivers: 0
Fatalities: 1
Persons involved in fatal accidents: 1
Pedestrians involved in fatal accidents: 0
2003 - 2018 National Fire Incident Reporting System (NFIRS) incidents
Based on the data from the years 2003 - 2018 the average number of fires per year is 8. The highest number of reported fires - 24 took place in 2006, and the least - 0 in 2010. The data has a decreasing trend.
When looking into fire subcategories, the most reports belonged to: Structure Fires (65.0%), and Outside Fires (18.7%).
Fire incident types reported to NFIRS in Zip Code 98586


+$438
-$6,197
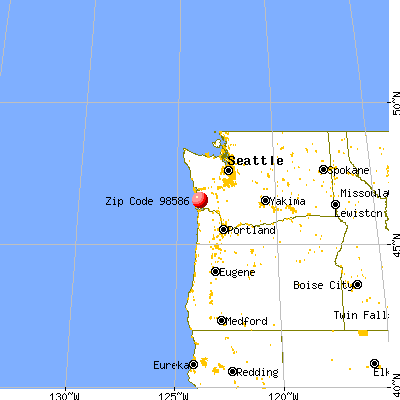
 Nearest zip codes: 98527, 98638, 98640, 98641, 98590, 98577.
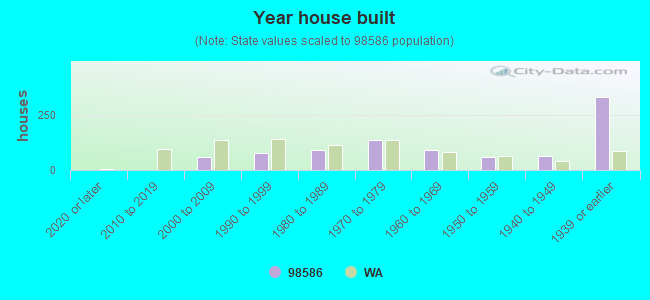


 Based on the data from the years 2003 - 2018 the average number of fires per year is 8. The highest number of reported fires - 24 took place in 2006, and the least - 0 in 2010. The data has a decreasing trend.
 When looking into fire subcategories, the most reports belonged to: Structure Fires (65.0%), and Outside Fires (18.7%).