Estimated zip code population in 2022: 3,231 Zip code population in 2010: 3,176 Zip code population in 2000: 2,348
Houses and condos: 947 Renter-occupied apartments: 391
% of renters here:
45%
State:
36%
March 2022 cost of living index in zip code 98813: 86.3 (less than average, U.S. average is 100)
Land area: 118.1 sq. mi. Water area: 7.4 sq. mi.
Population density: 27 people per square mile
(very low).
OSM Map
General Map
Google Map
MSN Map
OSM Map
General Map
Google Map
MSN Map
OSM Map
General Map
Google Map
MSN Map
OSM Map
General Map
Google Map
MSN Map
Please wait while loading the map...
Real estate property taxes paid for housing units in 2022:
This zip code:
0.8% ($1,366)
Washington:
0.8% ($4,283)
Median real estate property taxes paid for housing units with mortgages in 2022: $1,774 (1.0%) Median real estate property taxes paid for housing units with no mortgage in 2022: $1,285 (0.7%)
Business Search- 14 Million verified businesses
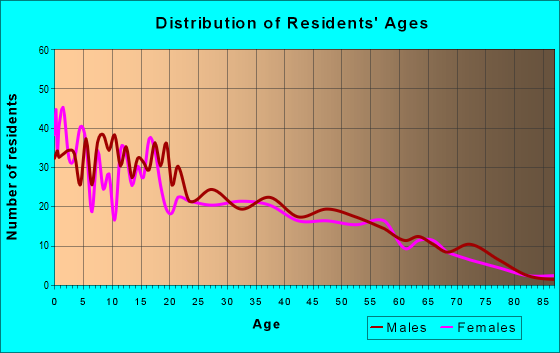
Males: 1,882
(58.2%)
Females: 1,349
(41.8%)
For population 25 years and over in 98813:
High school or higher: 48.2%
Bachelor's degree or higher: 3.1%
Graduate or professional degree: 0.4%
Unemployed: 3.0%
Mean travel time to work (commute): 24.9 minutes
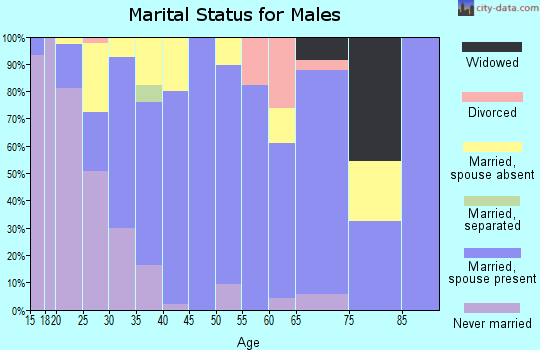
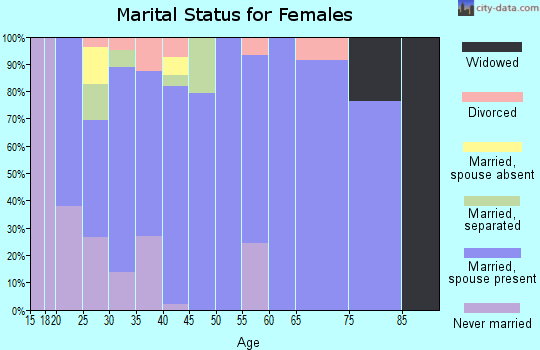
For population 15 years and over in 98813:
Never married: 32.6%
Now married: 57.0%
Separated: 2.6%
Widowed: 2.6%
Divorced: 5.2%
Zip code 98813 compared to state average:
Median household income below state average.
Median house value significantly below state average.
Hispanic race population percentage significantly above state average.
Median age significantly below state average.
Foreign-born population percentage significantly above state average.
Length of stay since moving in significantly above state average.
Number of college students significantly below state average.
Percentage of population with a bachelor's degree or higher significantly below state average.
Estimated median house/condo value in 2022: $179,127
98813:
$179,127
Washington:
$569,500
According to our research of Washington and other state lists, there were 2 registered sex offenders living in 98813 zip code as of April 27, 2024. The ratio of all residents to sex offenders in zip code 98813 is 1,530 to 1. The ratio of registered sex offenders to all residents in this zip code is lower than the state average.
Median resident age:
This zip code:
28.3 years
Washington median age:
38.4 years
Average household size:
This zip code:
3.1 people
Washington:
2.5 people
Averages for the 2020 tax year for zip code 98813, filed in 2021:
Average Adjusted Gross Income (AGI) in 2020: $27,171 (Individual Income Tax Returns)
Here:
$27,171
State:
$99,264
Salary/wage: $25,307 (reported on 96.6% of returns)
Here:
$25,307
State:
$80,347
(% of AGI for various income ranges: 6810.0% for AGIs below $25k, 5598.4% for AGIs $25k-50k, 7079.0% for AGIs $50k-75k, 9634.0% for AGIs $75k-100k, 14356.7% for AGIs $100k-200k)
Taxable interest for individuals: $375 (reported on 8.4% of returns)
This zip code:
$375
Washington:
$2,077
(% of AGI for various income ranges: 6.6% for AGIs below $25k, 2.5% for AGIs $25k-50k, 31.0% for AGIs $50k-75k, 43.3% for AGIs $100k-200k)
Ordinary dividends: $1,625 (reported on 1.7% of returns)
Here:
$1,625
State:
$10,013
(% of AGI for various income ranges: 65.0% for AGIs $50k-75k)
Net capital gain/loss in AGI: +$2,100 (reported on 2.1% of returns)
Here:
+$2,100
State:
+$40,092
(% of AGI for various income ranges: 105.0% for AGIs $50k-75k)
Profit/loss from business: +$9,325 (reported on 1.7% of returns)
Here:
+$9,325
State:
+$18,312
(% of AGI for various income ranges: 116.6% for AGIs $25k-50k)
Earned income credit: $2,134 (reported on 32.1% of returns)
Here:
$2,134
State:
$2,020
(% of AGI for various income ranges: 349.4% for AGIs below $25k, 124.7% for AGIs $25k-50k)
Percentage of individuals using paid preparers for their 2020 taxes: 32.5%
Here:
32%
State:
93%
(% for various income ranges: 18.8% for AGIs below $25k, 48.3% for AGIs $25k-50k, 76.9% for AGIs $50k-75k, 85.7% for AGIs $75k-100k, 80.0% for AGIs $100k-200k)
Averages for the 2012 tax year for zip code 98813, filed in 2013:
Average Adjusted Gross Income (AGI) in 2012: $21,356 (Individual Income Tax Returns)
Here:
$21,356
State:
$69,533
Salary/wage: $19,472 (reported on 95.3% of returns)
Here:
$19,472
State:
$57,267
(% of AGI for various income ranges: 94.9% for AGIs below $25k, 86.4% for AGIs $25k-50k, 78.3% for AGIs $50k-75k, 62.0% for AGIs $75k-100k, 76.8% for AGIs $100k-200k)
Taxable interest for individuals: $1,086 (reported on 7.3% of returns)
This zip code:
$1,086
Washington:
$1,816
(% of AGI for various income ranges: 0.2% for AGIs $25k-50k, 1.0% for AGIs $50k-75k, 2.2% for AGIs $75k-100k)
Ordinary dividends: $2,900 (reported on 3.1% of returns)
Here:
$2,900
State:
$8,163
Net capital gain/loss in AGI: +$2,850 (reported on 2.1% of returns)
Here:
+$2,850
State:
+$21,568
Profit/loss from business: +$11,650 (reported on 2.1% of returns)
Here:
+$11,650
State:
+$16,521
Taxable individual retirement arrangement distribution: $4,000 (reported on 1.6% of returns)
98813:
$4,000
Washington:
$18,648
Total itemized deductions: $15,840 (24% of AGI, reported on 2.6% of returns)
Here:
$15,840
State:
$23,872
Here:
24.5% of AGI
State:
18.2% of AGI
Taxes paid: $2,820 (reported on 2.6% of returns)
98813:
$2,820
State:
$6,400
Earned income credit: $1,067 (reported on 36.5% of returns)
Here:
$1,067
State:
$2,073
(% of AGI for various income ranges: 3.3% for AGIs below $25k, 1.0% for AGIs $25k-50k)
Percentage of individuals using paid preparers for their 2012 taxes: 26.0%
Here:
26%
State:
43%
(% for various income ranges: 18.2% for AGIs below $25k, 53.3% for AGIs $25k-50k, 44.4% for AGIs $50k-75k, 100.0% for AGIs $75k-100k)
Averages for the 2004 tax year for zip code 98813, filed in 2005:
Average Adjusted Gross Income (AGI) in 2004: $27,195 (Individual Income Tax Returns)
Here:
$27,195
State:
$54,331
Salary/wage: $23,894 (reported on 85.4% of returns)
Here:
$23,894
State:
$45,761
(% of AGI for various income ranges: 117.8% for AGIs below $10k, 82.6% for AGIs $10k-25k, 75.3% for AGIs $25k-50k, 79.5% for AGIs $50k-75k, 69.0% for AGIs $75k-100k, 43.9% for AGIs over 100k)
Taxable interest for individuals: $1,308 (reported on 31.3% of returns)
This zip code:
$1,308
Washington:
$2,110
(% of AGI for various income ranges: 3.9% for AGIs below $10k, 1.2% for AGIs $10k-25k, 1.0% for AGIs $25k-50k, 0.9% for AGIs $50k-75k, 2.4% for AGIs $75k-100k, 3.6% for AGIs over 100k)
Taxable dividends: $2,227 (reported on 10.6% of returns)
Here:
$2,227
State:
$5,879
(% of AGI for various income ranges: 0.4% for AGIs $10k-25k, 0.6% for AGIs $25k-50k, 1.2% for AGIs $50k-75k, 3.5% for AGIs $75k-100k)
Net capital gain/loss: +$274 (reported on 8.8% of returns)
Here:
+$274
State:
+$15,835
(% of AGI for various income ranges: -1.7% for AGIs below $10k, -0.0% for AGIs $10k-25k, -0.4% for AGIs $25k-50k, 1.4% for AGIs $50k-75k)
Profit/loss from business: +$4,024 (reported on 5.8% of returns)
Here:
+$4,024
State:
+$13,994
Profit/loss from farming: +$190 (reported on 3.0% of returns)
Here:
+$190
State:
-$6,197
Total itemized deductions: $13,333 (30% of AGI, reported on 7.2% of returns)
Here:
$13,333
State:
$19,669
Here:
29.9% of AGI
State:
20.7% of AGI
Charity contributions deductions: $1,767 (4% of AGI, reported on 4.2% of returns)
Here:
$1,767
State:
$3,569
Here:
3.6% of AGI
State:
3.5% of AGI
Total tax: $3,775 (reported on 47.2% of returns)
98813:
$3,775
State:
$9,065
(% of AGI for various income ranges: 2.8% for AGIs below $10k, 1.5% for AGIs $10k-25k, 4.9% for AGIs $25k-50k, 8.0% for AGIs $50k-75k, 10.4% for AGIs $75k-100k, 17.6% for AGIs over 100k)
Earned income credit: $2,169 (reported on 30.2% of returns)
Here:
$2,169
State:
$1,607
Percentage of individuals using paid preparers for their 2004 taxes: 51.1%
Here:
51%
State:
49%
(% for various income ranges: 47.6% for AGIs below $10k, 50.5% for AGIs $10k-25k, 51.3% for AGIs $25k-50k, 57.1% for AGIs $50k-75k, 50.0% for AGIs $75k-100k, 71.4% for AGIs over 100k)
Household received Food Stamps/SNAP in the past 12 months: 207 Household did not receive Food Stamps/SNAP in the past 12 months: 661
Women who had a birth in the past 12 months: 35 (20 now married, 14 unmarried) Women who did not have a birth in the past 12 months: 684 (384 now married, 297 unmarried)
Housing units in zip code 98813 with a mortgage: 140 Median monthly owner costs for units with a mortgage: $1,198 Median monthly owner costs for units without a mortgage: $403
Residents with income below the poverty level in 2022:
This zip code:
24.5%
Whole state:
10.0%
Residents with income below 50% of the poverty level in 2022:
This zip code:
11.4%
Whole state:
4.6%
Median number of rooms in houses and condos:
Here:
4.8
State:
6.5
Median number of rooms in apartments:
Here:
4.1
State:
3.9
Notable locations in this zip code not listed on our city pages
Notable locations in zip code 98813: Bridgeport Bar (A), Bridgeport Grange (B), Bridgeport Volunteer Fire and Rescue (C), Douglas - Okanogan County Fire District 15 Rocky Butte Station 40 (D). Display/hide their locations on the map
Lakes and reservoirs: Lone Pine Lake (A), McClain Lake (B), Dezellem Lake (C), Alexander Lake (D), Tinker Lake (E), Judson Lake (F), Rufus Woods Lake (G). Display/hide their locations on the map
Parks in zip code 98813 include: Waterfront Park (1), Chief Joseph State Park (2), Rock Ridge Park (3), Bridgeport State Park (4), Bridgeport Park (5). Display/hide their locations on the map
In group quarters: 535 (-1 institutionalized population)
Size of family households: 204 2-persons, 92 3-persons, 134 4-persons, 156 5-persons, 89 6-persons, 25 7-or-more-persons
Size of nonfamily households: 128 1-person, 27 2-persons
560 married couples with children.
285 single-parent households (65 men, 220 women).
16.7% of residents of 98813 zip code speak English at home.
89.7% of residents speak Spanish at home (37% very well, 8% well, 12% not well, 43% not at all).
Foreign born population: 1,917 (59.4%) (6.3% of them are naturalized citizens)
This zip code:
59.4%
Whole state:
15.3%
95%Honduras
8%Haiti
5%Jamaican
1%American
1%English
0%Norwegian
0%German
0%Italian
0%Welsh
Year of entry for the foreign-born population
9312010 or later
4912000 to 2009
3871990 to 1999
179Before 1990
Facilities with environmental interests located in this zip code:
BRIDGEPORT ELEMENTARY (1400 TACOMA in BRIDGEPORT, WA)
(National Center for Education Statistics) - STATE ID-2562 STATE MASTER (Washington State Department of Ecology's Facility/Site identification system) - TOXICS-, GROUND WATER PROGRAM Organizations: BRIDGEPORT SCHL DIST 075 (SCHOOL DISTRICT)
Alternative names: BRIDGEPORT ELEMENTARY SCHOOL
COLOMBIA LACE (151 JACK WELLS ROAD in BRIDGEPORT, WA)
Large Quantity Generators, more that 1000 kg of hazardous waste/month (Resource Conservation and Recovery Act (tracking hazardous waste)) STATE MASTER (Washington State Department of Ecology's Facility/Site identification system) - HAZWASTE-WAH000018275, LQG Business NAICS classification: ALL OTHER MISCELLANEOUS MANUFACTURING.; ALL OTHER MISCELLANEOUS MANUFACTURING. Organizations: KAREN BURNS (CONTACT/OPERATOR)
, US EPA (CONTACT/OWNER)
Alternative names: US EPA COLUMBIA LACE
BRIDGEPORT STP (1ST& FAIRVIEW in BRIDGEPORT, WA)
National Pollutant Discharge Elimination System NON-MAJOR (Tracking pollutant discharge elimination systems) - permit STATE MASTER (Washington State Department of Ecology's Facility/Site identification system) - WATQUAL-WA0024066, NPDES NON-MAJOR Business SIC classification: SEWERAGE SYSTEMS Organizations: BRIDGEPORT (STP) (CONTACT/OPERATOR)
Alternative names: BRIDGEPORT, TOWN OF
BRIDGEPORT HIGH SCHOOL (1350 TACOMA AVE in BRIDGEPORT, WA)
(Geographic Names Information System) (National Center for Education Statistics) - STATE ID-2788 Organizations: BRIDGEPORT SCHL DIST 075 (SCHOOL DISTRICT)
BRIDEGPORT MIDDLE SCHOOL (1300 DOUGLAS in BRIDGEPORT, WA)
(National Center for Education Statistics) - STATE ID-4213 Organizations: BRIDGEPORT SCHL DIST 075 (SCHOOL DISTRICT)
BRIDGEPORT AURORA HIGH SCHOOL (1300 DOUGLAS in BRIDGEPORT, WA)
(National Center for Education Statistics) - STATE ID-1900 Organizations: BRIDGEPORT SCHL DIST 075 (SCHOOL DISTRICT)
CHIEF JOSEPH SUBSTATION (HWY 17 S in BRIDGEPORT, WA)
ENFORCEMENT/COMPLIANCE ACTIVITY (Integrated Compliance Information System) STATE MASTER (Washington State Department of Ecology's Facility/Site identification system) - TOXICS-2855, UNDERGROUND STORAGE TANK PROGRAM
CASSIMER BAR SOCKEYE HATCHERY (48 CASSIMER BAR ROAD in BRIDGEPORT, WA) . Tribal Land
National Pollutant Discharge Elimination System NON-MAJOR (Tracking pollutant discharge elimination systems) - permit Business SIC classification: FISH HATCHERIES AND PRESERVES
COLVILLE CONFEDERATED TRIBES COLVILLE TRIBAL FISH HATCHERY (74 TRIBAL HATCHERY ROAD in BRIDGEPORT, WA) . Tribal Land
National Pollutant Discharge Elimination System NON-MAJOR (Tracking pollutant discharge elimination systems) - permit Business SIC classification: FISH HATCHERIES AND PRESERVES
COLVILLE TRIBAL FISH HATCHERY (77 TRIBAL HATCHERY ROAD in BRIDGEPORT, WA) . Tribal Land
ENFORCEMENT/COMPLIANCE ACTIVITY (Integrated Compliance Information System)
Housing units lacking complete plumbing facilities: 1.6% Housing units lacking complete kitchen facilities: 1.1%
99.3%Electricity
0.7%Bottled, tank, or LP gas
Population in 1990: 2,757.
Place of birth for U.S.-born residents:
This state: 1,108
Northeast: 20
Midwest: 30
South: 33
West: 144
53% of the 98813 zip code residents lived in the same house 5 years ago. Out of people who lived in different houses, 58% lived in this county. Out of people who lived in different counties, 50% lived in Washington.
98% of the 98813 zip code residents lived in the same house 1 year ago. Out of people who lived in different houses, 41% moved from different county within same state. Out of people who lived in different houses, 110% moved from abroad.
Private vs. public school enrollment:
Students in private schools in grades 1 to 8 (elementary and middle school): 17
Here:
3.8%
Washington:
12.4%
Students in private schools in grades 9 to 12 (high school):
Here:
0.0%
Washington:
9.2%
Students in private undergraduate colleges: 16
Here:
51.7%
Washington:
16.5%
Occupation by median earnings in the past 12 months ($)
103,603Production occupations
68,101Management occupations
56,706Construction and extraction occupations
49,024Education, training, and library occupations
35,682Office and administrative support occupations
35,528Transportation occupations
Companies with federal contracts located in this zip code (BRIDGEPORT, WA):
ARE-SEAS MAINTENANCE (2348 FOSTER CREEK AVE) : $324,191 in 18 contractsfrom 1999 to 2005
Contracts for Landscaping/Groundskeeping Services, Custodial Janitorial Services by U.S. Army Corps of Engineers - civil program financing only, Army Signed by year:2000: $71,602; 2001: $34,212; 2002: $57,619; 2003: $132,704; 2004: $0; 2005: -$886; 2006: $0.
Biggest contracts:
$36,530 with U.S. Army Corps of Engineers - civil program financing only for Landscaping/Groundskeeping Services. Signed on 2000-11-01. Completion date: 2001-10-31.
$36,403 with U.S. Army Corps of Engineers - civil program financing only for Custodial Janitorial Services. Signed on 2002-05-22. Completion date: 2006-02-28.
$35,528 with U.S. Army Corps of Engineers - civil program financing only for Landscaping/Groundskeeping Services. Signed on 2003-12-18. Completion date: 2004-12-31.
$35,528 with Army for Landscaping/Groundskeeping Services. Signed on 2003-12-18. Completion date: 2004-12-31.
DON CROCKER CONSTRUCTION (660 EDSON STREET; small business) : $89,939 in 4 contractsfrom 2000 to 2004
$56,550 with U.S. Army Corps of Engineers - civil program financing only for Maintenance, Repair or Alteration of Real Property -- Highways, Roads, Streets, Bridges, and Railways (includes resurfacing). Signed on 2000-09-11. Completion date: 2000-08-18.
$20,180 with U.S. Army Corps of Engineers - civil program financing only for Construction of Structures and Facilities -- Other Conservation and Development Facilities. Signed on 2000-07-03. Completion date: 2000-08-30.
$9,700 with U.S. Army Corps of Engineers - civil program financing only for Other Non-Building Structures. Signed on 2003-02-12. Completion date: 2003-04-15.
$3,509 with Army for Construction of Structures and Facilities -- Other Conservation and Development Facilities. Signed on 2004-09-25. Completion date: 2004-11-30.
SCHREIBER ADMIN ASSISTANCE (1744 DOUGLAS STREET; small business) : $41,664 in 4 contractsfrom 2003 to 2006
$26,040 with U.S. Army Corps of Engineers - civil program financing only for Other Professional Services. Signed on 2003-07-01. Completion date: 2003-11-30.
$15,624 with Army for Other Professional Services. Signed on 2004-01-15. Completion date: 2004-03-12.
$15,624 with U.S. Army Corps of Engineers - civil program financing only for Other Professional Services. Signed on 2004-01-15. Completion date: 2004-03-12.
-$15,624 with Army for Other Professional Services. Signed on 2006-07-12. Effective on 2006-06-20. Completion date: 2006-06-20.
BRIDGEPORT CITY OF (INC) (1206 COLUMBIA AVE; small business) : $36,207 in 22 contractsfrom 2001 to 2006
Contracts for Maintenance, Repair or Alteration of Real Property -- Sewage and Waste Facilities, Water Services, Chemical/Biological Studies and Analyses, Fire Protection Services, and moreby U.S. Army Corps of Engineers - civil program financing only, Army Signed by year:2000: $0; 2001: $4,269; 2002: $0; 2003: $30,319; 2004: -$16,330; 2005: $15,175; 2006: $2,774.
Biggest contracts:
$10,099 with U.S. Army Corps of Engineers - civil program financing only for Maintenance, Repair or Alteration of Real Property -- Sewage and Waste Facilities. Signed on 2003-03-13. Completion date: 2003-12-31.
$5,370 with Army for Water Services. Signed on 2003-12-24. Completion date: 2003-12-31.
$5,370 with U.S. Army Corps of Engineers - civil program financing only for Water Services. Signed on 2003-12-24. Completion date: 2003-12-31.
$5,265 with Army for Water Services. Signed on 2005-12-21. Completion date: 2003-12-31.
Top industries in this zip code by the number of employees in 2005:
Health Care and Social Assistance: Child Day Care Services (10-19 employees: 1 establishment, 1-4 employees: 2 establishments)
Accommodation and Food Services: Full-Service Restaurants (5-9: 1)
Finance and Insurance: Commercial Banking (5-9: 1)
Arts, Entertainment, and Recreation: All Other Amusement and Recreation Industries (1-4: 1)
Accommodation and Food Services: Limited-Service Restaurants (1-4: 1)
Finance and Insurance: Credit Unions (1-4: 1)
Arts, Entertainment, and Recreation: Golf Courses and Country Clubs (1-4: 1)
Fatal accident statistics in 2012:
Fatal accident count: 2
Vehicles involved in fatal accidents: 2
Fatal accidents caused by drunken drivers: 2
Fatalities: 2
Persons involved in fatal accidents: 5
Pedestrians involved in fatal accidents: 0
Home Mortgage Disclosure Act Aggregated Statistics For Year 2009 (Based on 2 partial tracts)
A) FHA, FSA/RHS & VA Home Purchase Loans
B) Conventional Home Purchase Loans
C) Refinancings
D) Home Improvement Loans
F) Non-occupant Loans on < 5 Family Dwellings (A B C & D)
G) Loans On Manufactured Home Dwelling (A B C & D)
Number
Average Value
Number
Average Value
Number
Average Value
Number
Average Value
Number
Average Value
Number
Average Value
LOANS ORIGINATED
2
$178,475
6
$312,405
31
$239,554
2
$60,360
18
$299,129
3
$190,853
APPLICATIONS APPROVED, NOT ACCEPTED
0
$0
0
$0
2
$229,025
0
$0
1
$268,020
1
$63,090
APPLICATIONS DENIED
0
$0
2
$204,435
10
$242,811
2
$128,545
3
$404,230
2
$116,125
APPLICATIONS WITHDRAWN
0
$0
1
$551,450
5
$233,744
1
$96,130
2
$281,560
1
$92,160
FILES CLOSED FOR INCOMPLETENESS
0
$0
0
$0
0
$0
0
$0
1
$182,570
0
$0
Aggregated Statistics For Year 2008 (Based on 2 partial tracts)
A) FHA, FSA/RHS & VA Home Purchase Loans
B) Conventional Home Purchase Loans
C) Refinancings
D) Home Improvement Loans
F) Non-occupant Loans on < 5 Family Dwellings (A B C & D)
G) Loans On Manufactured Home Dwelling (A B C & D)
Number
Average Value
Number
Average Value
Number
Average Value
Number
Average Value
Number
Average Value
Number
Average Value
LOANS ORIGINATED
1
$161,460
9
$306,167
14
$275,156
2
$92,030
13
$339,754
2
$167,175
APPLICATIONS APPROVED, NOT ACCEPTED
0
$0
1
$172,390
4
$182,822
0
$0
2
$220,205
1
$112,530
APPLICATIONS DENIED
0
$0
1
$255,850
7
$169,196
2
$137,860
2
$270,135
2
$82,840
APPLICATIONS WITHDRAWN
0
$0
2
$370,365
3
$164,110
0
$0
1
$229,520
1
$152,770
FILES CLOSED FOR INCOMPLETENESS
0
$0
0
$0
0
$0
0
$0
0
$0
0
$0
Aggregated Statistics For Year 2007 (Based on 2 partial tracts)
A) FHA, FSA/RHS & VA Home Purchase Loans
B) Conventional Home Purchase Loans
C) Refinancings
D) Home Improvement Loans
F) Non-occupant Loans on < 5 Family Dwellings (A B C & D)
G) Loans On Manufactured Home Dwelling (A B C & D)
Number
Average Value
Number
Average Value
Number
Average Value
Number
Average Value
Number
Average Value
Number
Average Value
LOANS ORIGINATED
1
$101,350
11
$252,848
15
$274,085
1
$236,730
12
$359,352
3
$172,140
APPLICATIONS APPROVED, NOT ACCEPTED
0
$0
2
$446,995
2
$185,305
0
$0
1
$290,130
0
$0
APPLICATIONS DENIED
1
$77,750
3
$199,797
9
$485,126
4
$63,778
2
$371,110
2
$119,730
APPLICATIONS WITHDRAWN
0
$0
1
$87,440
3
$370,530
0
$0
2
$450,600
1
$71,790
FILES CLOSED FOR INCOMPLETENESS
0
$0
0
$0
0
$0
0
$0
0
$0
0
$0
Aggregated Statistics For Year 2006 (Based on 2 partial tracts)
B) Conventional Home Purchase Loans
C) Refinancings
D) Home Improvement Loans
F) Non-occupant Loans on < 5 Family Dwellings (A B C & D)
G) Loans On Manufactured Home Dwelling (A B C & D)
Number
Average Value
Number
Average Value
Number
Average Value
Number
Average Value
Number
Average Value
LOANS ORIGINATED
14
$208,709
13
$155,995
1
$225,800
14
$242,048
2
$107,930
APPLICATIONS APPROVED, NOT ACCEPTED
1
$128,920
1
$324,660
0
$0
1
$324,160
1
$69,300
APPLICATIONS DENIED
3
$142,003
11
$160,715
2
$33,905
2
$267,280
2
$115,135
APPLICATIONS WITHDRAWN
1
$261,070
5
$161,758
0
$0
2
$148,545
0
$0
FILES CLOSED FOR INCOMPLETENESS
0
$0
2
$160,465
0
$0
0
$0
0
$0
Aggregated Statistics For Year 2005 (Based on 2 partial tracts)
B) Conventional Home Purchase Loans
C) Refinancings
D) Home Improvement Loans
F) Non-occupant Loans on < 5 Family Dwellings (A B C & D)
G) Loans On Manufactured Home Dwelling (A B C & D)
Number
Average Value
Number
Average Value
Number
Average Value
Number
Average Value
Number
Average Value
LOANS ORIGINATED
15
$152,153
17
$130,673
1
$38,500
11
$172,615
7
$89,886
APPLICATIONS APPROVED, NOT ACCEPTED
1
$219,090
3
$119,563
0
$0
2
$151,275
1
$136,870
APPLICATIONS DENIED
7
$154,576
11
$96,966
3
$104,577
2
$182,075
5
$102,092
APPLICATIONS WITHDRAWN
2
$112,650
6
$121,220
1
$75,760
1
$181,330
1
$81,230
FILES CLOSED FOR INCOMPLETENESS
0
$0
2
$209,275
0
$0
0
$0
0
$0
Aggregated Statistics For Year 2004 (Based on 2 partial tracts)
A) FHA, FSA/RHS & VA Home Purchase Loans
B) Conventional Home Purchase Loans
C) Refinancings
D) Home Improvement Loans
F) Non-occupant Loans on < 5 Family Dwellings (A B C & D)
G) Loans On Manufactured Home Dwelling (A B C & D)
Detailed PMIC statistics for the following Tracts:9501.00
2002 - 2018 National Fire Incident Reporting System (NFIRS) incidents
Based on the data from the years 2002 - 2018 the average number of fire incidents per year is 14. The highest number of reported fire incidents - 35 took place in 2006, and the least - 3 in 2011. The data has a growing trend.
When looking into fire subcategories, the most reports belonged to: Outside Fires (55.9%), and Other (25.0%).
Fire incident types reported to NFIRS in Zip Code 98813


+$190
-$6,197
 Nearest zip codes: 98830, 98812, 98840, 98829, 98846, 99115.


 Based on the data from the years 2002 - 2018 the average number of fire incidents per year is 14. The highest number of reported fire incidents - 35 took place in 2006, and the least - 3 in 2011. The data has a growing trend.
 When looking into fire subcategories, the most reports belonged to: Outside Fires (55.9%), and Other (25.0%).