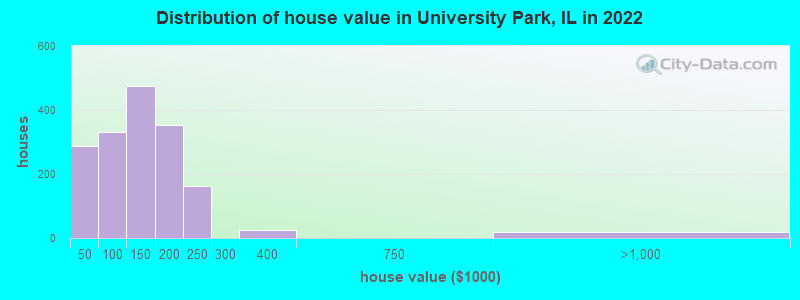
Estimated median house or condo value in 2022: $134,323 (it was $91,500 in 2000)
University Park:
$134,323
IL:
$251,600
Mean prices in 2022:all housing units: $320,602; detached houses: $341,136; townhouses or other attached units: $239,631; in 2-unit structures: $239,357; in 3-to-4-unit structures: $200,351; in 5-or-more-unit structures: $168,162; mobile homes: $77,508; occupied boats, rvs, vans, etc.: over $1,000,000
Median gross rent in 2022: $1,325.
March 2022 cost of living index in University Park: 99.5 (near average, U.S. average is 100)
Percentage of residents living in poverty in 2022: 10.7%
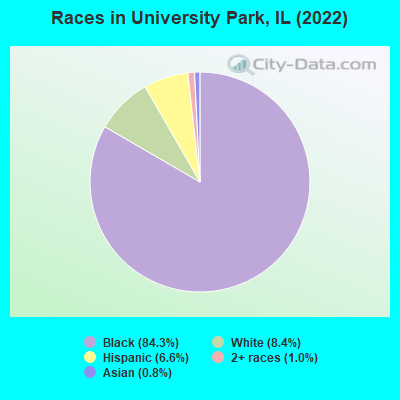
(12.3% for White Non-Hispanic residents, 8.2% for Black residents, 29.7% for Hispanic or Latino residents, 91.2% for two or more races residents)
According to our research of Illinois and other state lists, there were 10 registered sex offenders living in University Park, Illinois as of May 19, 2024. The ratio of all residents to sex offenders in University Park is 724 to 1. The ratio of registered sex offenders to all residents in this city is near the state average.
Crime rates in University Park by year
Type
2015
2018
2019
2020
2021
2022
Murders (per 100,000)
1 (14.1)
1 (14.3)
4 (57.7)
1 (14.6)
0 (0.0)
2 (28.4)
Rapes (per 100,000)
2 (28.2)
3 (42.9)
0 (0.0)
0 (0.0)
1 (14.7)
5 (71.0)
Robberies (per 100,000)
7 (98.8)
7 (100.2)
27 (389.2)
7 (102.0)
4 (58.9)
5 (71.0)
Assaults (per 100,000)
3 (42.3)
9 (128.8)
13 (187.4)
11 (160.3)
7 (103.1)
12 (170.5)
Burglaries (per 100,000)
14 (197.5)
33 (472.2)
28 (403.6)
13 (189.5)
0 (0.0)
6 (85.3)
Thefts (per 100,000)
68 (959.5)
89 (1,273)
69 (994.7)
48 (699.6)
19 (279.9)
57 (809.9)
Auto thefts (per 100,000)
5 (70.6)
8 (114.5)
12 (173.0)
23 (335.2)
9 (132.6)
45 (639.4)
Arson (per 100,000)
0 (0.0)
0 (0.0)
1 (14.4)
0 (0.0)
0 (0.0)
0 (0.0)
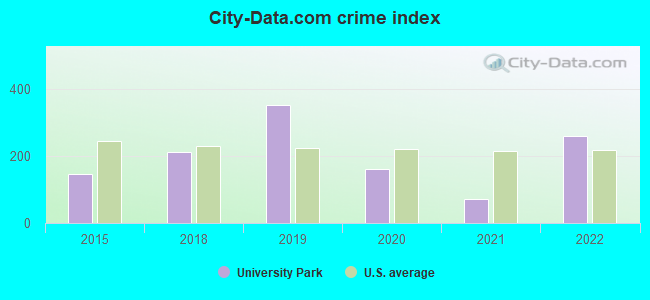
City-Data.com crime index
146.7
211.9
351.4
159.9
71.9
258.6
The City-Data.com crime index weighs serious crimes and violent crimes more heavily. Higher means more crime, U.S. average is 246.1. It adjusts for the number of visitors and daily workers commuting into cities.
Latest news from University Park, IL collected exclusively by city-data.com from local newspapers, TV, and radio stations
Ancestries: African (19.1%), Polish (3.9%), English (1.4%), Nigerian (1.3%).
Current Local Time: CST time zone
Incorporated on 09/13/1967
Land area: 9.76 square miles.
Population density: 719 people per square mile (low).
430 residents are foreign born (4.6% Africa, 0.8% Latin America).
This village:
5.9%
Illinois:
14.1%
Median real estate property taxes paid for housing units with mortgages in 2022: $5,158 (3.3%) Median real estate property taxes paid for housing units with no mortgage in 2022: $3,256 (4.0%)
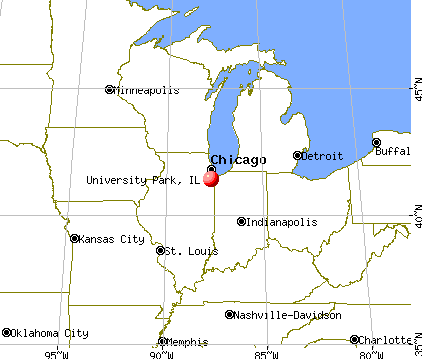
Nearest city with pop. 50,000+: Orland Park, IL (14.4 miles , pop. 51,077).
Nearest city with pop. 200,000+: Chicago, IL (27.8 miles , pop. 2,896,016).
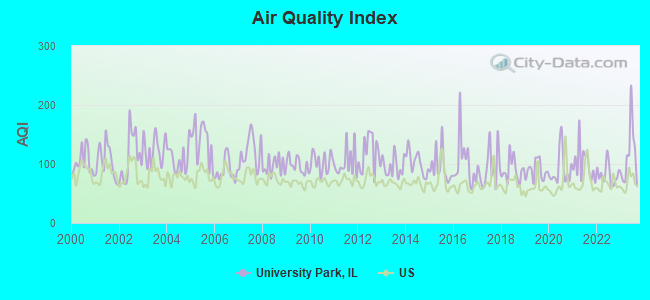
Air Quality Index (AQI) level in 2023 was 114. This is significantly worse than average.
City:
114
U.S.:
73
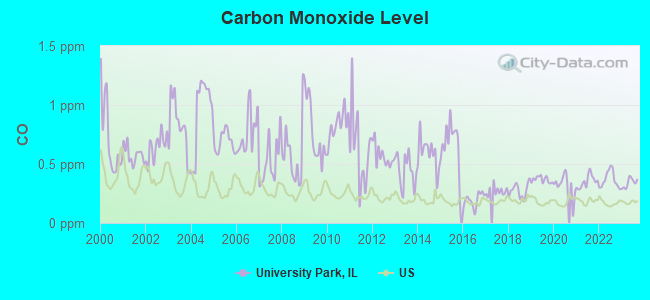
Carbon Monoxide (CO) [ppm] level in 2023 was 0.339. This is worse than average.Closest monitor was 5.9 miles away from the city center.
City:
0.339
U.S.:
0.251
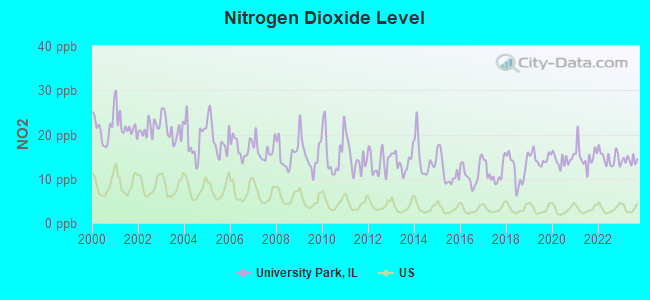
Nitrogen Dioxide (NO2) [ppb] level in 2023 was 14.2. This is significantly worse than average.Closest monitor was 5.6 miles away from the city center.
City:
14.2
U.S.:
5.1
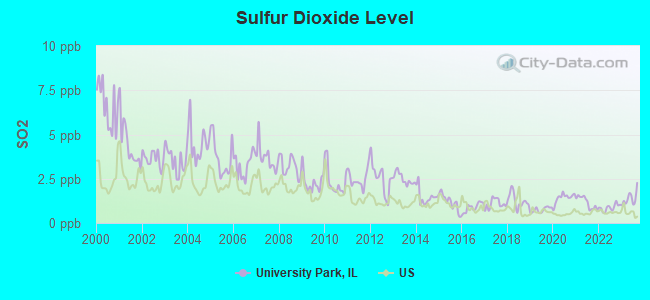
Sulfur Dioxide (SO2) [ppb] level in 2023 was 1.38. This is about average.Closest monitor was 5.6 miles away from the city center.
City:
1.38
U.S.:
1.51
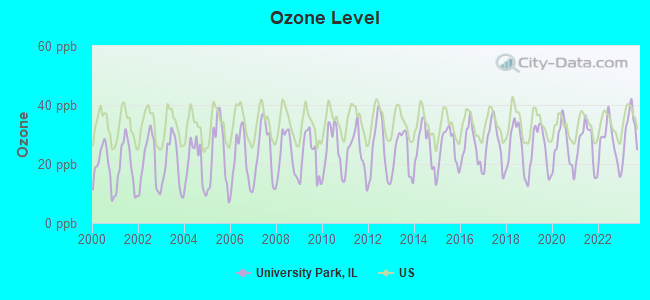
Ozone [ppb] level in 2023 was 31.2. This is about average.Closest monitor was 5.9 miles away from the city center.
City:
31.2
U.S.:
33.3
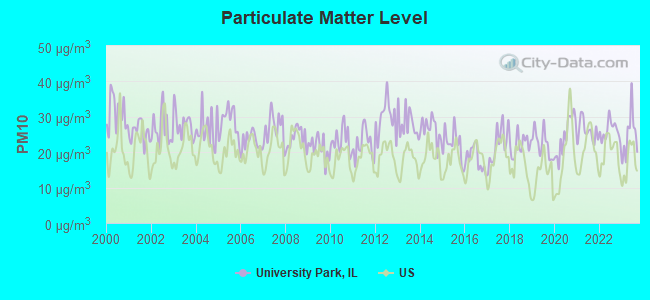
Particulate Matter (PM10) [µg/m3] level in 2023 was 24.8. This is worse than average.Closest monitor was 12.2 miles away from the city center.
City:
24.8
U.S.:
19.2
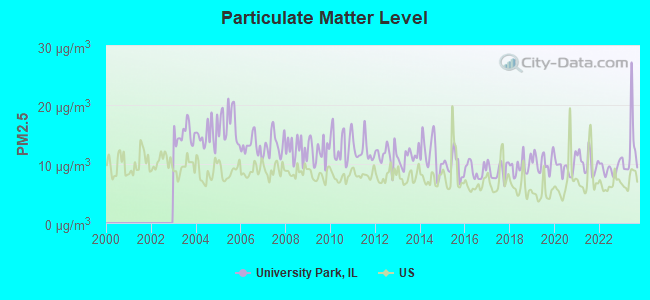
Particulate Matter (PM2.5) [µg/m3] level in 2023 was 12.5. This is significantly worse than average.Closest monitor was 12.0 miles away from the city center.
City:
12.5
U.S.:
8.1
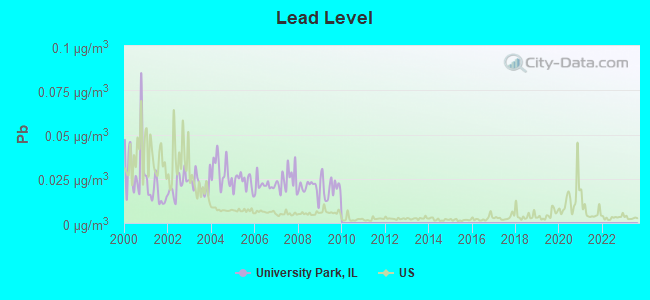
Lead (Pb) [µg/m3] level in 2009 was 0.0202. This is significantly worse than average.Closest monitor was 2.5 miles away from the city center.
City:
0.0202
U.S.:
0.0093
Tornado activity:
University Park-area historical tornado activity is near Illinois state average. It is 66% greater than the overall U.S. average.
On 8/28/1990, a category F5 (max. wind speeds 261-318 mph) tornado 21.6 miles away from the University Park village center killed 29 peopleand injured 350 peopleand causedbetween $50,000 and $500,000 in damages.
On 4/21/1967, a category F4 (max. wind speeds 207-260 mph) tornado 17.4 miles away from the village center killed 33 peopleand injured 500 peopleand causedbetween $5,000,000 and $50,000,000 in damages.
Earthquake activity:
University Park-area historical earthquake activity is significantly above Illinois state average. It is 49% greater than the overall U.S. average.
On 4/18/2008 at 09:36:59, a magnitude 5.4 (5.1 MB, 4.8 MS, 5.4 MW, 5.2 MW, Class: Moderate, Intensity: VI - VII) earthquake occurred 206.9 miles away from the city center On 6/10/1987 at 23:48:54, a magnitude 5.1 (4.9 MB, 4.4 MS, 4.6 MS, 5.1 LG) earthquake occurred 181.4 miles away from University Park center On 4/18/2008 at 09:36:59, a magnitude 5.2 (5.2 MW, Depth: 8.9 mi) earthquake occurred 206.9 miles away from the city center On 6/28/2004 at 06:10:52, a magnitude 4.2 (4.2 MW, Depth: 6.2 mi, Class: Light, Intensity: IV - V) earthquake occurred 62.4 miles away from University Park center On 6/18/2002 at 17:37:15, a magnitude 5.0 (4.3 MB, 4.6 MW, 5.0 LG) earthquake occurred 238.8 miles away from University Park center On 4/18/2008 at 15:14:16, a magnitude 4.8 (4.5 MB, 4.8 MW, 4.6 MW) earthquake occurred 205.1 miles away from the city center Magnitude types: regional Lg-wave magnitude (LG), body-wave magnitude (MB), surface-wave magnitude (MS), moment magnitude (MW)
Natural disasters:
The number of natural disasters in Will County (17) is near the US average (15). Major Disasters (Presidential) Declared: 12 Emergencies Declared: 4
Causes of natural disasters: Storms: 9, Floods: 7, Tornadoes: 5, Snowstorms: 2, Winds: 2, Winter Storms: 2, Blizzard: 1, Hurricane: 1, Snow: 1, Other: 1 (Note: some incidents may be assigned to more than one category).
Hospitals and medical centers in University Park:
BURNHAM HOUSE (545 BURNHAM)
WILLOW HOUSE (555 BURNHAM)
Other hospitals and medical centers near University Park:
HEALTHY HEART NURSE, INC (Home Health Center, about 3 miles away; CRETE, IL)
FOREST HOME HEALTHCARE, INC (Home Health Center, about 4 miles away; PARK FOREST, IL)
RELIABLE HEALTHCARE SERVICES, LLC (Home Health Center, about 4 miles away; PARK FOREST, IL)
HIS GRACE HOME HEALTHCARE, INC (Home Health Center, about 4 miles away; PARK FOREST, IL)
GLENSHIRE NURSING AND REHAB CTRE (Nursing Home, about 4 miles away; RICHTON PARK, IL)
ELISABETH LUDEMAN DEV. CTR. (Hospital, about 4 miles away; PARK FOREST, IL)
FMC - STEGER DIALYSIS (Dialysis Facility, about 5 miles away; STEGER, IL)
Amtrak stations near University Park:
9 miles: HOMEWOOD (181 1ST ST. & PARK AVE.) . Services: ticket office, enclosed waiting area, public restrooms, public payphones, paid short-term parking, paid long-term parking, public transit connection.
UNIVERSITY PARK PUBLIC LIBRARY DISTRICT (Operating income: $346,120; Location: 1100 BLACKHAWK DRIVE; 32,340 books; 1,258 audio materials; 1,913 video materials; 4 local licensed databases; 16 state licensed databases; 1 other licensed databases)
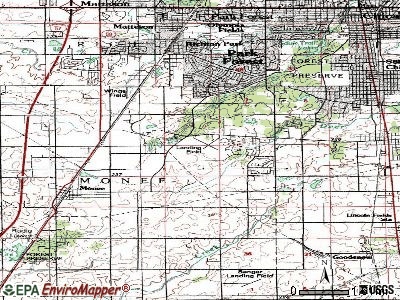
Notable locations in University Park: Deer Creek Golf Course (A), University Park Metrorail Station (B), University Park Fire Department Station 2 (C), University Park Fire Department Station 1 (D), University Park Public Library (E), University Park Village Hall (F). Display/hide their locations on the map
Parks in University Park include: Craig Park (1), Pine Lake Park (2), Thorn Creek Forest Preserve (3), Riegel Farm Park (4). Display/hide their locations on the map
Birthplace of: Keith Rucker - Football player, Roderick Middleton - College basketball player (Buffalo Bulls).
Will County has a predicted average indoor radon screening level between 2 and 4 pCi/L (pico curies per liter) - Moderate Potential
Drinking water stations with addresses in University Park that have no violations reported:
AQUA INDIANA WATER COMPANY (Serves IN, Population served: 1,018,Primary Water Source Type: Purch groundwater)
UP FOOD AND LIQUOR (Population served: 100,Primary Water Source Type: Groundwater)
Average household size:
This village:
2.9 people
Illinois:
2.6 people
Percentage of family households:
This village:
73.3%
Whole state:
65.8%
Percentage of households with unmarried partners:
This village:
7.8%
Whole state:
6.3%
Likely homosexual households (counted as self-reported same-sex unmarried-partner households)
Lesbian couples: 0.5% of all households
Gay men: 0.2% of all households
31 people in residential treatment centers for adults in 2010
32 people in homes for the mentally retarded in 2000
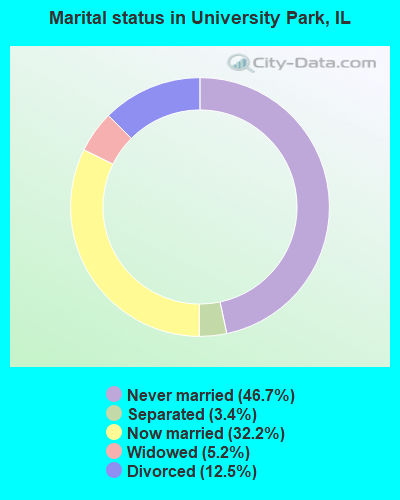
For population 15 years and over in University Park:
Never married: 46.7%
Now married: 32.2%
Separated: 3.4%
Widowed: 5.2%
Divorced: 12.5%
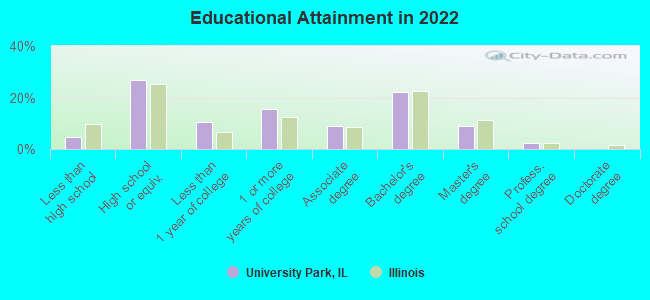
For population 25 years and over in University Park:
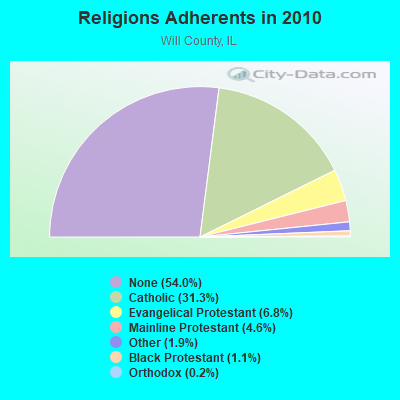
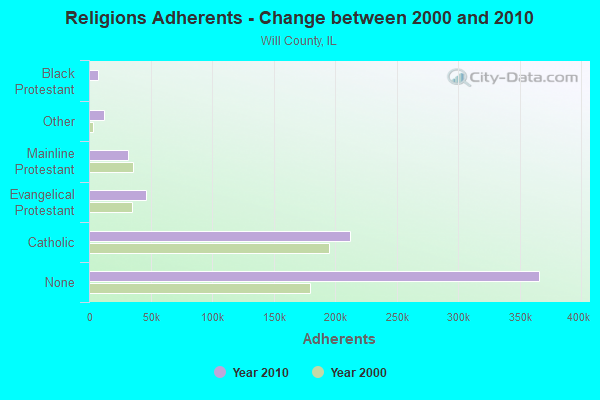
Religion statistics for University Park, IL (based on Will County data)
Religion
Adherents
Congregations
Catholic
212,252
39
Evangelical Protestant
46,404
188
Mainline Protestant
31,313
73
Other
12,574
20
Black Protestant
7,426
16
Orthodox
1,536
6
None
366,055
-
Source: Clifford Grammich, Kirk Hadaway, Richard Houseal, Dale E.Jones, Alexei Krindatch, Richie Stanley and Richard H.Taylor. 2012. 2010 U.S.Religion Census: Religious Congregations & Membership Study. Association of Statisticians of American Religious Bodies. Jones, Dale E., et al. 2002. Congregations and Membership in the United States 2000. Nashville, TN: Glenmary Research Center. Graphs represent county-level data
Call Sign: K9CZL, Licensee ID: L00148747, Grant Date: 04/05/2006, Expiration Date: 06/06/2016, Cancellation Date: 06/07/2018, Certifier: Israel L Simmons Iii, Registrant: Israel L Simmons Iii, 1031 Samson Dr, University Park, IL 60466
Call Sign: KB9SIU, Licensee ID: L01223706, Grant Date: 03/13/2018, Expiration Date: 03/20/2028, Registrant: Theaplise M Brooks, 605 Old Forge Lane, University Park, IL 60484
Call Sign: N9OTP, Licensee ID: L00814559, Grant Date: 02/14/2014, Expiration Date: 05/10/2024, Certifier: William Rainey, Registrant: William Rainey, 534 Hickok Ave, University Park, IL 60466
Call Sign: WA5RXI, Grant Date: 02/03/1995, Expiration Date: 02/03/2005, Cancellation Date: 02/06/2007, Registrant: Robert B Thomas, 706 Circle Dr, University Park, IL 60466
Call Sign: WB9WJE, Licensee ID: L00152225, Grant Date: 01/12/2021, Expiration Date: 01/12/2031, Certifier: Anthony J Gray, Registrant: Anthony J Gray, 1402 Pine Woods Ct., University Park, IL 60484
Call Sign: KC9KVH, Licensee ID: L01246548, Grant Date: 02/15/2007, Expiration Date: 02/15/2017, Cancellation Date: 02/16/2019, Certifier: Frank H Bronecke, Registrant: Frank H Bronecke, 1007 Samson Dr, University Park, IL 60466
FAA Registered Aircraft:
1
Aircraft: PIPER PA-23-250 (Category: Land, Engines: 2, Seats: 6, Weight: Up to 12,499 Pounds, Speed: 150 mph), Engine: LYCOMING 0-540 SERIES (250 HP) (Reciprocating) N-Number: 4678P, N4678P, N-4678P, Serial Number: 27-207, Year manufactured: 1960, Airworthiness Date: 06/06/1960, Certificate Issue Date: 11/09/1995 Registrant (Co-Owned): Winfred K Rudloff, Governors State University, University Park, IL 60466, Other Owners: John M Ayala Deregistered:Cancel Date: 01/23/2018
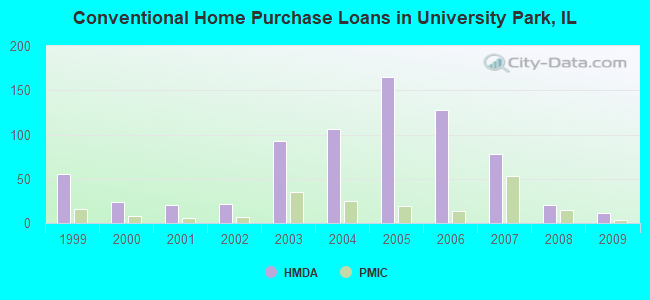
Home Mortgage Disclosure Act Aggregated Statistics For Year 2009 (Based on 3 partial tracts)
A) FHA, FSA/RHS & VA Home Purchase Loans
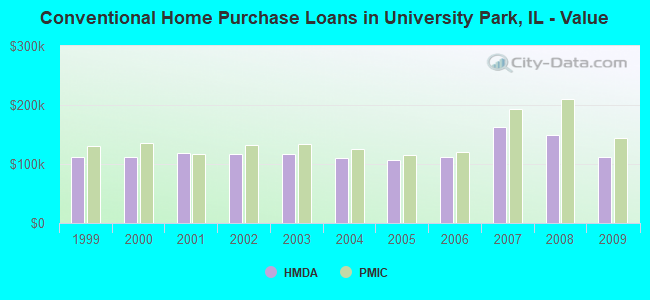
B) Conventional Home Purchase Loans
C) Refinancings
D) Home Improvement Loans
F) Non-occupant Loans on < 5 Family Dwellings (A B C & D)
G) Loans On Manufactured Home Dwelling (A B C & D)
Number
Average Value
Number
Average Value
Number
Average Value
Number
Average Value
Number
Average Value
Number
Average Value
LOANS ORIGINATED
24
$137,530
11
$112,126
71
$169,040
3
$34,947
11
$72,502
0
$0
APPLICATIONS APPROVED, NOT ACCEPTED
4
$186,585
0
$0
9
$172,789
1
$226,210
1
$79,420
0
$0
APPLICATIONS DENIED
6
$136,297
3
$77,807
45
$147,606
9
$33,001
4
$99,555
1
$25,400
APPLICATIONS WITHDRAWN
5
$132,418
1
$133,490
19
$170,043
1
$82,940
1
$88,310
0
$0
FILES CLOSED FOR INCOMPLETENESS
2
$158,680
1
$71,120
8
$123,949
0
$0
0
$0
0
$0
Aggregated Statistics For Year 2008 (Based on 3 partial tracts)
A) FHA, FSA/RHS & VA Home Purchase Loans
B) Conventional Home Purchase Loans
C) Refinancings
D) Home Improvement Loans
E) Loans on Dwellings For 5+ Families
F) Non-occupant Loans on < 5 Family Dwellings (A B C & D)
G) Loans On Manufactured Home Dwelling (A B C & D)
Number
Average Value
Number
Average Value
Number
Average Value
Number
Average Value
Number
Average Value
Number
Average Value
Number
Average Value
LOANS ORIGINATED
21
$151,936
20
$149,889
61
$153,258
4
$68,320
1
$2,284,200
12
$79,968
2
$30,975
APPLICATIONS APPROVED, NOT ACCEPTED
1
$228,940
5
$116,484
12
$143,534
1
$5,830
0
$0
2
$81,220
0
$0
APPLICATIONS DENIED
14
$160,354
12
$127,254
74
$167,183
13
$66,370
0
$0
11
$65,566
1
$30,500
APPLICATIONS WITHDRAWN
5
$175,564
6
$138,285
22
$179,713
0
$0
0
$0
3
$70,410
0
$0
FILES CLOSED FOR INCOMPLETENESS
0
$0
4
$203,395
11
$195,922
1
$26,170
0
$0
1
$154,220
0
$0
Aggregated Statistics For Year 2007 (Based on 3 partial tracts)
A) FHA, FSA/RHS & VA Home Purchase Loans
B) Conventional Home Purchase Loans
C) Refinancings
D) Home Improvement Loans
F) Non-occupant Loans on < 5 Family Dwellings (A B C & D)
G) Loans On Manufactured Home Dwelling (A B C & D)
Number
Average Value
Number
Average Value
Number
Average Value
Number
Average Value
Number
Average Value
Number
Average Value
LOANS ORIGINATED
8
$146,259
78
$163,039
93
$146,167
10
$86,508
19
$96,012
1
$37,590
APPLICATIONS APPROVED, NOT ACCEPTED
1
$46,660
16
$197,618
24
$143,920
3
$25,343
3
$70,513
0
$0
APPLICATIONS DENIED
1
$193,040
52
$194,277
114
$159,776
25
$63,280
18
$95,261
1
$29,360
APPLICATIONS WITHDRAWN
1
$93,720
8
$127,236
43
$170,162
4
$44,725
5
$87,230
0
$0
FILES CLOSED FOR INCOMPLETENESS
0
$0
5
$224,356
12
$155,562
1
$6,480
4
$77,960
0
$0
Aggregated Statistics For Year 2006 (Based on 3 partial tracts)
A) FHA, FSA/RHS & VA Home Purchase Loans
B) Conventional Home Purchase Loans
C) Refinancings
D) Home Improvement Loans
E) Loans on Dwellings For 5+ Families
F) Non-occupant Loans on < 5 Family Dwellings (A B C & D)
G) Loans On Manufactured Home Dwelling (A B C & D)
Number
Average Value
Number
Average Value
Number
Average Value
Number
Average Value
Number
Average Value
Number
Average Value
Number
Average Value
LOANS ORIGINATED
9
$156,800
128
$112,039
139
$133,089
18
$77,947
0
$0
46
$90,872
1
$46,020
APPLICATIONS APPROVED, NOT ACCEPTED
0
$0
29
$106,987
32
$122,752
3
$31,747
1
$2,980,800
13
$79,672
0
$0
APPLICATIONS DENIED
0
$0
60
$100,575
127
$148,836
13
$54,065
0
$0
29
$86,449
1
$70,170
APPLICATIONS WITHDRAWN
0
$0
22
$121,161
61
$163,320
2
$162,655
0
$0
11
$135,844
0
$0
FILES CLOSED FOR INCOMPLETENESS
0
$0
3
$144,390
24
$165,165
1
$34,110
0
$0
1
$83,470
0
$0
Aggregated Statistics For Year 2005 (Based on 3 partial tracts)
A) FHA, FSA/RHS & VA Home Purchase Loans
B) Conventional Home Purchase Loans
C) Refinancings
D) Home Improvement Loans
E) Loans on Dwellings For 5+ Families
F) Non-occupant Loans on < 5 Family Dwellings (A B C & D)
G) Loans On Manufactured Home Dwelling (A B C & D)
Number
Average Value
Number
Average Value
Number
Average Value
Number
Average Value
Number
Average Value
Number
Average Value
Number
Average Value
LOANS ORIGINATED
11
$149,529
165
$106,549
128
$133,022
13
$56,312
1
$10,636,200
31
$84,349
2
$36,015
APPLICATIONS APPROVED, NOT ACCEPTED
2
$124,695
34
$93,718
23
$121,652
1
$82,430
0
$0
10
$93,748
0
$0
APPLICATIONS DENIED
2
$143,275
61
$110,157
155
$132,996
24
$49,012
0
$0
21
$87,102
4
$77,665
APPLICATIONS WITHDRAWN
0
$0
20
$105,512
64
$135,990
5
$134,278
0
$0
11
$118,543
0
$0
FILES CLOSED FOR INCOMPLETENESS
0
$0
10
$107,121
22
$133,638
1
$48,600
0
$0
3
$89,693
0
$0
Aggregated Statistics For Year 2004 (Based on 3 partial tracts)
A) FHA, FSA/RHS & VA Home Purchase Loans
B) Conventional Home Purchase Loans
C) Refinancings
D) Home Improvement Loans
E) Loans on Dwellings For 5+ Families
F) Non-occupant Loans on < 5 Family Dwellings (A B C & D)
G) Loans On Manufactured Home Dwelling (A B C & D)
Number
Average Value
Number
Average Value
Number
Average Value
Number
Average Value
Number
Average Value
Number
Average Value
Number
Average Value
LOANS ORIGINATED
11
$122,436
106
$110,448
134
$119,121
17
$60,414
1
$125,640
28
$62,792
1
$48,670
APPLICATIONS APPROVED, NOT ACCEPTED
2
$133,930
29
$91,273
27
$116,228
4
$43,662
0
$0
7
$76,971
0
$0
APPLICATIONS DENIED
4
$157,428
38
$100,943
116
$111,844
21
$50,506
0
$0
17
$60,388
1
$59,440
APPLICATIONS WITHDRAWN
2
$117,520
15
$93,525
48
$125,663
3
$95,973
0
$0
6
$64,968
1
$54,420
FILES CLOSED FOR INCOMPLETENESS
1
$20,090
6
$83,525
22
$123,553
1
$88,510
0
$0
3
$52,957
0
$0
Aggregated Statistics For Year 2003 (Based on 3 partial tracts)
A) FHA, FSA/RHS & VA Home Purchase Loans
B) Conventional Home Purchase Loans
C) Refinancings
D) Home Improvement Loans
E) Loans on Dwellings For 5+ Families
F) Non-occupant Loans on < 5 Family Dwellings (A B C & D)
Number
Average Value
Number
Average Value
Number
Average Value
Number
Average Value
Number
Average Value
Number
Average Value
LOANS ORIGINATED
26
$149,135
93
$117,302
207
$118,912
5
$22,748
1
$8,100,000
18
$66,611
APPLICATIONS APPROVED, NOT ACCEPTED
3
$163,447
23
$118,409
33
$104,660
1
$19,690
1
$8,035,200
3
$79,210
APPLICATIONS DENIED
3
$102,123
32
$96,609
135
$100,431
17
$20,094
1
$8,481,020
9
$70,341
APPLICATIONS WITHDRAWN
2
$79,725
14
$83,149
54
$101,721
1
$23,470
0
$0
5
$66,888
FILES CLOSED FOR INCOMPLETENESS
0
$0
6
$101,313
17
$123,597
1
$16,990
0
$0
1
$75,170
Aggregated Statistics For Year 2002 (Based on 1 partial tract)
A) FHA, FSA/RHS & VA Home Purchase Loans
B) Conventional Home Purchase Loans
C) Refinancings
D) Home Improvement Loans
F) Non-occupant Loans on < 5 Family Dwellings (A B C & D)
Number
Average Value
Number
Average Value
Number
Average Value
Number
Average Value
Number
Average Value
LOANS ORIGINATED
11
$141,916
22
$116,854
47
$132,357
1
$27,330
4
$55,348
APPLICATIONS APPROVED, NOT ACCEPTED
0
$0
3
$142,543
7
$117,436
0
$0
1
$90,220
APPLICATIONS DENIED
1
$116,640
7
$91,817
24
$129,811
3
$25,537
1
$59,130
APPLICATIONS WITHDRAWN
2
$118,670
4
$93,270
9
$131,267
0
$0
1
$44,910
FILES CLOSED FOR INCOMPLETENESS
0
$0
2
$86,310
9
$112,506
0
$0
0
$0
Aggregated Statistics For Year 2001 (Based on 1 partial tract)
A) FHA, FSA/RHS & VA Home Purchase Loans
B) Conventional Home Purchase Loans
C) Refinancings
D) Home Improvement Loans
F) Non-occupant Loans on < 5 Family Dwellings (A B C & D)
Number
Average Value
Number
Average Value
Number
Average Value
Number
Average Value
Number
Average Value
LOANS ORIGINATED
11
$132,846
20
$118,714
45
$130,689
3
$32,987
3
$70,410
APPLICATIONS APPROVED, NOT ACCEPTED
1
$107,900
5
$94,326
7
$120,947
1
$21,340
1
$52,120
APPLICATIONS DENIED
1
$167,440
6
$98,670
26
$92,581
4
$23,318
2
$50,190
APPLICATIONS WITHDRAWN
2
$102,770
2
$139,295
9
$108,384
1
$34,540
0
$0
FILES CLOSED FOR INCOMPLETENESS
0
$0
1
$60,660
4
$101,525
0
$0
0
$0
Aggregated Statistics For Year 2000 (Based on 1 partial tract)
A) FHA, FSA/RHS & VA Home Purchase Loans
B) Conventional Home Purchase Loans
C) Refinancings
D) Home Improvement Loans
F) Non-occupant Loans on < 5 Family Dwellings (A B C & D)
Number
Average Value
Number
Average Value
Number
Average Value
Number
Average Value
Number
Average Value
LOANS ORIGINATED
10
$131,704
24
$112,226
15
$110,087
5
$21,844
1
$112,670
APPLICATIONS APPROVED, NOT ACCEPTED
1
$116,640
3
$94,250
4
$92,990
2
$21,590
0
$0
APPLICATIONS DENIED
1
$175,770
9
$95,967
22
$83,007
6
$19,185
2
$51,615
APPLICATIONS WITHDRAWN
2
$100,330
4
$91,972
6
$80,620
1
$66,040
0
$0
FILES CLOSED FOR INCOMPLETENESS
0
$0
1
$118,770
4
$91,185
0
$0
0
$0
Aggregated Statistics For Year 1999 (Based on 2 partial tracts)
A) FHA, FSA/RHS & VA Home Purchase Loans
B) Conventional Home Purchase Loans
C) Refinancings
D) Home Improvement Loans
F) Non-occupant Loans on < 5 Family Dwellings (A B C & D)
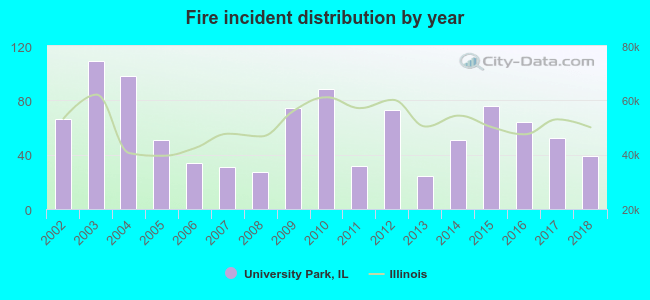
2002 - 2018 National Fire Incident Reporting System (NFIRS) incidents
Based on the data from the years 2002 - 2018 the average number of fire incidents per year is 58. The highest number of reported fire incidents - 109 took place in 2003, and the least - 24 in 2013. The data has a dropping trend.
When looking into fire subcategories, the most incidents belonged to: Structure Fires (66.8%), and Other (13.2%).
Fire incident types reported to NFIRS in University Park, IL
#4 on the list of "Top 101 cities with the largest city-data.com crime index decrease from 2002 to 2012 (population 5,000+)"
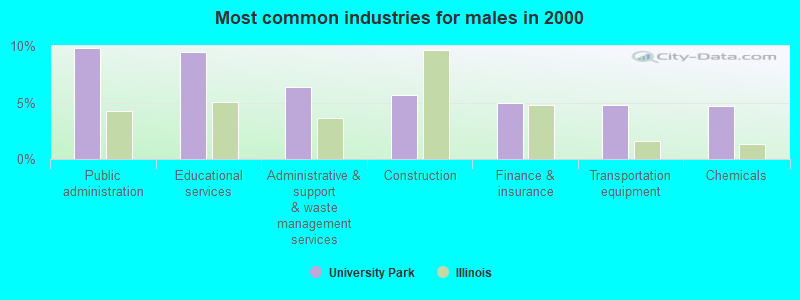
#8 on the list of "Top 101 cities with largest percentage of males in industries: transportation and warehousing (population 5,000+)"
#22 on the list of "Top 101 cities with the most full-time financial administration workers per 1000 residents (population 5,000+)"
#36 on the list of "Top 101 cities with the lowest number of thefts per 100,000 residents (population 5,000+)"
#44 on the list of "Top 101 cities with the smallest city-data.com crime index per police officer (population 5,000+)"
#59 on the list of "Top 101 cities with the most full-time park and recreation workers per 1000 residents (population 5,000+)"
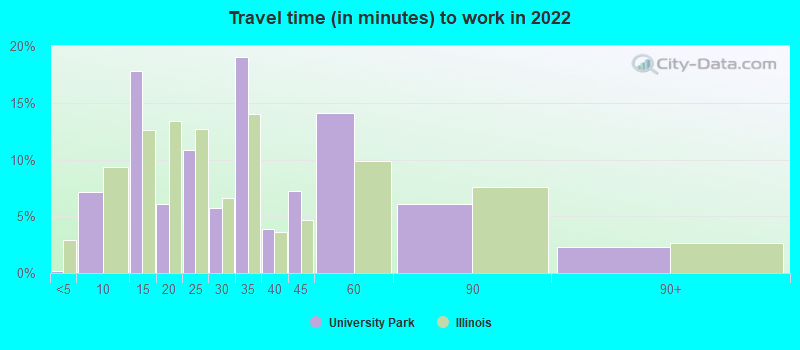
#65 on the list of "Top 100 cities with longest commuting times (pop. 5,000+)"
#66 on the list of "Top 100 safest cities (lowest city-data.com crime index) (pop. 5,000+)"
#85 on the list of "Top 101 cities with the lowest number of burglaries per 100,000 residents (population 5,000+)"
#7 on the list of "Top 101 counties with the lowest percentage of residents relocating from foreign countries between 2010 and 2011"
#10 on the list of "Top 101 counties with the highest percentage of residents that drank alcohol in the past 30 days"
#18 on the list of "Top 101 counties with the largest increase in the number of infant deaths per 1000 residents 2000-2006 to 2007-2013 (pop. 50,000+)"
#19 on the list of "Top 101 counties with the largest decrease in the number of births per 1000 residents 2000-2006 to 2007-2013 (pop 50,000+)"
#48 on the list of "Top 101 counties with the lowest surface withdrawal of fresh water for public supply (pop. 50,000+)"


 Recent articles from our blog. Our writers, many of them Ph.D. graduates or candidates, create easy-to-read articles on a wide variety of topics.

 (14.4 miles
 Based on the data from the years 2002 - 2018 the average number of fire incidents per year is 58. The highest number of reported fire incidents - 109 took place in 2003, and the least - 24 in 2013. The data has a dropping trend.
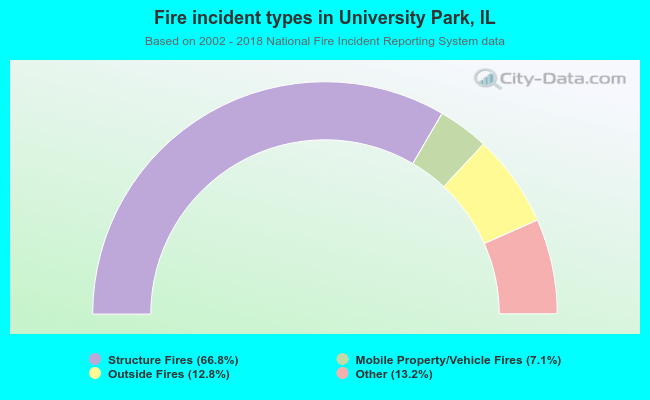 When looking into fire subcategories, the most incidents belonged to: Structure Fires (66.8%), and Other (13.2%).