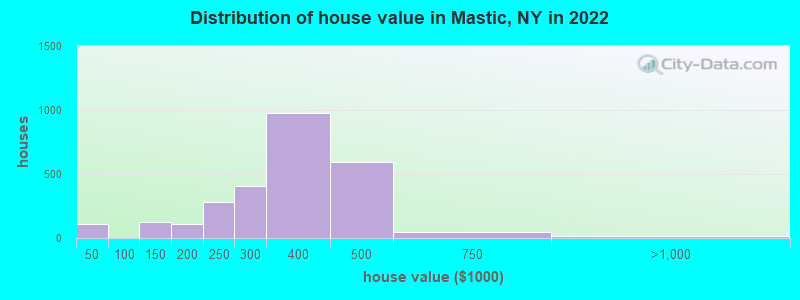
Estimated median house or condo value in 2022: $355,572 (it was $110,200 in 2000)
Mastic:
$355,572
NY:
$400,400
Mean prices in 2022:all housing units: $648,309; detached houses: $664,885; townhouses or other attached units: $541,828; in 2-unit structures: $735,387; in 3-to-4-unit structures: $523,799; in 5-or-more-unit structures: $413,065; mobile homes: $230,025
Median gross rent in 2022: $1,879.
March 2022 cost of living index in Mastic: 148.4 (very high, U.S. average is 100)
Percentage of residents living in poverty in 2022: 11.8%
(11.0% for White Non-Hispanic residents, 40.7% for Black residents, 6.5% for Hispanic or Latino residents, 77.0% for American Indian residents, 2.0% for other race residents, 3.2% for two or more races residents)
Latest news from Mastic, NY collected exclusively by city-data.com from local newspapers, TV, and radio stations
Ancestries: Italian (27.5%), Polish (8.2%), Irish (6.8%), German (5.1%), English (2.2%), Albanian (2.2%).
Current Local Time: EST time zone
Elevation: 32 feet
Land area: 4.48 square miles.
Population density: 3,455 people per square mile (average).
1,570 residents are foreign born (6.4% Latin America, 2.9% Europe).
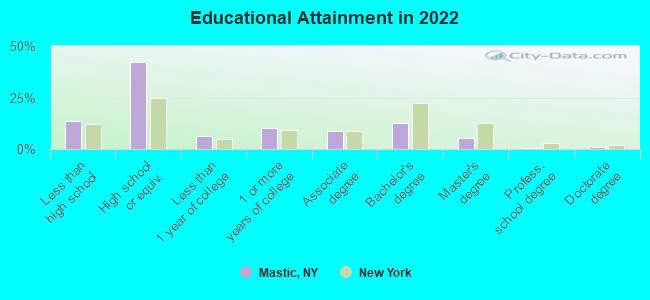
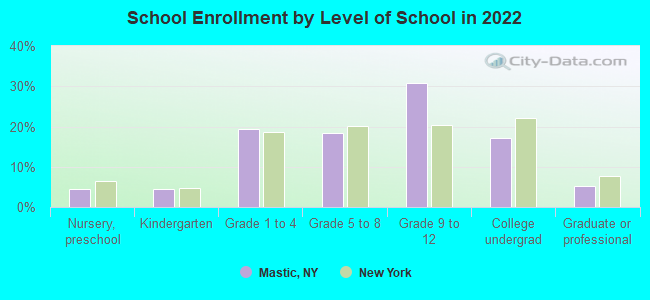
This place:
10.5%
New York:
22.6%
Median real estate property taxes paid for housing units with mortgages in 2022: $8,361 (2.4%) Median real estate property taxes paid for housing units with no mortgage in 2022: $8,643 (2.4%)
Nearest city with pop. 50,000+: Brentwood, NY (21.0 miles , pop. 53,917).
Nearest city with pop. 200,000+: North Hempstead, NY (43.1 miles , pop. 222,611).
Nearest city with pop. 1,000,000+: Queens, NY (51.5 miles , pop. 2,229,379).
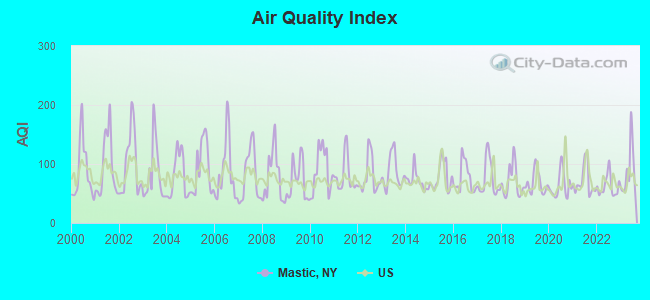
Air Quality Index (AQI) level in 2023 was 87.8. This is worse than average.
City:
87.8
U.S.:
72.6
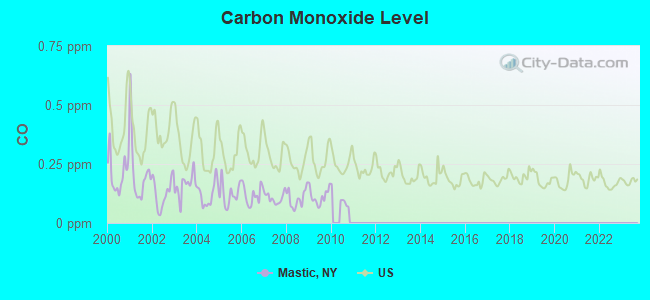
Carbon Monoxide (CO) [ppm] level in 2009 was 0.112. This is significantly better than average.Closest monitor was 11.3 miles away from the city center.
City:
0.112
U.S.:
0.251
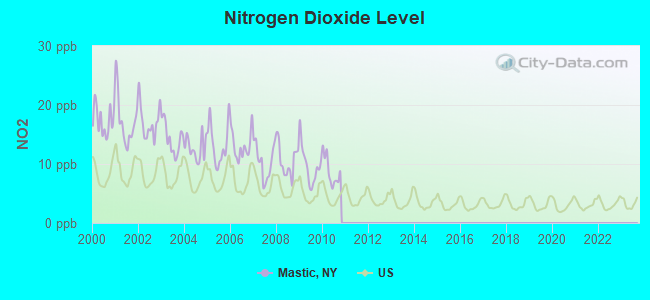
Nitrogen Dioxide (NO2) [ppb] level in 2010 was 8.78. This is significantly worse than average.Closest monitor was 11.3 miles away from the city center.
City:
8.78
U.S.:
5.11
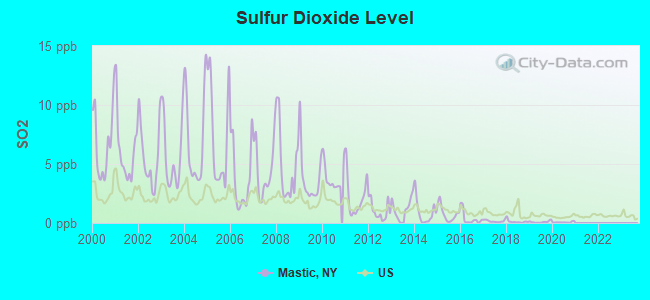
Sulfur Dioxide (SO2) [ppb] level in 2020 was 0.0629. This is significantly better than average.Closest monitor was 11.3 miles away from the city center.
City:
0.0629
U.S.:
1.5147
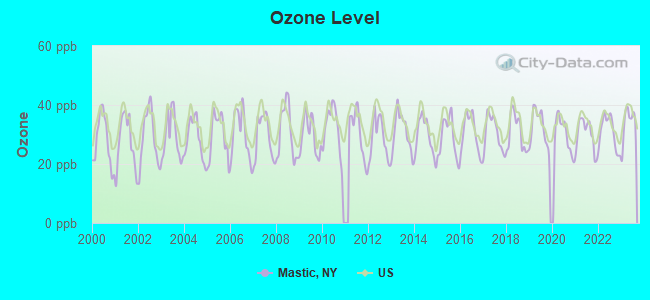
Ozone [ppb] level in 2023 was 34.0. This is about average.Closest monitor was 11.3 miles away from the city center.
City:
34.0
U.S.:
33.3
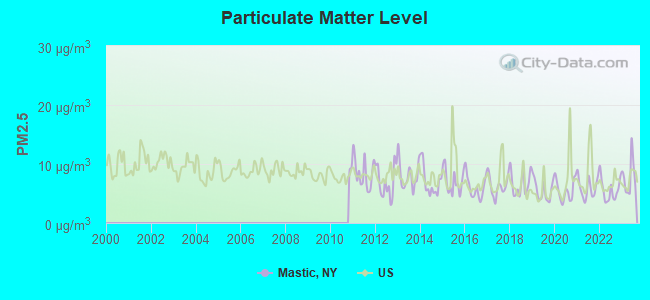
Particulate Matter (PM2.5) [µg/m3] level in 2023 was 7.79. This is about average.There were 0 monitors within city limits.
City:
7.79
U.S.:
8.11
Tornado activity:
Mastic-area historical tornado activity is near New York state average. It is 66% smaller than the overall U.S. average.
On 7/10/1989, a category F4 (max. wind speeds 207-260 mph) tornado 36.0 miles away from the Mastic place center injured 40 peopleand causedbetween $50,000,000 and $500,000,000 in damages.
On 7/10/1989, a category F2 (max. wind speeds 113-157 mph) tornado 3.6 miles away from the place center injured one person.
Earthquake activity:
Mastic-area historical earthquake activity is significantly above New York state average. It is 72% smaller than the overall U.S. average.
On 10/7/1983 at 10:18:46, a magnitude 5.3 (5.1 MB, 5.3 LG, 5.1 ML, Class: Moderate, Intensity: VI - VII) earthquake occurred 231.0 miles away from Mastic center On 8/23/2011 at 17:51:04, a magnitude 5.8 (5.8 MW, Depth: 3.7 mi) earthquake occurred 337.8 miles away from the city center On 4/20/2002 at 10:50:47, a magnitude 5.3 (5.3 ML, Depth: 3.0 mi) earthquake occurred 260.3 miles away from Mastic center On 8/22/1992 at 12:20:32, a magnitude 4.8 (4.8 MB, 3.8 MS, 4.7 LG, Depth: 6.2 mi, Class: Light, Intensity: IV - V) earthquake occurred 178.0 miles away from Mastic center On 4/20/2002 at 10:50:47, a magnitude 5.2 (5.2 MB, 4.2 MS, 5.2 MW, 5.0 MW) earthquake occurred 258.7 miles away from the city center On 1/16/1994 at 01:49:16, a magnitude 4.6 (4.6 MB, 4.6 LG, Depth: 3.1 mi) earthquake occurred 170.9 miles away from the city center Magnitude types: regional Lg-wave magnitude (LG), body-wave magnitude (MB), local magnitude (ML), surface-wave magnitude (MS), moment magnitude (MW)
Natural disasters:
The number of natural disasters in Suffolk County (28) is a lot greater than the US average (15). Major Disasters (Presidential) Declared: 19 Emergencies Declared: 7
Causes of natural disasters: Hurricanes: 9, Floods: 7, Storms: 7, Snowstorms: 4, Winter Storms: 3, Blizzards: 2, Heavy Rain: 1, Power Outage: 1, Tropical Depression: 1, Tropical Storm: 1, Water Shortage: 1, Other: 3 (Note: some incidents may be assigned to more than one category).
Hospitals and medical centers in Mastic:
FREE, INC (133 ELEANOR AVE)
FREE, INC (88 ABBOTT RD)
Other hospitals and medical centers near Mastic:
FREE, INC (Hospital, about 2 miles away; MASTIC BEACH, NY)
INDEPENDENT GROUP HOME LIVING PROGRAM, INC (Hospital, about 3 miles away; MANORVILLE, NY)
FREE, INC (Hospital, about 4 miles away; SHIRLEY, NY)
INDEPENDENT GROUP HOME LIVING PROGRAM, INC (Hospital, about 4 miles away; CENTER MORICHES, NY)
JOHN J FOLEY SKILLED NURSING FACILITY (Nursing Home, about 4 miles away; YAPHANK, NY)
CEDAR LODGE NURSING HOME (Nursing Home, about 5 miles away; CENTER MORICHES, NY)
INDEPENDENT GROUP HOME LIVING PROGRAM, INC (Hospital, about 5 miles away; E MORICHES, NY)
Colleges/universities with over 2000 students nearest to Mastic:
Suffolk County Community College (about 12 miles; Selden, NY; Full-time enrollment: 18,540)
Stony Brook University (about 17 miles; Stony Brook, NY; FT enrollment: 22,071)
Dowling College (about 18 miles; Oakdale, NY; FT enrollment: 2,598)
Porter and Chester Institute of Stratford (about 31 miles; Stratford, CT; FT enrollment: 2,822)
Farmingdale State College (about 31 miles; Farmingdale, NY; FT enrollment: 6,956)
University of Bridgeport (about 31 miles; Bridgeport, CT; FT enrollment: 3,708)
Housatonic Community College (about 32 miles; Bridgeport, CT; FT enrollment: 3,677)
Birthplace of: John Smith (New York) - Politician.
Suffolk County has a predicted average indoor radon screening level less than 2 pCi/L (pico curies per liter) - Low Potential
Average household size:
This place:
3.4 people
New York:
2.6 people
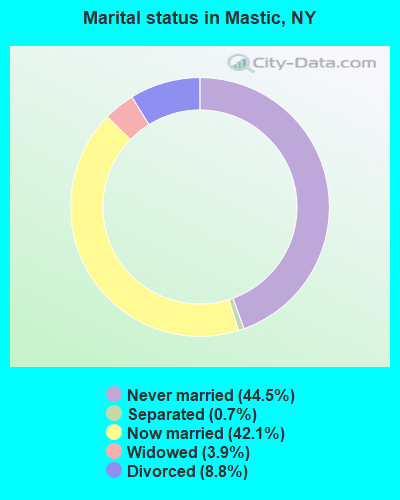
Percentage of family households:
This place:
82.7%
Whole state:
63.5%
Percentage of households with unmarried partners:
This place:
8.2%
Whole state:
6.8%
Likely homosexual households (counted as self-reported same-sex unmarried-partner households)
Lesbian couples: 0.4% of all households
Gay men: 0.3% of all households
20 people in emergency and transitional shelters (with sleeping facilities) for people experiencing homelessness in 2010
13 people in group homes intended for adults in 2010
People in group quarters in Mastic in 2000:
52 people in homes or halfway houses for drug/alcohol abuse
10 people in homes for the mentally retarded
7 people in other group homes
Banks with branches in Mastic (2011 data):
Capital One, National Association: Mastic Branch at 1235 Montauk Highway, branch established on 2011/06/30. Info updated 2011/07/01: Bank assets: $133,477.8 mil, Deposits: $97,063.7 mil, headquarters in Mclean, VA, positive income, 984 total offices, Holding Company: Capital One Financial Corporation
HSBC Bank USA, National Association: Mastic Branch at 1718 Montauk Highway, branch established on 1972/06/08. Info updated 2010/11/30: Bank assets: $206,009.7 mil, Deposits: $149,026.8 mil, headquarters in Mc Lean, VA, positive income, 474 total offices, Holding Company: Hsbc Holdings Plc
Religion statistics for Mastic, NY (based on Suffolk County data)
Religion
Adherents
Congregations
Catholic
879,457
75
Mainline Protestant
69,205
182
Evangelical Protestant
58,909
264
Other
50,771
124
Orthodox
10,190
10
Black Protestant
8,298
49
None
416,520
-
Source: Clifford Grammich, Kirk Hadaway, Richard Houseal, Dale E.Jones, Alexei Krindatch, Richie Stanley and Richard H.Taylor. 2012. 2010 U.S.Religion Census: Religious Congregations & Membership Study. Association of Statisticians of American Religious Bodies. Jones, Dale E., et al. 2002. Congregations and Membership in the United States 2000. Nashville, TN: Glenmary Research Center. Graphs represent county-level data
Aircraft: CESSNA 172M (Category: Land, Seats: 4, Weight: Up to 12,499 Pounds, Speed: 108 mph), Engine: LYCOMING 0-320 SERIES (180 HP) (4 Cycle) N-Number: 20593, N20593, N-20593, Serial Number: 17261425, Year manufactured: 1973, Airworthiness Date: 02/16/1973, Certificate Issue Date: 01/21/1993 Registrant (Individual): Marcelo F Nieto, 198 Monroe St, Mastic, NY 11950
Aircraft: AIRCRAFT MFG & DEVELOPMENT CO CH 601XL SLSA (Category: Land, Seats: 2, Weight: Up to 12,499 Pounds), Engine: CONT MOTOR 0-200-A (100 HP) (Reciprocating) N-Number: 684JM, N684JM, N-684JM, Serial Number: 601-004S, Year manufactured: 2006, Airworthiness Date: 04/01/2006, Certificate Issue Date: 08/23/2017 Registrant (Individual): Thomas A Cashion, 29 Overlook Dr, Mastic, NY 11950
Aircraft: TAULMAN JOHN M ZENAIR CH 601XL (Category: Land, Seats: 2, Weight: Up to 12,499 Pounds), Engine: ROTAX SEE BOMBADIER (Reciprocating) N-Number: 963MJ, N963MJ, N-963MJ, Serial Number: 6-9476, Year manufactured: 2004, Airworthiness Date: 06/28/2004, Certificate Issue Date: 10/05/2015 Registrant (Individual): Charles D Clayton, 152 N Titmus Dr, Mastic, NY 11950
Aircraft: PIPER J3C-65S (Category: Land, Seats: 2, Weight: Up to 12,499 Pounds, Speed: 67 mph), Engine: CONT MOTOR A&C65 SERIES (65 HP) (Reciprocating) N-Number: 70898, N70898, N-70898, Serial Number: 18052, Year manufactured: 1946 Registrant (Corporation): Brookhaven Air Svc Inc, Park Ave, Mastic, NY 11950 Deregistered:Cancel Date: 08/07/2020
Aircraft: AERONCA 11AC (Category: Land, Seats: 2, Weight: Up to 12,499 Pounds, Speed: 75 mph), Engine: CONT MOTOR A&C65 SERIES (65 HP) (Reciprocating) N-Number: 9529E, N9529E, N-9529E, Serial Number: 11AC1165, Year manufactured: 1946 Registrant (Individual): Herbert R Anderson, Park Ave, Mastic, NY 11950 Deregistered:Cancel Date: 11/21/2017
Home Mortgage Disclosure Act Aggregated Statistics For Year 2009 (Based on 1 full and 2 partial tracts)
A) FHA, FSA/RHS & VA Home Purchase Loans
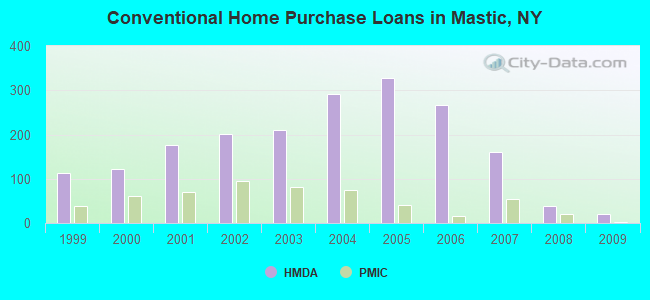
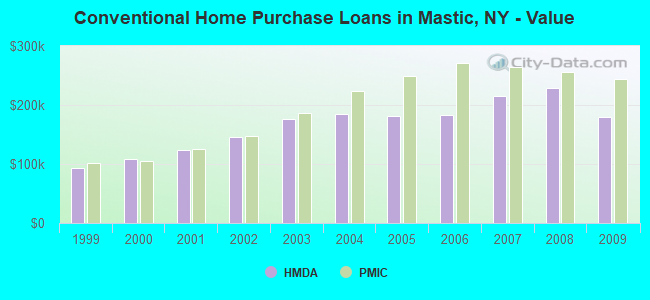
B) Conventional Home Purchase Loans
C) Refinancings
D) Home Improvement Loans
F) Non-occupant Loans on < 5 Family Dwellings (A B C & D)
G) Loans On Manufactured Home Dwelling (A B C & D)
Number
Average Value
Number
Average Value
Number
Average Value
Number
Average Value
Number
Average Value
Number
Average Value
LOANS ORIGINATED
50
$211,350
21
$180,496
96
$196,381
10
$78,023
8
$128,660
3
$79,000
APPLICATIONS APPROVED, NOT ACCEPTED
2
$215,825
4
$166,855
11
$234,113
4
$42,995
0
$0
0
$0
APPLICATIONS DENIED
16
$157,184
14
$151,601
87
$226,140
12
$44,188
6
$140,415
1
$72,350
APPLICATIONS WITHDRAWN
13
$193,047
5
$140,630
51
$224,747
2
$145,220
3
$191,720
0
$0
FILES CLOSED FOR INCOMPLETENESS
0
$0
7
$93,986
8
$232,779
1
$93,870
0
$0
3
$75,667
Aggregated Statistics For Year 2008 (Based on 1 full and 2 partial tracts)
A) FHA, FSA/RHS & VA Home Purchase Loans
B) Conventional Home Purchase Loans
C) Refinancings
D) Home Improvement Loans
F) Non-occupant Loans on < 5 Family Dwellings (A B C & D)
G) Loans On Manufactured Home Dwelling (A B C & D)
Number
Average Value
Number
Average Value
Number
Average Value
Number
Average Value
Number
Average Value
Number
Average Value
LOANS ORIGINATED
22
$246,341
38
$228,884
100
$194,529
20
$117,940
10
$166,145
0
$0
APPLICATIONS APPROVED, NOT ACCEPTED
2
$215,215
11
$189,898
16
$226,261
9
$72,136
3
$102,967
0
$0
APPLICATIONS DENIED
7
$245,686
27
$224,615
139
$234,687
50
$52,463
11
$196,504
3
$80,333
APPLICATIONS WITHDRAWN
10
$271,489
11
$181,706
50
$225,916
4
$74,150
3
$117,657
0
$0
FILES CLOSED FOR INCOMPLETENESS
0
$0
4
$274,210
11
$220,246
2
$72,865
2
$230,255
0
$0
Aggregated Statistics For Year 2007 (Based on 1 full and 2 partial tracts)
A) FHA, FSA/RHS & VA Home Purchase Loans
B) Conventional Home Purchase Loans
C) Refinancings
D) Home Improvement Loans
F) Non-occupant Loans on < 5 Family Dwellings (A B C & D)
G) Loans On Manufactured Home Dwelling (A B C & D)
Number
Average Value
Number
Average Value
Number
Average Value
Number
Average Value
Number
Average Value
Number
Average Value
LOANS ORIGINATED
15
$264,159
161
$215,848
257
$196,681
66
$87,585
33
$199,216
4
$67,000
APPLICATIONS APPROVED, NOT ACCEPTED
0
$0
25
$173,912
75
$228,991
21
$83,806
6
$209,955
2
$108,835
APPLICATIONS DENIED
3
$253,347
80
$215,603
353
$238,075
64
$81,812
30
$194,214
5
$74,518
APPLICATIONS WITHDRAWN
9
$268,146
25
$197,869
117
$218,616
14
$145,964
11
$174,039
1
$85,080
FILES CLOSED FOR INCOMPLETENESS
0
$0
12
$253,316
32
$228,009
1
$120,580
2
$234,915
0
$0
Aggregated Statistics For Year 2006 (Based on 1 full and 2 partial tracts)
A) FHA, FSA/RHS & VA Home Purchase Loans
B) Conventional Home Purchase Loans
C) Refinancings
D) Home Improvement Loans
F) Non-occupant Loans on < 5 Family Dwellings (A B C & D)
G) Loans On Manufactured Home Dwelling (A B C & D)
Number
Average Value
Number
Average Value
Number
Average Value
Number
Average Value
Number
Average Value
Number
Average Value
LOANS ORIGINATED
12
$290,804
267
$182,453
462
$197,174
78
$97,453
49
$197,993
0
$0
APPLICATIONS APPROVED, NOT ACCEPTED
1
$503,390
38
$177,197
95
$205,978
22
$115,694
7
$181,347
1
$83,000
APPLICATIONS DENIED
2
$299,770
143
$185,075
320
$214,456
82
$99,815
34
$181,895
2
$71,385
APPLICATIONS WITHDRAWN
3
$224,333
56
$195,618
245
$210,779
16
$175,870
13
$176,353
0
$0
FILES CLOSED FOR INCOMPLETENESS
0
$0
11
$203,492
62
$245,574
2
$133,430
3
$193,557
0
$0
Aggregated Statistics For Year 2005 (Based on 1 full and 2 partial tracts)
A) FHA, FSA/RHS & VA Home Purchase Loans
B) Conventional Home Purchase Loans
C) Refinancings
D) Home Improvement Loans
F) Non-occupant Loans on < 5 Family Dwellings (A B C & D)
Number
Average Value
Number
Average Value
Number
Average Value
Number
Average Value
Number
Average Value
LOANS ORIGINATED
14
$257,434
327
$182,060
515
$195,677
94
$104,374
46
$177,182
APPLICATIONS APPROVED, NOT ACCEPTED
1
$317,000
59
$197,148
92
$198,293
14
$80,934
8
$147,942
APPLICATIONS DENIED
1
$291,000
109
$207,490
272
$194,709
63
$82,308
19
$165,258
APPLICATIONS WITHDRAWN
0
$0
82
$183,878
227
$189,450
37
$171,063
16
$187,004
FILES CLOSED FOR INCOMPLETENESS
0
$0
23
$158,926
144
$216,780
3
$145,590
7
$200,334
Aggregated Statistics For Year 2004 (Based on 1 full and 2 partial tracts)
A) FHA, FSA/RHS & VA Home Purchase Loans
B) Conventional Home Purchase Loans
C) Refinancings
D) Home Improvement Loans
E) Loans on Dwellings For 5+ Families
F) Non-occupant Loans on < 5 Family Dwellings (A B C & D)
G) Loans On Manufactured Home Dwelling (A B C & D)
Number
Average Value
Number
Average Value
Number
Average Value
Number
Average Value
Number
Average Value
Number
Average Value
Number
Average Value
LOANS ORIGINATED
24
$232,392
291
$184,713
538
$167,117
123
$96,414
0
$0
85
$166,267
3
$32,033
APPLICATIONS APPROVED, NOT ACCEPTED
3
$215,587
42
$197,035
119
$178,881
31
$103,541
0
$0
15
$142,532
0
$0
APPLICATIONS DENIED
9
$220,257
77
$202,515
271
$175,342
93
$73,910
0
$0
24
$174,607
5
$85,124
APPLICATIONS WITHDRAWN
9
$247,583
43
$195,433
283
$169,741
25
$87,498
1
$166,000
14
$163,293
0
$0
FILES CLOSED FOR INCOMPLETENESS
2
$230,050
16
$187,033
112
$177,752
4
$41,060
0
$0
8
$141,556
0
$0
Aggregated Statistics For Year 2003 (Based on 1 full and 2 partial tracts)
A) FHA, FSA/RHS & VA Home Purchase Loans
B) Conventional Home Purchase Loans
C) Refinancings
D) Home Improvement Loans
F) Non-occupant Loans on < 5 Family Dwellings (A B C & D)
Number
Average Value
Number
Average Value
Number
Average Value
Number
Average Value
Number
Average Value
LOANS ORIGINATED
61
$192,260
211
$175,893
820
$142,040
59
$34,991
51
$135,836
APPLICATIONS APPROVED, NOT ACCEPTED
3
$194,447
36
$161,812
177
$132,650
29
$44,188
13
$140,872
APPLICATIONS DENIED
6
$189,163
50
$174,005
346
$141,062
84
$35,143
24
$139,672
APPLICATIONS WITHDRAWN
13
$174,321
28
$158,096
294
$145,606
27
$37,007
8
$151,318
FILES CLOSED FOR INCOMPLETENESS
1
$191,960
6
$157,213
52
$151,866
5
$46,614
4
$189,100
Aggregated Statistics For Year 2002 (Based on 1 full and 2 partial tracts)
A) FHA, FSA/RHS & VA Home Purchase Loans
B) Conventional Home Purchase Loans
C) Refinancings
D) Home Improvement Loans
F) Non-occupant Loans on < 5 Family Dwellings (A B C & D)
Number
Average Value
Number
Average Value
Number
Average Value
Number
Average Value
Number
Average Value
LOANS ORIGINATED
64
$146,416
201
$145,217
520
$134,424
76
$28,491
42
$102,679
APPLICATIONS APPROVED, NOT ACCEPTED
6
$168,495
23
$189,543
112
$119,485
27
$29,983
9
$206,078
APPLICATIONS DENIED
14
$143,434
47
$150,528
297
$109,490
83
$20,817
12
$143,427
APPLICATIONS WITHDRAWN
21
$160,396
26
$152,713
245
$119,040
57
$39,853
8
$113,224
FILES CLOSED FOR INCOMPLETENESS
2
$145,325
15
$144,513
70
$125,989
0
$0
6
$124,870
Aggregated Statistics For Year 2001 (Based on 1 full and 2 partial tracts)
A) FHA, FSA/RHS & VA Home Purchase Loans
B) Conventional Home Purchase Loans
C) Refinancings
D) Home Improvement Loans
E) Loans on Dwellings For 5+ Families
F) Non-occupant Loans on < 5 Family Dwellings (A B C & D)
Number
Average Value
Number
Average Value
Number
Average Value
Number
Average Value
Number
Average Value
Number
Average Value
LOANS ORIGINATED
101
$131,677
176
$123,528
322
$121,118
58
$33,672
1
$211,840
35
$92,806
APPLICATIONS APPROVED, NOT ACCEPTED
4
$126,508
22
$123,856
77
$88,552
22
$40,597
0
$0
2
$71,135
APPLICATIONS DENIED
14
$116,902
46
$122,608
302
$93,067
83
$25,420
0
$0
16
$90,928
APPLICATIONS WITHDRAWN
14
$120,460
29
$124,057
188
$99,257
35
$35,351
0
$0
6
$86,828
FILES CLOSED FOR INCOMPLETENESS
3
$148,387
10
$122,398
31
$100,202
2
$78,600
0
$0
0
$0
Aggregated Statistics For Year 2000 (Based on 1 full and 2 partial tracts)
A) FHA, FSA/RHS & VA Home Purchase Loans
B) Conventional Home Purchase Loans
C) Refinancings
D) Home Improvement Loans
E) Loans on Dwellings For 5+ Families
F) Non-occupant Loans on < 5 Family Dwellings (A B C & D)
Number
Average Value
Number
Average Value
Number
Average Value
Number
Average Value
Number
Average Value
Number
Average Value
LOANS ORIGINATED
94
$110,652
123
$107,962
110
$76,153
55
$21,574
1
$1,900,000
17
$75,202
APPLICATIONS APPROVED, NOT ACCEPTED
6
$88,485
21
$116,820
39
$87,028
17
$24,463
0
$0
3
$60,033
APPLICATIONS DENIED
6
$112,963
50
$108,428
205
$74,201
79
$25,824
0
$0
8
$49,460
APPLICATIONS WITHDRAWN
23
$108,558
20
$101,544
166
$72,136
9
$46,451
0
$0
6
$65,750
FILES CLOSED FOR INCOMPLETENESS
3
$101,937
7
$97,180
24
$95,186
1
$27,450
0
$0
2
$71,585
Aggregated Statistics For Year 1999 (Based on 1 full and 2 partial tracts)
A) FHA, FSA/RHS & VA Home Purchase Loans
B) Conventional Home Purchase Loans
C) Refinancings
D) Home Improvement Loans
E) Loans on Dwellings For 5+ Families
F) Non-occupant Loans on < 5 Family Dwellings (A B C & D)
2002 - 2018 National Fire Incident Reporting System (NFIRS) incidents
Based on the data from the years 2002 - 2018 the average number of fire incidents per year is 7. The highest number of fires - 26 took place in 2018, and the least - 0 in 2003. The data has an increasing trend.
When looking into fire subcategories, the most reports belonged to: Structure Fires (60.6%), and Outside Fires (34.6%).
Fire incident types reported to NFIRS in Mastic, NY
#37 on the list of "Top 101 cities with the most residents born in Belarus (population 500+)"
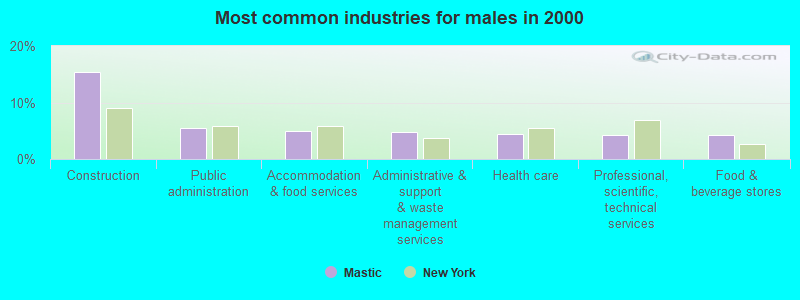
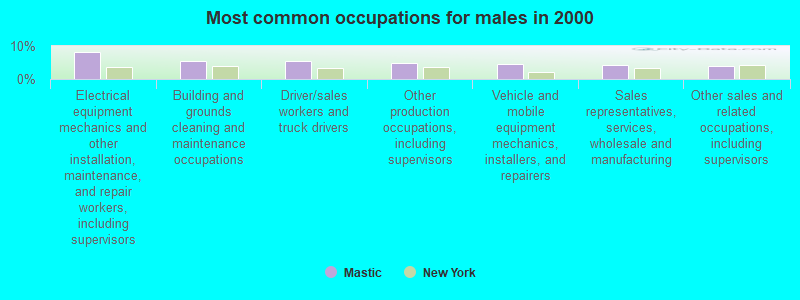
#41 on the list of "Top 101 cities with largest percentage of males in occupations: building and grounds cleaning and maintenance occupations (population 5,000+)"
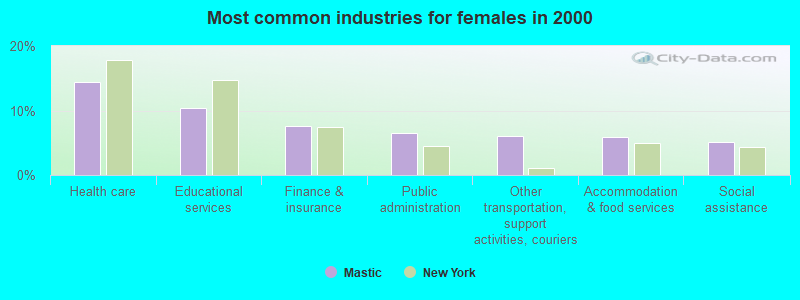
#64 on the list of "Top 101 cities with largest percentage of females in occupations: transportation occupations (population 5,000+)"
#73 on the list of "Top 101 cities with the most people living the same house as 1 year ago (population 5,000+))"
#3 on the list of "Top 101 counties with the most Catholic adherents"
#6 on the list of "Top 101 counties with the lowest percentage of residents relocating from other counties between 2010 and 2011"
#7 on the list of "Top 101 counties with the lowest surface withdrawal of fresh water for public supply (pop. 50,000+)"
#9 on the list of "Top 101 counties with the lowest percentage of residents relocating to other counties in 2011"
#19 on the list of "Top 101 counties with the highest ground withdrawal of fresh water for public supply (pop. 50,000+)"


 Recent articles from our blog. Our writers, many of them Ph.D. graduates or candidates, create easy-to-read articles on a wide variety of topics.

 (21.0 miles


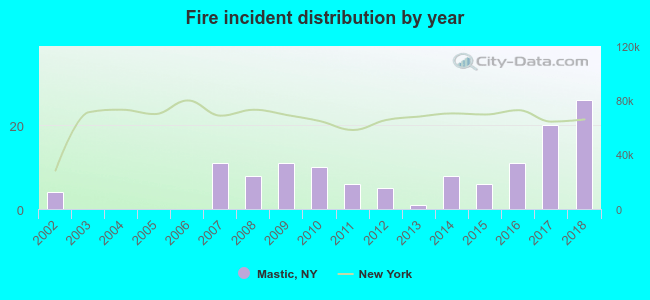 Based on the data from the years 2002 - 2018 the average number of fire incidents per year is 7. The highest number of fires - 26 took place in 2018, and the least - 0 in 2003. The data has an increasing trend.
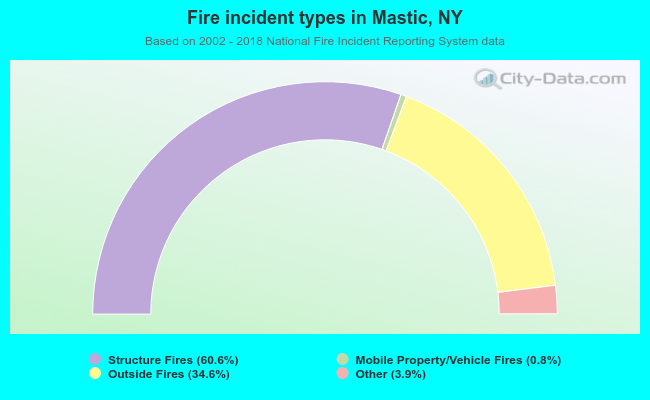 When looking into fire subcategories, the most reports belonged to: Structure Fires (60.6%), and Outside Fires (34.6%).