


Relative area comparison
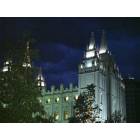
 Salt Lake City, UT
 Boston, MA
Salt Lake City, UT and
Boston, MA : 2,092.6 miles
Boston, MA
Salt Lake City, UT and
Boston, MA : 2,092.6 miles
Boston's population is larger by 227%. Its population has grown by 65,635 people (11.1%) since 2000. The population of Salt Lake City has grown by 18,735 people (10.3%) during that time.
| Population | ||
| Type | Salt Lake City | Boston |
|---|---|---|
| Population | 200,478 |
654,776 |
| Female / male percentage | 49.4% / 50.6%
|
51.8% / 48.2%
|
| Urban / rural population | 99.5% / 0.5%
|
100% / 0%
|
According to our data, there are 975 registered sex offenders living in Salt Lake City and 334 registered sex offenders living in .
The ratio of residents to sex offenders in Salt Lake City is 199 to 1; the ratio in Boston is 2,014 to 1.
The number of registered sex offenders compared to the number of residents is much larger in Salt Lake City than that in Boston.
| Income | ||
| Type | Salt Lake City | Boston |
|---|---|---|
| Estimated median household income | $66,658 |
$79,283 |
| Estimated per capita income | $44,033 |
$50,337 |
| Cost of living index (U.S. average is 100) | 94.9 |
143.8 |
If you make $50,000 in Salt Lake City, you will have to make $75,764 in Boston to maintain the same standard of living.
| Geographical information | ||
| Type | Salt Lake City | Boston |
|---|---|---|
| Land area | 109.1 sq. miles | 48.4 sq. miles |
| Population density | 1,837.9 people per sq. mile | 13,521 people per sq. mile |
| Elevation | 4,266 feet | 20 feet |
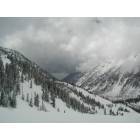
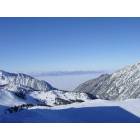
Salt Lake City, UT
Boston, MA
| Educational attainment | ||
| Type | Salt Lake City | Boston |
|---|---|---|
| Less than high school | 6.3% |
11.9% |
| High school or equiv. | 16.9% |
18.8% |
| Less than 1 year of college | 5.2% |
3.4% |
| 1 or more years of college | 14.3% |
8.2% |
| Associate degree | 6.4% |
5.3% |
| Bachelor's degree | 30.1% |
26.8% |
| Master's degree | 12.6% |
16.6% |
| Profess. school degree | 4.5% |
5.5% |
| Doctorate degree | 3.7% |
3.6% |
| Education level (25-year-olds and older) | ||
| Type | Salt Lake City | Boston |
|---|---|---|
| Bachelor's degree or higher | 50.9% |
52.5% |
| Graduate or professional degree | 20.8% |
25.7% |
| High school or higher | 93.7% |
88.1% |
There were 172 building permits issued in Salt Lake City in 2012 (144 more than in 2011) compared to 53 building permits issued in Boston in 2012 (20 more than in 2011).
In Salt Lake City (Salt Lake County), 38.1% voted for Democrats and 58.4% for Republicans in 2012 Presidential Election. In Boston (Suffolk County), 77.4% voted for Democrats and 20.8% for Republicans.
| Weather and climate | ||
| Type | Salt Lake City | Boston |
|---|---|---|
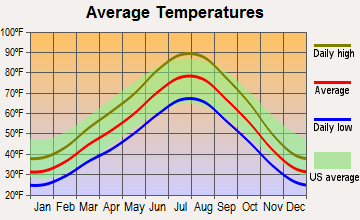
| Temperature - Average | 54.1°F | 50.6°F |
| Humidity - Average morning or afternoon humidity | 57.5% |
69.9% |
| Humidity - Differences between morning and afternoon humidity | 57% |
23.1% |
| Humidity - Maximum monthly morning or afternoon humidity | 78% |
78% |
| Humidity - Minimum monthly morning or afternoon humidity | 21% |
55% |
| Precipitation - Yearly average | 17.8 in | 46.3 in |
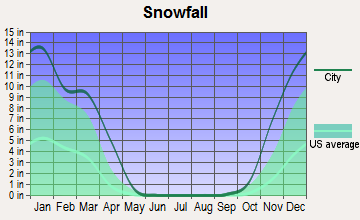
| Snowfall - Yearly average | 117.2 in | 88.3 in |
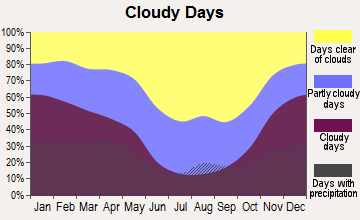
| Clouds - Number of days clear of clouds | 20.8% |
16.4% |
| Sunshine amount - Average | 72.4% |
63.7% |
| Sunshine amount - Differences during a year | 46% |
20% |
| Sunshine amount - Maximum monthly | 85% |
68% |
| Sunshine amount - Minimum monthly | 39% |
48% |
| Wind speed - Average | 9.1 mph | 12.5 mph |
| Natural disasters | ||
| Type | Salt Lake City | Boston |
|---|---|---|
| Tornado activity compared to U.S. average | 10% |
55.3% |
| Earthquake activity compared to U.S. average | 2,272.3% |
26.6% |
| Natural disasters compared to U.S. average | 9% |
33% |
| Transport | ||
| Type | Salt Lake City | Boston |
|---|---|---|
| Amtrak stations | 1 |
3 |
| Amtrak stations nearby | 1 |
3 |
| FAA registered aircraft | 0 |
224 |
| FAA registered aircraft manufacturers and dealers | 0 |
4 |
| Means of transportation to work | ||
| Type | Salt Lake City | Boston |
|---|---|---|
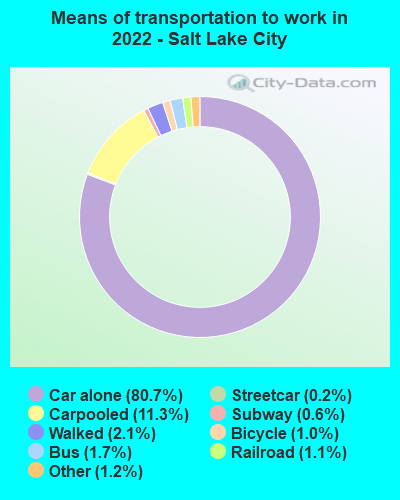
| Bicycle | 1.2% |
1.7% |
| Bus | 2.3% |
7.1% |
| Carpooled | 9.9% |
6.8% |
| Car alone | 81% |
54.7% |
| Ferryboat | 0.1% |
0.2% |
| Motorcycle | 0.2% |
0.1% |
| Railroad | 1.1% |
0.5% |
| Streetcar | 0.2% |
13.5% |
| Subway | 0.6% |
3.2% |
| Taxicab | 0.1% |
0.4% |
| Walked | 2.4% |
10% |
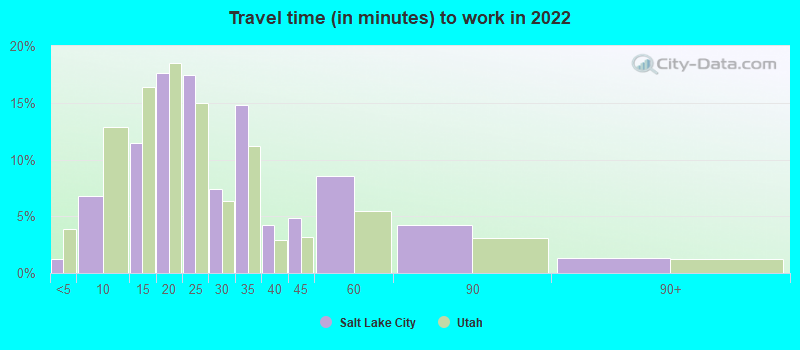
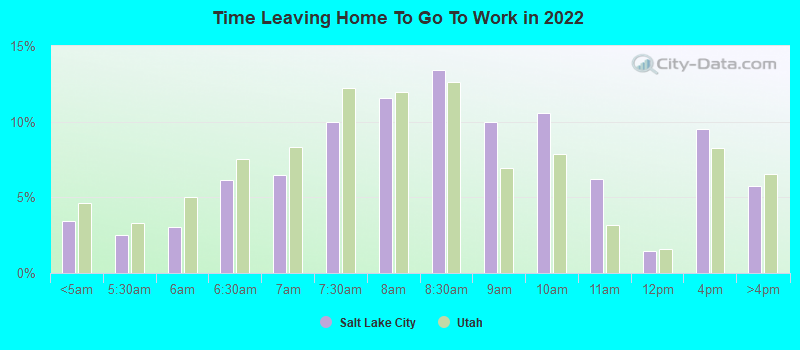
| Average travel time to work | ||
| Type | Salt Lake City | Boston |
|---|---|---|
| Average | 27.8 min | 38.6 min |
| Other means | 19.7 min | 26.1 min |
| Public transportation | 34.7 min | 38.6 min |
| Private vehicle occupancy | ||
| Type | Salt Lake City | Boston |
|---|---|---|
| Average | 1.2 |
1.2 |
| Drove alone | 90.2% |
87.1% |
| In 2 person carpool | 7.1% |
10.1% |
| In 3 person carpool | 1.8% |
1.7% |
| In 4 person carpool | 0.3% |
0.4% |
| In 5-6 person carpool | 0.2% |
0.2% |
| In 7+ person carpool | 0.3% |
0.5% |
How many people usually rode to work in the car, truck or van.
| Houses and residents | ||
| Type | Salt Lake City | Boston |
|---|---|---|
| Houses | 99,551 |
307,025 |
| Average household size (people) | 2.4 |
2.3 |
| Median year apartment built | 1974 |
1957 |
| Length of stay in the house since moving in | 13.4 years | 14.6 years |
| Houses occupied | 89,839 (90.2%) | 271,941 (88.6%) |
| Houses occupied by owners | 42,681 (47.5%) | 94,497 (34.7%) |
| Houses occupied by renters | 47,158 (52.5%) | 177,444 (65.3%) |
| Median rent asked for vacant for-rent units | $1,183 |
$2,632 |
| Median monthly housing costs | $1,212 |
$1,883 |
| Median price asked for vacant for-sale houses and condos | $1,040,755 |
$1,040,328 |
| Estimated median house or condo value | $459,800 |
$659,700 |
| Median numbers of rooms | 4.6 |
4.3 |
| Median number of rooms in apartments | 3.5 |
3.9 |
| Median number of rooms in houses and condos | 6.8 |
5.4 |
| Median house price - detached houses | $670,211 |
$683,896 |
| Median house price - in 2-unit structures | $557,731 |
$639,493 |
| Median house price - in 3-to-4-unit structures | $286,131 |
$745,440 |
| Median house price - in 5 or more unit structures | $392,695 |
$986,433 |
| Median house price - mobile homes | $16,446 |
$117,668 |
| Median house price - Townhouses or other attached units | $508,996 |
Over $1,000,000 |
| Median house price - All housing units | $618,525 |
$793,380 |
| Median house age | 60 |
73 |
| Renting percentage | 51.6% |
66.1% |
| Housing density (houses/condos per square mile) | 912.6 |
6,340.1 |
| House value disparities | 28.9% |
23.5% |
| Household income disparities | 45.4% |
48.2% |
| Median household income for houses/condes with a mortgage | $104,234 |
$138,364 |
| Median household income for apartments without a mortgage | $76,183 |
$97,179 |
| Housing units without a mortgage | 515 (1.8%) | 1,250 (1.8%) |
| Housing units with both a second mortgage and home equity loan | 2,740 (9.6%) | 7,686 (11.2%) |
| Housing units with a mortgage | 28,000 (98.2%) | 67,144 (98.2%) |
| Housing units with a home equity loan | 0 (0%) | 218 (0.3%) |
| Housing units with a second mortgage | 3,493 (12.2%) | 9,540 (13.9%) |
| House/condo owner moved in on average (years ago) | 10 |
12 |
| House/condo renter moved in on average (years ago) | 1 |
3 |
| Housing units lacking complete kitchen facilities | 1.8% |
1.4% |
| Housing units lacking complete plumbing facilities | 1.8% |
0.7% |
| Median real estate property taxes paid for housing units | ||
| Type | Salt Lake City | Boston |
|---|---|---|
| With mortgages | $2,318 (0.5%) | $4,093 (0.6%) |
| With no mortgages | $2,606 (0.5%) | $4,063 (0.6%) |
| Marital status | ||
| Type | Salt Lake City | Boston |
|---|---|---|
| Divorced | 10.7% |
6.7% |
| Never married | 49.1% |
55.3% |
| Now married | 35.2% |
32.3% |
| Separated | 1.7% |
2.4% |
| Widowed | 3.3% |
3.3% |
| Health (county statistics) | ||
| Type | Salt Lake City | Boston |
|---|---|---|
| General health status score of residents in this county from 1 (poor) to 5 (excellent) | 3.6 | 3.5 |
| Average weight of females (lbs) | 162.7 lbs | 159 lbs |
| Average weight of males (lbs) | 197.7 lbs | 187.4 lbs |
| Residents visited a dentist within the past year | 72.4% | 74.7% |
| Residents exercised in the past month | 78.6% | 74.4% |
| Adult residents drank alcohol in the past 30 days | 35.3% | 76.6% |
| Residents smoked 100+ cigarettes in their lives | 27.7% | 44.4% |
| People in group quarters | ||
| Type | Salt Lake City | Boston |
|---|---|---|
| Agriculture workers' dormitories on farms | 0 (0%) | 16 (0%) |
| College dormitories (includes college quarters off campus) | 1,677 (0.9%) | 20,275 (3.4%) |
| Crews of maritime vessels | 0 (0%) | 0 (0%) |
| Dormitories | 0 (0%) | 0 (0%) |
| Federal prisons and detention centers | 0 (0%) | 0 (0%) |
| Group homes | 0 (0%) | 0 (0%) |
| Halfway houses | 170 (0.1%) | 145 (0%) |
| Homes for abused, dependent, and neglected children | 0 (0%) | 32 (0%) |
| Homes for the mentally ill | 96 (0.1%) | 326 (0.1%) |
| Homes for the mentally retarded | 52 (0%) | 255 (0%) |
| Homes for the physically handicapped | 0 (0%) | 30 (0%) |
| Homes or halfway houses for drug/alcohol abuse | 376 (0.2%) | 890 (0.2%) |
| Hospices or homes for chronically ill | 0 (0%) | 705 (0.1%) |
| Hospitals or wards for drug/alcohol abuse | 61 (0%) | 17 (0%) |
| Hospitals/wards and hospices for chronically ill | 2 (0%) | 929 (0.2%) |
| Hospitals/wards, hospices, and schools for the handicapped | 0 (0%) | 0 (0%) |
| Institutions for the blind | 0 (0%) | 0 (0%) |
| Institutions for the deaf | 0 (0%) | 0 (0%) |
| Job corps and vocational training facilities | 2 (0%) | 0 (0%) |
| Juvenile institutions | 0 (0%) | 0 (0%) |
| Local jails and other confinement facilities (including police lockups) | 0 (0%) | 2,171 (0.4%) |
| Long-term care | 0 (0%) | 0 (0%) |
| Mental (psychiatric) hospitals or wards | 17 (0%) | 418 (0.1%) |
| Military hospitals or wards for chronically ill | 0 (0%) | 0 (0%) |
| Military transient quarters for temporary residents | 0 (0%) | 0 (0%) |
| Military barracks, etc. | 0 (0%) | 79 (0%) |
| Military disciplinary barracks | 0 (0%) | 0 (0%) |
| Military quarters | 0 (0%) | 0 (0%) |
| Military ships | 0 (0%) | 97 (0%) |
| Noninstitutionalized settings | 0 (0%) | 0 (0%) |
| Nursing homes | 735 (0.4%) | 3,930 (0.7%) |
| On base quarters | 0 (0%) | 0 (0%) |
| Orthopedic wards and institutions for the physically handicapped | 62 (0%) | 209 (0%) |
| Other group homes | 11 (0%) | 372 (0.1%) |
| Other hospitals or wards for chronically ill | 2 (0%) | 224 (0%) |
| Other nonhousehold living situations | 162 (0.1%) | 702 (0.1%) |
| Other noninstitutional group quarters | 1,040 (0.6%) | 2,980 (0.5%) |
| Other types of correctional institutions | 0 (0%) | 52 (0%) |
| Other workers' dormitories | 0 (0%) | 3 (0%) |
| Religious group quarters | 22 (0%) | 571 (0.1%) |
| Residential treatment centers for emotionally disturbed children | 0 (0%) | 75 (0%) |
| Schools, hospitals, or wards for the physically handicapped | 0 (0%) | 0 (0%) |
| Short-term care, detention or diagnostic centers for delinquent children | 0 (0%) | 60 (0%) |
| State prisons | 0 (0%) | 115 (0%) |
| Training schools for juvenile delinquents | 4 (0%) | 136 (0%) |
| Unknown juvenile institutions | 0 (0%) | 85 (0%) |
| Wards in general hospitals for patients who have no usual home elsewhere | 83 (0%) | 94 (0%) |
| Wards in military hospitals for patients who have no usual home elsewhere | 0 (0%) | 0 (0%) |
| English speakers (speaking English at home) | ||
| Type | Salt Lake City | Boston |
|---|---|---|
| Born in the United States residents | 90% |
87.6% |
| Foreign born residents | 17% |
20% |
| Native, born elsewhere residents | 71.9% |
27.6% |
| Total residents | 76.4% |
63.4% |
| Infrastructure | ||
| Type | Salt Lake City | Boston |
|---|---|---|
| Hospitals | 21 |
22 |
| TV stations | 15 |
22 |
| Arenas or stadiums | 3 |
3 |
| Bank branches located here | 141 |
146 |
| Bank institutions located here | 37 |
37 |
| Main business address for public companies | 30 |
60 |
| Drinking water stations with no reported violations in the past | 10 |
2 |
| Drinking water stations with reported violations in the past | 74 |
5 |
| School facilities | ||
| Type | Salt Lake City | Boston |
|---|---|---|
| Private elementary/middle schools | 14 |
8 |
| Private high schools | 11 |
8 |
| Public elementary/middle schools | 70 |
9 |
| Public high schools | 26 |
11 |
| Colleges/Universities | 18 |
34 |
| National Bridge Inventory | ||
| Type | Salt Lake City | Boston |
|---|---|---|
| Number of bridges | 320 |
512 |
| Total costs | $3,818,000 |
$5,123,900,000 |
| Total average daily traffic | 13,297,491 |
17,600,901 |
| Total average daily truck traffic | 1,807,931 |
1,129,958 |
| Length of all bridges | 5,259 feet | 17,096 feet |
| Government finances - Expenditure (per resident) | ||
| Type | Salt Lake City | Boston |
|---|---|---|
| Construction general public buildings | $81,000 ($0.40) | $9,722,000 ($14.85) |
| Current operations police protection | $87,414,000 ($436.03) | $432,751,000 ($660.92) |
| Current operations parks and recreation | $7,903,000 ($39.42) | $37,320,000 ($57.00) |
| Current operations regular highways | $26,147,000 ($130.42) | $68,532,000 ($104.67) |
| Current operations financial administration | $7,828,000 ($39.05) | $82,269,000 ($125.64) |
| Current operations housing and community development | $9,137,000 ($45.58) | $80,894,000 ($123.55) |
| Current operations judicial and legal services | $13,150,000 ($65.59) | $7,697,000 ($11.76) |
| Current operations central staff services | $10,285,000 ($51.30) | $20,704,000 ($31.62) |
| Current operations general public buildings | $0 ($0) | $33,606,000 ($51.32) |
| Current operations sewerage | $26,690,000 ($133.13) | $73,965,000 ($112.96) |
| Current operations solid waste management | $16,194,000 ($80.78) | $64,793,000 ($98.95) |
| Current operations general other | $121,722,000 ($607.16) | $431,531,000 ($659.05) |
| Current operations elementary and secondary education | $3,257,000 ($16.25) | $1,535,868,000 ($2,346) |
| General interest on debt | $110,756,000 ($552.46) | $76,731,000 ($117.19) |
| Other capital outlay general other | $7,715,000 ($38.48) | $54,908,000 ($83.86) |
| Total salaries and wages | $231,762,000 ($1,156) | $839,641,000 ($1,282) |
| Government finances - Revenue (per resident) | ||
| Type | Salt Lake City | Boston |
|---|---|---|
| Charges parks and recreation | $9,384,000 ($46.81) | $0 ($0) |
| Charges sewerage | 43,380,000 (216.38) | 213,909,000 (326.69) |
| Charges solid waste management | $11,065,000 ($55.19) | $0 ($0) |
| Miscellaneous interest earnings | $55,000 ($0.27) | $41,138,000 ($62.83) |
| Miscellaneous rents | $2,994,000 ($14.93) | $35,071,000 ($53.56) |
| State intergovernmental highways | $3,671,000 ($18.31) | $10,941,000 ($16.71) |
| Tax property | $171,761,000 ($856.76) | $2,539,737,000 ($3,879) |
| Government finances - Cash and securities (per resident) | ||
| Type | Salt Lake City | Boston |
|---|---|---|
| Sinking funds cash and securities | $89,000 ($0.44) | $274,200,000 ($418.77) |
| Taxpayer migration | ||
| Type | Salt Lake City | Boston |
|---|---|---|
| Moved from other counties | 28,130 (6.3%) | 30,514 (9.7%) |
| Moved from other counties - average AGI | $73,956 |
$100,939 |
| Moved to other counties | 29,714 (6.6%) | 45,027 (13.7%) |
| Moved to other counties - average AGI | $71,033 |
$123,761 |
| Moved from foreign countries | 50 (0%) | 29 (0%) |
| Moved from foreign countries - average AGI | $110.74 |
$81.14 |
| Moved to foreign countries | 38 (0%) | 85 (0%) |
| Moved to foreign countries - average AGI | $99.72 |
$316.52 |