Auburn, Alabama Submit your own pictures of this city and show them to the world
OSM Map
General Map
Google Map
MSN Map
OSM Map
General Map
Google Map
MSN Map
OSM Map
General Map
Google Map
MSN Map
OSM Map
General Map
Google Map
MSN Map
Please wait while loading the map...
Population in 2022: 80,006 (93% urban, 7% rural). Population change since 2000: +86.1%Males: 39,136 Females: 40,870
March 2022 cost of living index in Auburn: 85.4 (less than average, U.S. average is 100) Percentage of residents living in poverty in 2022: 22.8%for White Non-Hispanic residents , 27.5% for Black residents , 25.9% for Hispanic or Latino residents , 25.5% for American Indian residents , 32.0% for other race residents , 19.3% for two or more races residents )
Profiles of local businesses
Business Search - 14 Million verified businesses
Data:
Median household income ($)
Median household income (% change since 2000)
Household income diversity
Ratio of average income to average house value (%)
Ratio of average income to average rent
Median household income ($) - White
Median household income ($) - Black or African American
Median household income ($) - Asian
Median household income ($) - Hispanic or Latino
Median household income ($) - American Indian and Alaska Native
Median household income ($) - Multirace
Median household income ($) - Other Race
Median household income for houses/condos with a mortgage ($)
Median household income for apartments without a mortgage ($)
Races - White alone (%)
Races - White alone (% change since 2000)
Races - Black alone (%)
Races - Black alone (% change since 2000)
Races - American Indian alone (%)
Races - American Indian alone (% change since 2000)
Races - Asian alone (%)
Races - Asian alone (% change since 2000)
Races - Hispanic (%)
Races - Hispanic (% change since 2000)
Races - Native Hawaiian and Other Pacific Islander alone (%)
Races - Native Hawaiian and Other Pacific Islander alone (% change since 2000)
Races - Two or more races (%)
Races - Two or more races (% change since 2000)
Races - Other race alone (%)
Races - Other race alone (% change since 2000)
Racial diversity
Unemployment (%)
Unemployment (% change since 2000)
Unemployment (%) - White
Unemployment (%) - Black or African American
Unemployment (%) - Asian
Unemployment (%) - Hispanic or Latino
Unemployment (%) - American Indian and Alaska Native
Unemployment (%) - Multirace
Unemployment (%) - Other Race
Population density (people per square mile)
Population - Males (%)
Population - Females (%)
Population - Males (%) - White
Population - Males (%) - Black or African American
Population - Males (%) - Asian
Population - Males (%) - Hispanic or Latino
Population - Males (%) - American Indian and Alaska Native
Population - Males (%) - Multirace
Population - Males (%) - Other Race
Population - Females (%) - White
Population - Females (%) - Black or African American
Population - Females (%) - Asian
Population - Females (%) - Hispanic or Latino
Population - Females (%) - American Indian and Alaska Native
Population - Females (%) - Multirace
Population - Females (%) - Other Race
Coronavirus confirmed cases (Apr 27, 2024)
Deaths caused by coronavirus (Apr 27, 2024)
Coronavirus confirmed cases (per 100k population) (Apr 27, 2024)
Deaths caused by coronavirus (per 100k population) (Apr 27, 2024)
Daily increase in number of cases (Apr 27, 2024)
Weekly increase in number of cases (Apr 27, 2024)
Cases doubled (in days) (Apr 27, 2024)
Hospitalized patients (Apr 18, 2022)
Negative test results (Apr 18, 2022)
Total test results (Apr 18, 2022)
COVID Vaccine doses distributed (per 100k population) (Sep 19, 2023)
COVID Vaccine doses administered (per 100k population) (Sep 19, 2023)
COVID Vaccine doses distributed (Sep 19, 2023)
COVID Vaccine doses administered (Sep 19, 2023)
Likely homosexual households (%)
Likely homosexual households (% change since 2000)
Likely homosexual households - Lesbian couples (%)
Likely homosexual households - Lesbian couples (% change since 2000)
Likely homosexual households - Gay men (%)
Likely homosexual households - Gay men (% change since 2000)
Cost of living index
Median gross rent ($)
Median contract rent ($)
Median monthly housing costs ($)
Median house or condo value ($)
Median house or condo value ($ change since 2000)
Mean house or condo value by units in structure - 1, detached ($)
Mean house or condo value by units in structure - 1, attached ($)
Mean house or condo value by units in structure - 2 ($)
Mean house or condo value by units in structure by units in structure - 3 or 4 ($)
Mean house or condo value by units in structure - 5 or more ($)
Mean house or condo value by units in structure - Boat, RV, van, etc. ($)
Mean house or condo value by units in structure - Mobile home ($)
Median house or condo value ($) - White
Median house or condo value ($) - Black or African American
Median house or condo value ($) - Asian
Median house or condo value ($) - Hispanic or Latino
Median house or condo value ($) - American Indian and Alaska Native
Median house or condo value ($) - Multirace
Median house or condo value ($) - Other Race
Median resident age
Resident age diversity
Median resident age - Males
Median resident age - Females
Median resident age - White
Median resident age - Black or African American
Median resident age - Asian
Median resident age - Hispanic or Latino
Median resident age - American Indian and Alaska Native
Median resident age - Multirace
Median resident age - Other Race
Median resident age - Males - White
Median resident age - Males - Black or African American
Median resident age - Males - Asian
Median resident age - Males - Hispanic or Latino
Median resident age - Males - American Indian and Alaska Native
Median resident age - Males - Multirace
Median resident age - Males - Other Race
Median resident age - Females - White
Median resident age - Females - Black or African American
Median resident age - Females - Asian
Median resident age - Females - Hispanic or Latino
Median resident age - Females - American Indian and Alaska Native
Median resident age - Females - Multirace
Median resident age - Females - Other Race
Commute - mean travel time to work (minutes)
Travel time to work - Less than 5 minutes (%)
Travel time to work - Less than 5 minutes (% change since 2000)
Travel time to work - 5 to 9 minutes (%)
Travel time to work - 5 to 9 minutes (% change since 2000)
Travel time to work - 10 to 19 minutes (%)
Travel time to work - 10 to 19 minutes (% change since 2000)
Travel time to work - 20 to 29 minutes (%)
Travel time to work - 20 to 29 minutes (% change since 2000)
Travel time to work - 30 to 39 minutes (%)
Travel time to work - 30 to 39 minutes (% change since 2000)
Travel time to work - 40 to 59 minutes (%)
Travel time to work - 40 to 59 minutes (% change since 2000)
Travel time to work - 60 to 89 minutes (%)
Travel time to work - 60 to 89 minutes (% change since 2000)
Travel time to work - 90 or more minutes (%)
Travel time to work - 90 or more minutes (% change since 2000)
Marital status - Never married (%)
Marital status - Now married (%)
Marital status - Separated (%)
Marital status - Widowed (%)
Marital status - Divorced (%)
Median family income ($)
Median family income (% change since 2000)
Median non-family income ($)
Median non-family income (% change since 2000)
Median per capita income ($)
Median per capita income (% change since 2000)
Median family income ($) - White
Median family income ($) - Black or African American
Median family income ($) - Asian
Median family income ($) - Hispanic or Latino
Median family income ($) - American Indian and Alaska Native
Median family income ($) - Multirace
Median family income ($) - Other Race
Median year house/condo built
Median year apartment built
Year house built - Built 2005 or later (%)
Year house built - Built 2000 to 2004 (%)
Year house built - Built 1990 to 1999 (%)
Year house built - Built 1980 to 1989 (%)
Year house built - Built 1970 to 1979 (%)
Year house built - Built 1960 to 1969 (%)
Year house built - Built 1950 to 1959 (%)
Year house built - Built 1940 to 1949 (%)
Year house built - Built 1939 or earlier (%)
Average household size
Household density (households per square mile)
Average household size - White
Average household size - Black or African American
Average household size - Asian
Average household size - Hispanic or Latino
Average household size - American Indian and Alaska Native
Average household size - Multirace
Average household size - Other Race
Occupied housing units (%)
Vacant housing units (%)
Owner occupied housing units (%)
Renter occupied housing units (%)
Vacancy status - For rent (%)
Vacancy status - For sale only (%)
Vacancy status - Rented or sold, not occupied (%)
Vacancy status - For seasonal, recreational, or occasional use (%)
Vacancy status - For migrant workers (%)
Vacancy status - Other vacant (%)
Residents with income below the poverty level (%)
Residents with income below 50% of the poverty level (%)
Children below poverty level (%)
Poor families by family type - Married-couple family (%)
Poor families by family type - Male, no wife present (%)
Poor families by family type - Female, no husband present (%)
Poverty status for native-born residents (%)
Poverty status for foreign-born residents (%)
Poverty among high school graduates not in families (%)
Poverty among people who did not graduate high school not in families (%)
Residents with income below the poverty level (%) - White
Residents with income below the poverty level (%) - Black or African American
Residents with income below the poverty level (%) - Asian
Residents with income below the poverty level (%) - Hispanic or Latino
Residents with income below the poverty level (%) - American Indian and Alaska Native
Residents with income below the poverty level (%) - Multirace
Residents with income below the poverty level (%) - Other Race
Air pollution - Air Quality Index (AQI)
Air pollution - CO
Air pollution - NO2
Air pollution - SO2
Air pollution - Ozone
Air pollution - PM10
Air pollution - PM25
Air pollution - Pb
Crime - Murders per 100,000 population
Crime - Rapes per 100,000 population
Crime - Robberies per 100,000 population
Crime - Assaults per 100,000 population
Crime - Burglaries per 100,000 population
Crime - Thefts per 100,000 population
Crime - Auto thefts per 100,000 population
Crime - Arson per 100,000 population
Crime - City-data.com crime index
Crime - Violent crime index
Crime - Property crime index
Crime - Murders per 100,000 population (5 year average)
Crime - Rapes per 100,000 population (5 year average)
Crime - Robberies per 100,000 population (5 year average)
Crime - Assaults per 100,000 population (5 year average)
Crime - Burglaries per 100,000 population (5 year average)
Crime - Thefts per 100,000 population (5 year average)
Crime - Auto thefts per 100,000 population (5 year average)
Crime - Arson per 100,000 population (5 year average)
Crime - City-data.com crime index (5 year average)
Crime - Violent crime index (5 year average)
Crime - Property crime index (5 year average)
1996 Presidential Elections Results (%) - Democratic Party (Clinton)
1996 Presidential Elections Results (%) - Republican Party (Dole)
1996 Presidential Elections Results (%) - Other
2000 Presidential Elections Results (%) - Democratic Party (Gore)
2000 Presidential Elections Results (%) - Republican Party (Bush)
2000 Presidential Elections Results (%) - Other
2004 Presidential Elections Results (%) - Democratic Party (Kerry)
2004 Presidential Elections Results (%) - Republican Party (Bush)
2004 Presidential Elections Results (%) - Other
2008 Presidential Elections Results (%) - Democratic Party (Obama)
2008 Presidential Elections Results (%) - Republican Party (McCain)
2008 Presidential Elections Results (%) - Other
2012 Presidential Elections Results (%) - Democratic Party (Obama)
2012 Presidential Elections Results (%) - Republican Party (Romney)
2012 Presidential Elections Results (%) - Other
2016 Presidential Elections Results (%) - Democratic Party (Clinton)
2016 Presidential Elections Results (%) - Republican Party (Trump)
2016 Presidential Elections Results (%) - Other
2020 Presidential Elections Results (%) - Democratic Party (Biden)
2020 Presidential Elections Results (%) - Republican Party (Trump)
2020 Presidential Elections Results (%) - Other
Ancestries Reported - Arab (%)
Ancestries Reported - Czech (%)
Ancestries Reported - Danish (%)
Ancestries Reported - Dutch (%)
Ancestries Reported - English (%)
Ancestries Reported - French (%)
Ancestries Reported - French Canadian (%)
Ancestries Reported - German (%)
Ancestries Reported - Greek (%)
Ancestries Reported - Hungarian (%)
Ancestries Reported - Irish (%)
Ancestries Reported - Italian (%)
Ancestries Reported - Lithuanian (%)
Ancestries Reported - Norwegian (%)
Ancestries Reported - Polish (%)
Ancestries Reported - Portuguese (%)
Ancestries Reported - Russian (%)
Ancestries Reported - Scotch-Irish (%)
Ancestries Reported - Scottish (%)
Ancestries Reported - Slovak (%)
Ancestries Reported - Subsaharan African (%)
Ancestries Reported - Swedish (%)
Ancestries Reported - Swiss (%)
Ancestries Reported - Ukrainian (%)
Ancestries Reported - United States (%)
Ancestries Reported - Welsh (%)
Ancestries Reported - West Indian (%)
Ancestries Reported - Other (%)
Educational Attainment - No schooling completed (%)
Educational Attainment - Less than high school (%)
Educational Attainment - High school or equivalent (%)
Educational Attainment - Less than 1 year of college (%)
Educational Attainment - 1 or more years of college (%)
Educational Attainment - Associate degree (%)
Educational Attainment - Bachelor's degree (%)
Educational Attainment - Master's degree (%)
Educational Attainment - Professional school degree (%)
Educational Attainment - Doctorate degree (%)
School Enrollment - Nursery, preschool (%)
School Enrollment - Kindergarten (%)
School Enrollment - Grade 1 to 4 (%)
School Enrollment - Grade 5 to 8 (%)
School Enrollment - Grade 9 to 12 (%)
School Enrollment - College undergrad (%)
School Enrollment - Graduate or professional (%)
School Enrollment - Not enrolled in school (%)
School enrollment - Public schools (%)
School enrollment - Private schools (%)
School enrollment - Not enrolled (%)
Median number of rooms in houses and condos
Median number of rooms in apartments
Housing units lacking complete plumbing facilities (%)
Housing units lacking complete kitchen facilities (%)
Density of houses
Urban houses (%)
Rural houses (%)
Households with people 60 years and over (%)
Households with people 65 years and over (%)
Households with people 75 years and over (%)
Households with one or more nonrelatives (%)
Households with no nonrelatives (%)
Population in households (%)
Family households (%)
Nonfamily households (%)
Population in families (%)
Family households with own children (%)
Median number of bedrooms in owner occupied houses
Mean number of bedrooms in owner occupied houses
Median number of bedrooms in renter occupied houses
Mean number of bedrooms in renter occupied houses
Median number of vehichles in owner occupied houses
Mean number of vehichles in owner occupied houses
Median number of vehichles in renter occupied houses
Mean number of vehichles in renter occupied houses
Mortgage status - with mortgage (%)
Mortgage status - with second mortgage (%)
Mortgage status - with home equity loan (%)
Mortgage status - with both second mortgage and home equity loan (%)
Mortgage status - without a mortgage (%)
Average family size
Average family size - White
Average family size - Black or African American
Average family size - Asian
Average family size - Hispanic or Latino
Average family size - American Indian and Alaska Native
Average family size - Multirace
Average family size - Other Race
Geographical mobility - Same house 1 year ago (%)
Geographical mobility - Moved within same county (%)
Geographical mobility - Moved from different county within same state (%)
Geographical mobility - Moved from different state (%)
Geographical mobility - Moved from abroad (%)
Place of birth - Born in state of residence (%)
Place of birth - Born in other state (%)
Place of birth - Native, outside of US (%)
Place of birth - Foreign born (%)
Housing units in structures - 1, detached (%)
Housing units in structures - 1, attached (%)
Housing units in structures - 2 (%)
Housing units in structures - 3 or 4 (%)
Housing units in structures - 5 to 9 (%)
Housing units in structures - 10 to 19 (%)
Housing units in structures - 20 to 49 (%)
Housing units in structures - 50 or more (%)
Housing units in structures - Mobile home (%)
Housing units in structures - Boat, RV, van, etc. (%)
House/condo owner moved in on average (years ago)
Renter moved in on average (years ago)
Year householder moved into unit - Moved in 1999 to March 2000 (%)
Year householder moved into unit - Moved in 1995 to 1998 (%)
Year householder moved into unit - Moved in 1990 to 1994 (%)
Year householder moved into unit - Moved in 1980 to 1989 (%)
Year householder moved into unit - Moved in 1970 to 1979 (%)
Year householder moved into unit - Moved in 1969 or earlier (%)
Means of transportation to work - Drove car alone (%)
Means of transportation to work - Carpooled (%)
Means of transportation to work - Public transportation (%)
Means of transportation to work - Bus or trolley bus (%)
Means of transportation to work - Streetcar or trolley car (%)
Means of transportation to work - Subway or elevated (%)
Means of transportation to work - Railroad (%)
Means of transportation to work - Ferryboat (%)
Means of transportation to work - Taxicab (%)
Means of transportation to work - Motorcycle (%)
Means of transportation to work - Bicycle (%)
Means of transportation to work - Walked (%)
Means of transportation to work - Other means (%)
Working at home (%)
Industry diversity
Most Common Industries - Agriculture, forestry, fishing and hunting, and mining (%)
Most Common Industries - Agriculture, forestry, fishing and hunting (%)
Most Common Industries - Mining, quarrying, and oil and gas extraction (%)
Most Common Industries - Construction (%)
Most Common Industries - Manufacturing (%)
Most Common Industries - Wholesale trade (%)
Most Common Industries - Retail trade (%)
Most Common Industries - Transportation and warehousing, and utilities (%)
Most Common Industries - Transportation and warehousing (%)
Most Common Industries - Utilities (%)
Most Common Industries - Information (%)
Most Common Industries - Finance and insurance, and real estate and rental and leasing (%)
Most Common Industries - Finance and insurance (%)
Most Common Industries - Real estate and rental and leasing (%)
Most Common Industries - Professional, scientific, and management, and administrative and waste management services (%)
Most Common Industries - Professional, scientific, and technical services (%)
Most Common Industries - Management of companies and enterprises (%)
Most Common Industries - Administrative and support and waste management services (%)
Most Common Industries - Educational services, and health care and social assistance (%)
Most Common Industries - Educational services (%)
Most Common Industries - Health care and social assistance (%)
Most Common Industries - Arts, entertainment, and recreation, and accommodation and food services (%)
Most Common Industries - Arts, entertainment, and recreation (%)
Most Common Industries - Accommodation and food services (%)
Most Common Industries - Other services, except public administration (%)
Most Common Industries - Public administration (%)
Occupation diversity
Most Common Occupations - Management, business, science, and arts occupations (%)
Most Common Occupations - Management, business, and financial occupations (%)
Most Common Occupations - Management occupations (%)
Most Common Occupations - Business and financial operations occupations (%)
Most Common Occupations - Computer, engineering, and science occupations (%)
Most Common Occupations - Computer and mathematical occupations (%)
Most Common Occupations - Architecture and engineering occupations (%)
Most Common Occupations - Life, physical, and social science occupations (%)
Most Common Occupations - Education, legal, community service, arts, and media occupations (%)
Most Common Occupations - Community and social service occupations (%)
Most Common Occupations - Legal occupations (%)
Most Common Occupations - Education, training, and library occupations (%)
Most Common Occupations - Arts, design, entertainment, sports, and media occupations (%)
Most Common Occupations - Healthcare practitioners and technical occupations (%)
Most Common Occupations - Health diagnosing and treating practitioners and other technical occupations (%)
Most Common Occupations - Health technologists and technicians (%)
Most Common Occupations - Service occupations (%)
Most Common Occupations - Healthcare support occupations (%)
Most Common Occupations - Protective service occupations (%)
Most Common Occupations - Fire fighting and prevention, and other protective service workers including supervisors (%)
Most Common Occupations - Law enforcement workers including supervisors (%)
Most Common Occupations - Food preparation and serving related occupations (%)
Most Common Occupations - Building and grounds cleaning and maintenance occupations (%)
Most Common Occupations - Personal care and service occupations (%)
Most Common Occupations - Sales and office occupations (%)
Most Common Occupations - Sales and related occupations (%)
Most Common Occupations - Office and administrative support occupations (%)
Most Common Occupations - Natural resources, construction, and maintenance occupations (%)
Most Common Occupations - Farming, fishing, and forestry occupations (%)
Most Common Occupations - Construction and extraction occupations (%)
Most Common Occupations - Installation, maintenance, and repair occupations (%)
Most Common Occupations - Production, transportation, and material moving occupations (%)
Most Common Occupations - Production occupations (%)
Most Common Occupations - Transportation occupations (%)
Most Common Occupations - Material moving occupations (%)
People in Group quarters - Institutionalized population (%)
People in Group quarters - Correctional institutions (%)
People in Group quarters - Federal prisons and detention centers (%)
People in Group quarters - Halfway houses (%)
People in Group quarters - Local jails and other confinement facilities (including police lockups) (%)
People in Group quarters - Military disciplinary barracks (%)
People in Group quarters - State prisons (%)
People in Group quarters - Other types of correctional institutions (%)
People in Group quarters - Nursing homes (%)
People in Group quarters - Hospitals/wards, hospices, and schools for the handicapped (%)
People in Group quarters - Hospitals/wards and hospices for chronically ill (%)
People in Group quarters - Hospices or homes for chronically ill (%)
People in Group quarters - Military hospitals or wards for chronically ill (%)
People in Group quarters - Other hospitals or wards for chronically ill (%)
People in Group quarters - Hospitals or wards for drug/alcohol abuse (%)
People in Group quarters - Mental (Psychiatric) hospitals or wards (%)
People in Group quarters - Schools, hospitals, or wards for the mentally retarded (%)
People in Group quarters - Schools, hospitals, or wards for the physically handicapped (%)
People in Group quarters - Institutions for the deaf (%)
People in Group quarters - Institutions for the blind (%)
People in Group quarters - Orthopedic wards and institutions for the physically handicapped (%)
People in Group quarters - Wards in general hospitals for patients who have no usual home elsewhere (%)
People in Group quarters - Wards in military hospitals for patients who have no usual home elsewhere (%)
People in Group quarters - Juvenile institutions (%)
People in Group quarters - Long-term care (%)
People in Group quarters - Homes for abused, dependent, and neglected children (%)
People in Group quarters - Residential treatment centers for emotionally disturbed children (%)
People in Group quarters - Training schools for juvenile delinquents (%)
People in Group quarters - Short-term care, detention or diagnostic centers for delinquent children (%)
People in Group quarters - Type of juvenile institution unknown (%)
People in Group quarters - Noninstitutionalized population (%)
People in Group quarters - College dormitories (includes college quarters off campus) (%)
People in Group quarters - Military quarters (%)
People in Group quarters - On base (%)
People in Group quarters - Barracks, unaccompanied personnel housing (UPH), (Enlisted/Officer), ;and similar group living quarters for military personnel (%)
People in Group quarters - Transient quarters for temporary residents (%)
People in Group quarters - Military ships (%)
People in Group quarters - Group homes (%)
People in Group quarters - Homes or halfway houses for drug/alcohol abuse (%)
People in Group quarters - Homes for the mentally ill (%)
People in Group quarters - Homes for the mentally retarded (%)
People in Group quarters - Homes for the physically handicapped (%)
People in Group quarters - Other group homes (%)
People in Group quarters - Religious group quarters (%)
People in Group quarters - Dormitories (%)
People in Group quarters - Agriculture workers' dormitories on farms (%)
People in Group quarters - Job Corps and vocational training facilities (%)
People in Group quarters - Other workers' dormitories (%)
People in Group quarters - Crews of maritime vessels (%)
People in Group quarters - Other nonhousehold living situations (%)
People in Group quarters - Other noninstitutional group quarters (%)
Residents speaking English at home (%)
Residents speaking English at home - Born in the United States (%)
Residents speaking English at home - Native, born elsewhere (%)
Residents speaking English at home - Foreign born (%)
Residents speaking Spanish at home (%)
Residents speaking Spanish at home - Born in the United States (%)
Residents speaking Spanish at home - Native, born elsewhere (%)
Residents speaking Spanish at home - Foreign born (%)
Residents speaking other language at home (%)
Residents speaking other language at home - Born in the United States (%)
Residents speaking other language at home - Native, born elsewhere (%)
Residents speaking other language at home - Foreign born (%)
Class of Workers - Employee of private company (%)
Class of Workers - Self-employed in own incorporated business (%)
Class of Workers - Private not-for-profit wage and salary workers (%)
Class of Workers - Local government workers (%)
Class of Workers - State government workers (%)
Class of Workers - Federal government workers (%)
Class of Workers - Self-employed workers in own not incorporated business and Unpaid family workers (%)
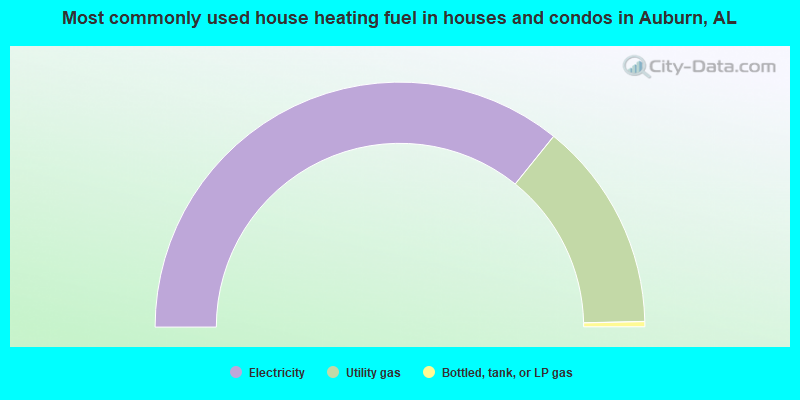
House heating fuel used in houses and condos - Utility gas (%)
House heating fuel used in houses and condos - Bottled, tank, or LP gas (%)
House heating fuel used in houses and condos - Electricity (%)
House heating fuel used in houses and condos - Fuel oil, kerosene, etc. (%)
House heating fuel used in houses and condos - Coal or coke (%)
House heating fuel used in houses and condos - Wood (%)
House heating fuel used in houses and condos - Solar energy (%)
House heating fuel used in houses and condos - Other fuel (%)
House heating fuel used in houses and condos - No fuel used (%)
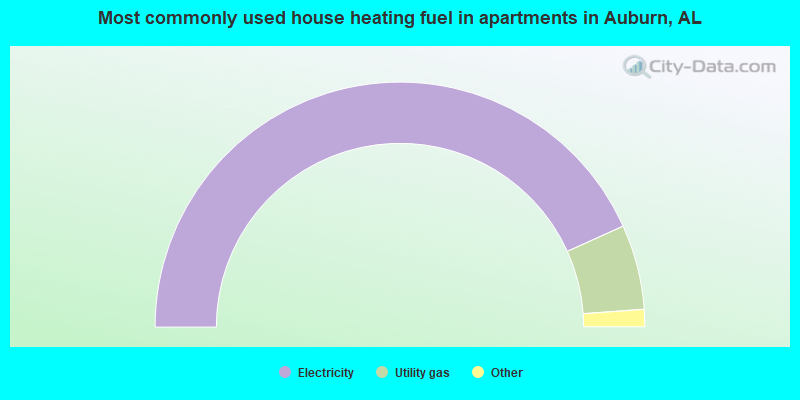
House heating fuel used in apartments - Utility gas (%)
House heating fuel used in apartments - Bottled, tank, or LP gas (%)
House heating fuel used in apartments - Electricity (%)
House heating fuel used in apartments - Fuel oil, kerosene, etc. (%)
House heating fuel used in apartments - Coal or coke (%)
House heating fuel used in apartments - Wood (%)
House heating fuel used in apartments - Solar energy (%)
House heating fuel used in apartments - Other fuel (%)
House heating fuel used in apartments - No fuel used (%)
Armed forces status - In Armed Forces (%)
Armed forces status - Civilian (%)
Armed forces status - Civilian - Veteran (%)
Armed forces status - Civilian - Nonveteran (%)
Fatal accidents locations in years 2005-2021
Fatal accidents locations in 2005
Fatal accidents locations in 2006
Fatal accidents locations in 2007
Fatal accidents locations in 2008
Fatal accidents locations in 2009
Fatal accidents locations in 2010
Fatal accidents locations in 2011
Fatal accidents locations in 2012
Fatal accidents locations in 2013
Fatal accidents locations in 2014
Fatal accidents locations in 2015
Fatal accidents locations in 2016
Fatal accidents locations in 2017
Fatal accidents locations in 2018
Fatal accidents locations in 2019
Fatal accidents locations in 2020
Fatal accidents locations in 2021
Alcohol use - People drinking some alcohol every month (%)
Alcohol use - People not drinking at all (%)
Alcohol use - Average days/month drinking alcohol
Alcohol use - Average drinks/week
Alcohol use - Average days/year people drink much
Audiometry - Average condition of hearing (%)
Audiometry - People that can hear a whisper from across a quiet room (%)
Audiometry - People that can hear normal voice from across a quiet room (%)
Audiometry - Ears ringing, roaring, buzzing (%)
Audiometry - Had a job exposure to loud noise (%)
Audiometry - Had off-work exposure to loud noise (%)
Blood Pressure & Cholesterol - Has high blood pressure (%)
Blood Pressure & Cholesterol - Checking blood pressure at home (%)
Blood Pressure & Cholesterol - Frequently checking blood cholesterol (%)
Blood Pressure & Cholesterol - Has high cholesterol level (%)
Consumer Behavior - Money monthly spent on food at supermarket/grocery store
Consumer Behavior - Money monthly spent on food at other stores
Consumer Behavior - Money monthly spent on eating out
Consumer Behavior - Money monthly spent on carryout/delivered foods
Consumer Behavior - Income spent on food at supermarket/grocery store (%)
Consumer Behavior - Income spent on food at other stores (%)
Consumer Behavior - Income spent on eating out (%)
Consumer Behavior - Income spent on carryout/delivered foods (%)
Current Health Status - General health condition (%)
Current Health Status - Blood donors (%)
Current Health Status - Has blood ever tested for HIV virus (%)
Current Health Status - Left-handed people (%)
Dermatology - People using sunscreen (%)
Diabetes - Diabetics (%)
Diabetes - Had a blood test for high blood sugar (%)
Diabetes - People taking insulin (%)
Diet Behavior & Nutrition - Diet health (%)
Diet Behavior & Nutrition - Milk product consumption (# of products/month)
Diet Behavior & Nutrition - Meals not home prepared (#/week)
Diet Behavior & Nutrition - Meals from fast food or pizza place (#/week)
Diet Behavior & Nutrition - Ready-to-eat foods (#/month)
Diet Behavior & Nutrition - Frozen meals/pizza (#/month)
Drug Use - People that ever used marijuana or hashish (%)
Drug Use - Ever used hard drugs (%)
Drug Use - Ever used any form of cocaine (%)
Drug Use - Ever used heroin (%)
Drug Use - Ever used methamphetamine (%)
Health Insurance - People covered by health insurance (%)
Kidney Conditions-Urology - Avg. # of times urinating at night
Medical Conditions - People with asthma (%)
Medical Conditions - People with anemia (%)
Medical Conditions - People with psoriasis (%)
Medical Conditions - People with overweight (%)
Medical Conditions - Elderly people having difficulties in thinking or remembering (%)
Medical Conditions - People who ever received blood transfusion (%)
Medical Conditions - People having trouble seeing even with glass/contacts (%)
Medical Conditions - People with arthritis (%)
Medical Conditions - People with gout (%)
Medical Conditions - People with congestive heart failure (%)
Medical Conditions - People with coronary heart disease (%)
Medical Conditions - People with angina pectoris (%)
Medical Conditions - People who ever had heart attack (%)
Medical Conditions - People who ever had stroke (%)
Medical Conditions - People with emphysema (%)
Medical Conditions - People with thyroid problem (%)
Medical Conditions - People with chronic bronchitis (%)
Medical Conditions - People with any liver condition (%)
Medical Conditions - People who ever had cancer or malignancy (%)
Mental Health - People who have little interest in doing things (%)
Mental Health - People feeling down, depressed, or hopeless (%)
Mental Health - People who have trouble sleeping or sleeping too much (%)
Mental Health - People feeling tired or having little energy (%)
Mental Health - People with poor appetite or overeating (%)
Mental Health - People feeling bad about themself (%)
Mental Health - People who have trouble concentrating on things (%)
Mental Health - People moving or speaking slowly or too fast (%)
Mental Health - People having thoughts they would be better off dead (%)
Oral Health - Average years since last visit a dentist
Oral Health - People embarrassed because of mouth (%)
Oral Health - People with gum disease (%)
Oral Health - General health of teeth and gums (%)
Oral Health - Average days a week using dental floss/device
Oral Health - Average days a week using mouthwash for dental problem
Oral Health - Average number of teeth
Pesticide Use - Households using pesticides to control insects (%)
Pesticide Use - Households using pesticides to kill weeds (%)
Physical Activity - People doing vigorous-intensity work activities (%)
Physical Activity - People doing moderate-intensity work activities (%)
Physical Activity - People walking or bicycling (%)
Physical Activity - People doing vigorous-intensity recreational activities (%)
Physical Activity - People doing moderate-intensity recreational activities (%)
Physical Activity - Average hours a day doing sedentary activities
Physical Activity - Average hours a day watching TV or videos
Physical Activity - Average hours a day using computer
Physical Functioning - People having limitations keeping them from working (%)
Physical Functioning - People limited in amount of work they can do (%)
Physical Functioning - People that need special equipment to walk (%)
Physical Functioning - People experiencing confusion/memory problems (%)
Physical Functioning - People requiring special healthcare equipment (%)
Prescription Medications - Average number of prescription medicines taking
Preventive Aspirin Use - Adults 40+ taking low-dose aspirin (%)
Reproductive Health - Vaginal deliveries (%)
Reproductive Health - Cesarean deliveries (%)
Reproductive Health - Deliveries resulted in a live birth (%)
Reproductive Health - Pregnancies resulted in a delivery (%)
Reproductive Health - Women breastfeeding newborns (%)
Reproductive Health - Women that had a hysterectomy (%)
Reproductive Health - Women that had both ovaries removed (%)
Reproductive Health - Women that have ever taken birth control pills (%)
Reproductive Health - Women taking birth control pills (%)
Reproductive Health - Women that have ever used Depo-Provera or injectables (%)
Reproductive Health - Women that have ever used female hormones (%)
Sexual Behavior - People 18+ that ever had sex (vaginal, anal, or oral) (%)
Sexual Behavior - Males 18+ that ever had vaginal sex with a woman (%)
Sexual Behavior - Males 18+ that ever performed oral sex on a woman (%)
Sexual Behavior - Males 18+ that ever had anal sex with a woman (%)
Sexual Behavior - Males 18+ that ever had any sex with a man (%)
Sexual Behavior - Females 18+ that ever had vaginal sex with a man (%)
Sexual Behavior - Females 18+ that ever performed oral sex on a man (%)
Sexual Behavior - Females 18+ that ever had anal sex with a man (%)
Sexual Behavior - Females 18+ that ever had any kind of sex with a woman (%)
Sexual Behavior - Average age people first had sex
Sexual Behavior - Average number of female sex partners in lifetime (males 18+)
Sexual Behavior - Average number of female vaginal sex partners in lifetime (males 18+)
Sexual Behavior - Average age people first performed oral sex on a woman (18+)
Sexual Behavior - Average number of woman performed oral sex on in lifetime (18+)
Sexual Behavior - Average number of male sex partners in lifetime (males 18+)
Sexual Behavior - Average number of male anal sex partners in lifetime (males 18+)
Sexual Behavior - Average age people first performed oral sex on a man (18+)
Sexual Behavior - Average number of male oral sex partners in lifetime (18+)
Sexual Behavior - People using protection when performing oral sex (%)
Sexual Behavior - Average number of times people have vaginal or anal sex a year
Sexual Behavior - People having sex without condom (%)
Sexual Behavior - Average number of male sex partners in lifetime (females 18+)
Sexual Behavior - Average number of male vaginal sex partners in lifetime (females 18+)
Sexual Behavior - Average number of female sex partners in lifetime (females 18+)
Sexual Behavior - Circumcised males 18+ (%)
Sleep Disorders - Average hours sleeping at night
Sleep Disorders - People that has trouble sleeping (%)
Smoking-Cigarette Use - People smoking cigarettes (%)
Taste & Smell - People 40+ having problems with smell (%)
Taste & Smell - People 40+ having problems with taste (%)
Taste & Smell - People 40+ that ever had wisdom teeth removed (%)
Taste & Smell - People 40+ that ever had tonsils teeth removed (%)
Taste & Smell - People 40+ that ever had a loss of consciousness because of a head injury (%)
Taste & Smell - People 40+ that ever had a broken nose or other serious injury to face or skull (%)
Taste & Smell - People 40+ that ever had two or more sinus infections (%)
Weight - Average height (inches)
Weight - Average weight (pounds)
Weight - Average BMI
Weight - People that are obese (%)
Weight - People that ever were obese (%)
Weight - People trying to lose weight (%)
53,364 67.4% White alone 13,770 17.4% Black alone 6,173 7.8% Asian alone 2,952 3.7% Hispanic 2,394 3.0% Two or more races 415 0.5% Other race alone 35 0.04% American Indian alone
According to our research of Alabama and other state lists, there were 37 registered sex offenders living in Auburn, Alabama as of April 27, 2024 . The ratio of all residents to sex offenders in Auburn is 1,638 to 1.The ratio of registered sex offenders to all residents in this city is much lower than the state average.
The City-Data.com crime index weighs serious crimes and violent crimes more heavily. Higher means more crime, U.S. average is 246.1. It adjusts for the number of visitors and daily workers commuting into cities.
- means the value is smaller than the state average.
- means the value is about the same as the state average.
- means the value is bigger than the state average.
- means the value is much bigger than the state average.
Crime rate in Auburn detailed stats: murders, rapes, robberies, assaults, burglaries, thefts, arson Officers per 1,000 residents here:
1.81Alabama average:
2.40
Latest news from Auburn, AL collected exclusively by city-data.com from local newspapers, TV, and radio stations
Ancestries: American (16.9%), English (7.5%), Irish (7.0%), German (6.0%), European (4.7%), Scottish (1.8%).
Current Local Time:
Incorporated on 02/02/1839
Land area: 39.1 square miles.
Population density: 2,045 people per square mile (low).
7,276 residents are foreign born (6.5% Asia , 1.4% Latin America ).
This city:
9.2%Alabama:
3.5%
Median real estate property taxes paid for housing units with mortgages in 2022: $1,451 (0.4%)Median real estate property taxes paid for housing units with no mortgage in 2022: $1,705 (0.5%)
Nearest city with pop. 50,000+: Columbus, GA
Nearest city with pop. 200,000+: Montgomery, AL
Nearest city with pop. 1,000,000+: Houston, TX
Nearest cities:
Loachapoka, AL (2.6 miles),
Waverly, AL (3.3 miles),
Cusseta, AL (4.1 miles)
Latitude: 32.60 N, Longitude: 85.48 W
Nickname or alias (official or unofficial): The Loveliest Village on the Plains
Daytime population change due to commuting: -903 (-1.1%)Workers who live and work in this city: 26,559 (67.4%)
Auburn tourist attractions:
Single-family new house construction building permits:
2022: 482 buildings , average cost: $274,6002021: 731 buildings , average cost: $284,1002020: 643 buildings , average cost: $269,2002019: 530 buildings , average cost: $267,9002018: 583 buildings , average cost: $281,6002017: 573 buildings , average cost: $286,9002016: 497 buildings , average cost: $289,1002015: 482 buildings , average cost: $312,6002014: 427 buildings , average cost: $291,8002013: 400 buildings , average cost: $313,6002012: 369 buildings , average cost: $309,3002011: 495 buildings , average cost: $236,9002010: 288 buildings , average cost: $240,9002009: 284 buildings , average cost: $230,7002008: 244 buildings , average cost: $237,3002007: 403 buildings , average cost: $228,4002006: 846 buildings , average cost: $175,5002005: 747 buildings , average cost: $166,3002004: 665 buildings , average cost: $142,5002003: 585 buildings , average cost: $130,9002002: 330 buildings , average cost: $152,0002001: 285 buildings , average cost: $135,3002000: 262 buildings , average cost: $146,4001999: 267 buildings , average cost: $141,5001998: 187 buildings , average cost: $145,6001997: 226 buildings , average cost: $125,300Unemployment in December 2023:
Population change in the 1990s: +8,240 (+23.7%).
Most common occupations in Auburn, AL (%)
Both Males Females
Postsecondary teachers (9.7%)
Other management occupations, except farmers and farm managers (5.0%)
Cashiers (3.7%)
Retail sales workers, except cashiers (3.7%)
Other office and administrative support workers, including supervisors (3.6%)
Other sales and related occupations, including supervisors (3.6%)
Building and grounds cleaning and maintenance occupations (3.2%)
Postsecondary teachers (11.6%)
Other management occupations, except farmers and farm managers (6.3%)
Building and grounds cleaning and maintenance occupations (4.3%)
Cooks and food preparation workers (4.3%)
Other sales and related occupations, including supervisors (3.5%)
Computer specialists (3.4%)
Retail sales workers, except cashiers (2.9%)
Postsecondary teachers (7.4%)
Cashiers (5.8%)
Preschool, kindergarten, elementary, and middle school teachers (5.6%)
Other office and administrative support workers, including supervisors (5.6%)
Information and record clerks, except customer service representatives (5.3%)
Secretaries and administrative assistants (5.0%)
Retail sales workers, except cashiers (4.6%)
Air pollution and air quality trends(lower is better)
AQI Ozone
Tornado activity:
Auburn-area historical tornado activity is slightly below Alabama state average. It is 42% greater than the overall U.S. average.
On 4/18/1953, a category F3 (max. wind speeds 158-206 mph) tornado 5.8 miles away from the Auburn city center killed 8 people and injured 495 people and caused between $5,000,000 and $50,000,000 in damages.
On 12/5/1954, a category F3 tornado 6.7 miles away from the city center injured 7 people and caused between $50,000 and $500,000 in damages.
Earthquake activity:
Auburn-area historical earthquake activity is significantly above Alabama state average. It is 51% greater than the overall U.S. average. On 4/29/2003 at 08:59:39, a magnitude 4.9 (4.4 MB, 4.6 MW, 4.9 LG, Class: Light, Intensity: IV - V) earthquake occurred 131.4 miles away from the city center On 1/18/1999 at 07:00:53, a magnitude 4.8 (4.8 MB, 4.0 LG, Depth: 0.6 mi) earthquake occurred 117.1 miles away from Auburn center On 10/24/1997 at 08:35:17, a magnitude 4.9 (4.8 MB, 4.2 MS, 4.9 LG, Depth: 6.2 mi) earthquake occurred 146.5 miles away from the city center On 4/29/2003 at 08:59:39, a magnitude 4.6 (4.6 MW, Depth: 12.3 mi) earthquake occurred 131.4 miles away from the city center On 8/2/1974 at 08:52:09, a magnitude 4.9 (4.3 MB, 4.9 LG) earthquake occurred 194.3 miles away from Auburn center On 6/24/1975 at 11:11:36, a magnitude 4.5 (4.5 MB) earthquake occurred 157.1 miles away from the city center Magnitude types: regional Lg-wave magnitude (LG), body-wave magnitude (MB), surface-wave magnitude (MS), moment magnitude (MW) Natural disasters: The number of natural disasters in Lee County (17) is near the US average (15).Major Disasters (Presidential) Declared: 9Emergencies Declared: 6Storms: 8, Tornadoes: 8, Floods: 6, Hurricanes: 5, Winds: 4, Drought: 1, Snowfall: 1, Winter Storm: 1, Other: 1 (Note: some incidents may be assigned to more than one category). Main business address for: AUBURN NATIONAL BANCORPORATION INC STATE COMMERCIAL BANKS ).
Hospitals and medical centers in Auburn: HOSPICE OF EAMC (665 OPELIKA ROAD) OAK PARK (1365 GATEWOOD DRIVE)
FMC AUBURN (211 E UNIVERSITY DR)
HOMECARE OF EAST ALABAMA MEDICAL CENTER (665 OPELIKA ROAD)
Airports located in Auburn: Colleges/universities with over 2000 students nearest to Auburn:
Auburn University (about 1 miles; Auburn University, AL ; Full-time enrollment: 22,741)
Tuskegee University (about 18 miles; Tuskegee, AL ; FT enrollment: 2,810)
Columbus Technical College (about 30 miles; Columbus, GA ; FT enrollment: 3,241)
Columbus State University (about 33 miles; Columbus, GA ; FT enrollment: 6,876)
Southern Union State Community College (about 38 miles; Wadley, AL ; FT enrollment: 4,120)
Auburn University at Montgomery (about 44 miles; Montgomery, AL ; FT enrollment: 4,092)
Faulkner University (about 46 miles; Montgomery, AL ; FT enrollment: 2,887)
Public high schools in Auburn:
Public elementary/middle schools in Auburn: DRAKE MIDDLE SCH Students: 833, Location: 655 SPENCER AVE, Grades: 6-7)OGLETREE SCH Students: 551, Location: 737 OGLETREE RD, Grades: 3-5)MARGARET YARBROUGH SCH Students: 476, Location: 1555 N DONAHUE DR, Grades: 3-5)AUBURN EARLY ED CTR Students: 458, Location: 721 E UNIVERSITY DR, Grades: PK-2)CARY WOODS ELEM SCH Students: 441, Location: 715 SANDERS ST, Grades: KG-2)DEAN ROAD ELEM SCH Students: 403, Location: 335 S DEAN RD, Grades: KG-2)WRIGHTS MILL ROAD ELEM SCH Students: 381, Location: 807 WRIGHTS MILL RD, Grades: 3-5)RICHLAND ELEMENTARY SCHOOL Location: 770 YARBROUGH FARMS BOULEVARD, Grades: KG-2)
PICK ELEMENTARY SCHOOL Location: 1320 N COLLEGE ST, Grades: 3-5)
See full list of schools located in Auburn Library in Auburn: AUBURN PUBLIC LIBRARY Operating income: $1,555,526; Location: 749 EAST THACH AVENUE; 63,038 books ; 2,441 audio materials ; 2,437 video materials ; 6 local licensed databases ; 81 state licensed databases ; 157 print serial subscriptions )
Notable locations in Auburn: (A) , Whatley Mill (B) , Scott Industrial Park (C) , Beard - Eaves - Memorial Coliseum (D) , Indian Pines Country Club (E) , Camp Auburn (F) , Auburn Industrial Park (G) , Hollifield Memorial Library (H) , Draughon Library (I) , McWhorter Center (J) , Watson Fieldhouse (K) , Wilson Livestock Arena (L) , Jule Collins Smith Museum of Fine Art (M) , M W Smith Hall (N) , Funchess Hall (O) , Comer Hall (P) , Upchurch Hall (Q) , Swingle Hall (R) , Corley Building (S) , Duncan Hall (T) . Display/hide their locations on the map
Shopping Centers: (1) , Southside Shopping Center (2) , Market Square Shopping Center (3) , Glendean Shopping Center (4) , Corner Village Shopping Center (5) . Display/hide their locations on the map
Churches in Auburn include: (A) , Sacred Heart Catholic Church (B) , Lakeview Baptist Church (C) , Gentilly Branch First Baptist Church (D) , First Baptist Church (E) , Church of Christ (F) , Saint Lukes Christian Methodist Episcopal Church (G) , Ebenezer Missionary Baptist Church (H) , Bell Baptist Church (I) . Display/hide their locations on the map
Cemeteries: (1) , Cherry Cemetery (2) , Westwood Drive Cemetery (3) , Pine Hill Cemetery (4) , Hill Cemetery (5) . Display/hide their locations on the map
Lakes and reservoirs: (A) , Greg Lake (B) , Kuderna Lake (C) , Lake Wilmore (D) , Lake Ogletree (E) , Yeagers Pond (F) , Websters Pond (G) , Richards Pond (H) . Display/hide their locations on the map
Creek: (A) . Display/hide its location on the map
Parks in Auburn include: (1) , Chewacla State Park (2) , Auburn University Historic District (3) , Old Main and Church Street Historic District (4) , Hutsell Track (5) , Donald E Davis Arboretum (6) , Bailey Park (7) , Jordan-Hare Stadium (8) , Fenton Little Park (9) . Display/hide their locations on the map
Tourist attractions: (1) , Leisure Time Campgrounds (Amusement & Theme Parks; 2670 South College Street) (2) , Family Fun Junction (Amusement & Theme Parks; 2490 South College Street) (3) , Aladdin's Castle (Amusement & Theme Parks; 1627 Opelika Road Suite 53) (4) , Maisel's Pro Shop (Amusement & Theme Parks; 719 Opelika Road) (5) , Surfside Water Park (Amusement & Theme Parks; 2780 South College Street) (6) , Himalayan Odyssey (Recreational Trips & Guides; 606 Lockwood Street) (7) . Display/hide their approximate locations on the map
Hotels: (1) , Hilton Garden Inn (2555 Hilton Garden Drive) (2) , Auburn University Hotel & Dixon Conference Center (241 South College Street) (3) , Jameson Inn Auburn (Sj) (1212 Mall Pkwy) (4) , Comfort Inn Auburn (2283 South College Street) (5) , Arbor Suites (1188 Commerce Drive) (6) , Jameson Inn of Auburn (1212 Mall Parkway) (7) , Crenshaw Guest House Bed & Fast (371 North College Street) (8) , Auburn Game Day Center (129 North Donahue Drive) (9) . Display/hide their approximate locations on the map
Court: (1) . Display/hide its approximate location on the map
Birthplace of: Paul McDonald (musician) - Idol participant, Robert Gibbs - Political consultant, Charles B. Glenn - Educator, DeMarcus Ware - 2005 NFL player (Dallas Cowboys, born : Jul 31, 1982), Frederick Chapman Robbins - Doctor, Marcus Washington - 2005 NFL player (Washington Redskins, born : Oct 17, 1977), John E. Pitts, Jr. - General, Rosemary Glyde - Composer, Brandon Carlisle - College football player (UAB Blazers), Brett Howell - College basketball player (Auburn Tigers).
Lee County has a predicted average indoor radon screening level between 2 and 4 pCi/L (pico curies per liter) - Moderate Potential Drinking water stations with addresses in Auburn and their reported violations in the past:
AUBURN WATER WORKS (Address: 1501 W. Samford Ave. Population served: 60,003, Surface water):
Past health violations:
MCL, Average - Between JAN-2014 and MAR-2014, Contaminant: TTHM. Follow-up actions: St Public Notif requested (MAR-14-2014), St Violation/Reminder Notice (MAR-14-2014), St Public Notif received (APR-21-2014), St Compliance achieved (JUN-03-2014)
Past monitoring violations:
Monitoring and Reporting (DBP) - Between AUG-20-2012 and NOV-18-2012, Contaminant: Total Haloacetic Acids (HAA5). Follow-up actions: St Public Notif requested (FEB-07-2013), St Violation/Reminder Notice (FEB-07-2013), St Compliance achieved (FEB-22-2013)
Monitoring and Reporting (DBP) - Between AUG-20-2012 and NOV-18-2012, Contaminant: TTHM. Follow-up actions: St Public Notif requested (FEB-07-2013), St Violation/Reminder Notice (FEB-07-2013), St Compliance achieved (FEB-22-2013)
52 regular monitoring violations
Address: 1501 West Samford Avenue Population served: 38,169, Purch surface water):
Past monitoring violations:
Monitoring and Reporting (DBP) - Between APR-2011 and JUN-2011, Contaminant: CARBON, TOTAL. Follow-up actions: St Intentional no-action (JUL-20-2011), St Compliance achieved (MAY-10-2012)
Average household size: This city:
2.2 peopleAlabama:
2.5 people
Percentage of family households: This city:
44.8%Whole state:
67.8%
Percentage of households with unmarried partners: This city:
3.6%Whole state:
4.7%
Likely homosexual households (counted as self-reported same-sex unmarried-partner households)
Lesbian couples: 0.2% of all households Gay men: 0.1% of all households
People in group quarters in Auburn in 2010:
3,583 people in college/university student housing
130 people in nursing facilities/skilled-nursing facilities
103 people in residential treatment centers for adults
11 people in group homes intended for adults
People in group quarters in Auburn in 2000:
3,523 people in college dormitories (includes college quarters off campus)
106 people in homes or halfway houses for drug/alcohol abuse
104 people in nursing homes
59 people in unknown juvenile institutions
49 people in other noninstitutional group quarters
14 people in local jails and other confinement facilities (including police lockups)
Arenas or stadiums:
Jordan-Hare Stadium. Capacity: 87,451. Auburn Tigers football.
Beard-Eaves-Memorial Coliseum. Auburn University.
Banks with most branches in Auburn (2011 data):
AuburnBank: Auburnbank, Kroger Branch, Bentcreek Branch, Auburn Wal-Mart Branch. Info updated 2006/11/03: Bank assets: $776.8 mil, Deposits: $620.9 mil, local headquarters , positive income , Commercial Lending Specialization, 10 total offices , Holding Company: Auburn National Bancorporation, Inc.
CharterBank: Auburn Branch at 1605 East University Drive, branch established on 2001/01/01; S College Lee Conty Branch at 1684 S College, branch established on 2006/06/30. Info updated 2011/09/12: Bank assets: $1,115.4 mil, Deposits: $869.2 mil, headquarters in West Point, GA, positive income , Commercial Lending Specialization, 23 total offices
Compass Bank: Village Plains Branch at 1433 Opelika Road, branch established on 1990/10/15; Auburn Main Branch at 101 South College Street, branch established on 1923/09/23. Info updated 2011/02/24: Bank assets: $63,107.0 mil, Deposits: $46,232.4 mil, headquarters in Birmingham, AL, negative income in the last year , Commercial Lending Specialization, 720 total offices , Holding Company: Banco Bilbao Vizcaya Argentaria, S.A.
PNC Bank, National Association: Village Mall Branch at 2085 East University Drive, branch established on 1973/07/30; Tiger Crossing Branch at 1605 South College Street, branch established on 1995/04/17. Info updated 2012/03/20: Bank assets: $263,309.6 mil, Deposits: $197,343.0 mil, headquarters in Wilmington, DE, positive income , Commercial Lending Specialization, 3085 total offices , Holding Company: Pnc Financial Services Group, Inc., The
Wells Fargo Bank, National Association: The Village Mall Branch at 2001 University Drive, branch established on 1978/02/16; Auburn Office at 307 North Gay Street, branch established on 1973/07/09. Info updated 2011/04/05: Bank assets: $1,161,490.0 mil, Deposits: $905,653.0 mil, headquarters in Sioux Falls, SD, positive income , 6395 total offices , Holding Company: Wells Fargo & Company
Branch Banking and Trust Company: East University Branch at 2124 East University Drive, branch established on 1996/07/01; Auburn Branch at 325 North Gay Street, branch established on 1987/05/23. Info updated 2010/03/29: Bank assets: $168,867.6 mil, Deposits: $127,549.5 mil, headquarters in Winston Salem, NC, positive income , Commercial Lending Specialization, 1793 total offices , Holding Company: Bb&T Corporation
Regions Bank: Moores Mill Road Office Branch at 2154 Moores Mill Road, branch established on 2005/01/05; Auburn Campus Branch at 200 North College Street, branch established on 1994/11/14. Info updated 2011/02/24: Bank assets: $123,368.2 mil, Deposits: $98,301.3 mil, headquarters in Birmingham, AL, positive income , Commercial Lending Specialization, 1778 total offices , Holding Company: Regions Financial Corporation
Frontier Bank: Auburn Branch at 1678 South College Street, branch established on 2001/05/18. Info updated 2012/03/01: Bank assets: $297.8 mil, Deposits: $253.4 mil, headquarters in Lagrange, GA, negative income in the last year , Commercial Lending Specialization, 10 total offices , Holding Company: Frontier National Corporation
Keystone Bank: at 2394 East University Drive, branch established on 2007/03/02. Info updated 2007/03/05: Bank assets: $198.5 mil, Deposits: $170.8 mil, local headquarters , positive income , Commercial Lending Specialization, 2 total offices
4 other banks with 4 local branches
For population 15 years and over in Auburn:
Never married: 54.1%Now married: 38.9%Separated: 1.0%Widowed: 2.3%Divorced: 3.9% For population 25 years and over in Auburn:
High school or higher: 98.4%Bachelor's degree or higher: 64.1%Graduate or professional degree: 32.1%Unemployed: 7.4%Mean travel time to work (commute): 19.1 minutes
Education Gini index (Inequality in education) Here:
10.0Alabama average:
11.5
Religion statistics for Auburn, AL (based on Lee County data)
Religion Adherents Congregations Evangelical Protestant 30,090 93 Mainline Protestant 15,250 30 Black Protestant 7,368 41 Catholic 2,872 2 Other 1,416 9 Orthodox - - None 83,251 -
Source: Clifford Grammich, Kirk Hadaway, Richard Houseal, Dale E.Jones, Alexei Krindatch, Richie Stanley and Richard H.Taylor. 2012. 2010 U.S.Religion Census: Religious Congregations & Membership Study. Association of Statisticians of American Religious Bodies. Jones, Dale E., et al. 2002. Congregations and Membership in the United States 2000. Nashville, TN: Glenmary Research Center. Graphs represent county-level data
Food Environment Statistics: Number of grocery stores : 14Lee County :
1.07 / 10,000 pop.Alabama :
1.89 / 10,000 pop.
Number of supercenters and club stores : 2This county :
0.15 / 10,000 pop.State :
0.20 / 10,000 pop.
Number of convenience stores (no gas) : 7Lee County :
0.54 / 10,000 pop.Alabama :
0.65 / 10,000 pop.
Number of convenience stores (with gas) : 69Lee County :
5.29 / 10,000 pop.State :
6.32 / 10,000 pop.
Number of full-service restaurants : 92Here :
7.05 / 10,000 pop.State :
5.75 / 10,000 pop.
Adult diabetes rate : This county :
9.4%Alabama :
11.8%
Adult obesity rate : Lee County :
30.2%Alabama :
31.7%
Low-income preschool obesity rate : This county :
9.2%State :
13.5%
Health and Nutrition: Healthy diet rate : Auburn:
51.3%Alabama:
49.0%
Average overall health of teeth and gums : People feeling badly about themselves : This city:
18.5%Alabama:
20.7%
People not drinking alcohol at all : This city:
9.9%Alabama:
11.0%
Average hours sleeping at night : Overweight people : This city:
27.3%State:
34.4%
General health condition : Average condition of hearing : Auburn:
84.3%Alabama:
79.3%
More about Health and Nutrition of Auburn, AL Residents
Local government employment and payroll (March 2022)
Function
Full-time employees
Monthly full-time payroll
Average yearly full-time wage
Part-time employees
Monthly part-time payroll
Police Protection - Officers
123 $599,623 $58,500 15 $9,673 Firefighters
108 $368,860 $40,984 28 $39,225 Parks and Recreation
60 $239,347 $47,869 118 $64,629 Solid Waste Management
49 $195,409 $47,855 1 $3,079 Streets and Highways
48 $235,427 $58,857 2 $1,152 Other Government Administration
34 $166,456 $58,749 3 $1,547 Financial Administration
28 $164,484 $70,493 1 $1,674 Sewerage
20 $98,098 $58,859 0 $0 Other and Unallocable
19 $87,136 $55,033 0 $0 Local Libraries
18 $84,872 $56,581 12 $16,479 Judicial and Legal
7 $42,580 $72,994 0 $0 Police - Other
4 $26,894 $80,682 0 $0 Housing and Community Development (Local)
3 $16,042 $64,168 0 $0 Health
2 $6,158 $36,948 0 $0
Totals for Government
523 $2,331,386 $53,493 180 $137,458
Auburn government finances - Expenditure in 2021 (per resident):
Construction - General - Other: $10,842,000 ($135.51)
Water Utilities: $7,925,000 ($99.06)Police Protection: $7,446,000 ($93.07)Regular Highways: $6,944,000 ($86.79)Sewerage: $2,851,000 ($35.63)Parks and Recreation: $894,000 ($11.17)Current Operations - Police Protection: $16,055,000 ($200.67)
General - Other: $13,950,000 ($174.36)Water Utilities: $8,290,000 ($103.62)Central Staff Services: $8,281,000 ($103.50)Local Fire Protection: $6,429,000 ($80.36)Parks and Recreation: $5,910,000 ($73.87)Sewerage: $5,049,000 ($63.11)Regular Highways: $4,869,000 ($60.86)Solid Waste Management: $4,501,000 ($56.26)Libraries: $2,406,000 ($30.07)Financial Administration: $2,089,000 ($26.11)Health - Other: $1,734,000 ($21.67)Protective Inspection and Regulation - Other: $1,310,000 ($16.37)Judicial and Legal Services: $828,000 ($10.35)Housing and Community Development: $495,000 ($6.19)General - Interest on Debt: $11,978,000 ($149.71)
Intergovernmental to Local - Other - General - Other: $1,683,000 ($21.04)
Other Capital Outlay - Local Fire Protection: $715,000 ($8.94)
Police Protection: $608,000 ($7.60)General - Other: $531,000 ($6.64)Water Utilities: $415,000 ($5.19)Judicial and Legal Services: $178,000 ($2.22)Housing and Community Development: $88,000 ($1.10)Water Utilities - Interest on Debt: $1,414,000 ($17.67)
Auburn government finances - Revenue in 2021 (per resident):
Charges - Sewerage: $13,161,000 ($164.50)
Other: $12,908,000 ($161.34)Solid Waste Management: $5,132,000 ($64.15)Parks and Recreation: $611,000 ($7.64)Federal Intergovernmental - Housing and Community Development: $534,000 ($6.67)
Local Intergovernmental - Other: $125,000 ($1.56)
Miscellaneous - Rents: $4,365,000 ($54.56)
Interest Earnings: $1,838,000 ($22.97)Special Assessments: $1,046,000 ($13.07)Fines and Forfeits: $962,000 ($12.02)Donations From Private Sources: $898,000 ($11.22)General Revenue - Other: $295,000 ($3.69)Sale of Property: $104,000 ($1.30)Revenue - Water Utilities: $12,893,000 ($161.15)
State Intergovernmental - Other: $5,160,000 ($64.50)
Health and Hospitals: $759,000 ($9.49)Highways: $510,000 ($6.37)Sewerage: $1,000 ($0.01)Tax - General Sales and Gross Receipts: $43,839,000 ($547.95)
Property: $32,476,000 ($405.92)Other License: $17,407,000 ($217.57)Occupation and Business License - Other: $13,830,000 ($172.86)Other Selective Sales: $2,944,000 ($36.80)Alcoholic Beverage Sales: $876,000 ($10.95)Motor Fuels Sales: $384,000 ($4.80)Tobacco Products Sales: $55,000 ($0.69)
Auburn government finances - Debt in 2021 (per resident):
Long Term Debt - Outstanding Unspecified Public Purpose: $354,147,000 ($4426.51)
Beginning Outstanding - Unspecified Public Purpose: $305,203,000 ($3814.75)Issue, Unspecified Public Purpose: $115,632,000 ($1445.29)Retired Unspecified Public Purpose: $66,688,000 ($833.54)Beginning Outstanding - Public Debt for Private Purpose: $975,000 ($12.19)Outstanding Nonguaranteed - Industrial Revenue: $900,000 ($11.25)Retired Nonguaranteed - Public Debt for Private Purpose: $75,000 ($0.94)Short Term Debt Outstanding - Beginning: $2,451,000 ($30.64)
End of Fiscal Year: $2,175,000 ($27.19)
Auburn government finances - Cash and Securities in 2021 (per resident):
Bond Funds - Cash and Securities: $17,995,000 ($224.92)
Other Funds - Cash and Securities: $113,249,000 ($1415.51)
Sinking Funds - Cash and Securities: $13,272,000 ($165.89)
9.27% of this county's 2021 resident taxpayers lived in other counties in 2020 ($62,614 average adjusted gross income )
Here:
9.27%Alabama average:
6.87%
0.04% of residents moved from foreign countries ($289 average AGI )Lee County:
0.04%Alabama average:
0.02%
Top counties from which taxpayers relocated into this county between 2020 and 2021:
8.53% of this county's 2020 resident taxpayers moved to other counties in 2021 ($56,480 average adjusted gross income )
Here:
8.53%Alabama average:
6.41%
0.04% of residents moved to foreign countries ($244 average AGI )Lee County:
0.04%Alabama average:
0.02%
Top counties to which taxpayers relocated from this county between 2020 and 2021:
Businesses in Auburn, AL
Name Count Name Count
AMF Bowling 1 Kroger 1 AT&T 1 La-Z-Boy 2 Academy Sports + Outdoors 1 Lane Bryant 1 Advance Auto Parts 1 Lane Furniture 2 Aeropostale 1 Little Caesars Pizza 1 American Eagle Outfitters 1 MasterBrand Cabinets 2 Ann Taylor 1 Maurices 1 Applebee's 1 McDonald's 3 Arby's 2 Microtel 1 AutoZone 1 New Balance 2 Bath & Body Works 1 Nike 12 Burger King 2 Nissan 1 CVS 3 OfficeMax 1 Caribou Coffee 1 Panera Bread 1 Chevrolet 1 Papa John's Pizza 1 Chick-Fil-A 3 Payless 1 Circle K 4 Penske 1 Coldwater Creek 1 Pier 1 Imports 1 Days Inn 1 Pizza Hut 1 Dennys 1 Plato's Closet 1 Domino's Pizza 1 Publix Super Markets 1 Econo Lodge 1 Quality 1 FedEx 10 Red Lobster 1 Foot Locker 1 Ruby Tuesday 1 Ford 1 SONIC Drive-In 2 GNC 1 Sam's Club 1 GameStop 1 Sears 2 Gap 1 Sleep Inn 1 Goodwill 2 Sprint Nextel 1 H&R Block 2 Starbucks 1 Hardee's 1 Subway 6 Hilton 2 T-Mobile 3 Holiday Inn 1 Taco Bell 2 Honda 1 Toyota 1 Hot Topic 1 U-Haul 3 Hyundai 1 UPS 8 IHOP 1 Vans 2 JCPenney 1 Victoria's Secret 1 JoS. A. Bank 1 Waffle House 4 Journeys 1 Walgreens 1 Justice 1 Walmart 1 KFC 1 Wet Seal 1 Kincaid 1 World Gym 1 Kmart 1
Strongest AM radio stations in Auburn:
WAUD (1230 AM; 1 kW; AUBURN, AL; Owner: TIGER COMMUNICATIONS, INC.)
WTLM (1520 AM; daytime; 5 kW; OPELIKA, AL; Owner: QANTUM OF AUBURN LICENSE COMPANY, LLC)
WANI (1400 AM; 1 kW; OPELIKA, AL; Owner: AUBURN NETWORK, INC.)
WZMG (910 AM; 1 kW; PEPPERELL, AL; Owner: QANTUM OF AUBURN LICENSE COMPANY, LLC)
WDAK (540 AM; 5 kW; COLUMBUS, GA; Owner: CLEAR CHANNEL BROADCASTING LICENSES, INC.)
WNSI (810 AM; 50 kW; JACKSONVILLE, AL; Owner: UNITED BROADCASTING NETWORK, INC.)
WMSP (740 AM; 10 kW; MONTGOMERY, AL; Owner: CUMULUS LICENSING CORP.)
WKNG (1060 AM; daytime; 50 kW; TALLAPOOSA, GA; Owner: WKNG, INC.)
WGST (640 AM; 50 kW; ATLANTA, GA; Owner: CITICASTERS LICENSES, L.P.)
WJOX (690 AM; 50 kW; BIRMINGHAM, AL; Owner: CITADEL BROADCASTING COMPANY)
WDJC (850 AM; 50 kW; BIRMINGHAM, AL; Owner: KIMTRON, INC.)
WGSE (720 AM; daytime; 8 kW; HOGANSVILLE, GA; Owner: CITICASTERS LICENSES, L.P.)
WRCG (1420 AM; 5 kW; COLUMBUS, GA; Owner: ABG GEORGIA, LLC)
Strongest FM radio stations in Auburn:
WEGL (91.1 FM; AUBURN, AL; Owner: BOARD OF TRUSTEES AUBURN UNIVERSITY)
WKKR (97.7 FM; AUBURN, AL; Owner: QANTUM OF AUBURN LICENSE COMPANY, LLC)
W212AP (90.3 FM; NOTASULGA, ETC., AL; Owner: FAMILY STATIONS, INC.)
WMXA (96.7 FM; OPELIKA, AL; Owner: QANTUM OF AUBURN LICENSE COMPANY, LLC)
WSTH-FM (106.1 FM; ALEXANDER CITY, AL; Owner: CLEAR CHANNEL BROADCASTING LICENSES, INC.)
WQNR (99.9 FM; TALLASSEE, AL; Owner: TIGER COMMUNICATIONS, INC.)
WCGQ (107.3 FM; COLUMBUS, GA; Owner: ABG GEORGIA, LLC)
WLWI-FM (92.3 FM; MONTGOMERY, AL; Owner: CUMULUS LICENSING CORP.)
WVFJ-FM (93.3 FM; MANCHESTER, GA; Owner: PROVIDENT BROADCASTING COMPANY)
WQLD (104.3 FM; LUVERNE, AL; Owner: CAPSTAR TX LIMITED PARTNERSHIP)
WZHT (105.7 FM; TROY, AL; Owner: CAPSTAR TX LIMITED PARTNERSHIP)
WTGZ (95.9 FM; TUSKEGEE, AL; Owner: NEW WORLD COMMUNICATIONS, INC.)
WBAM-FM (98.9 FM; MONTGOMERY, AL; Owner: DEEP SOUTH BROADCASTING COMPANY)
WHHY-FM (101.9 FM; MONTGOMERY, AL; Owner: CUMULUS LICENSING CORP.)
WZLM (97.3 FM; DADEVILLE, AL; Owner: GREAT SOUTH RFDC, LLC)
WRLD-FM (95.3 FM; VALLEY, AL; Owner: ABG GEORGIA, LLC)
WBFA (101.3 FM; SMITHS, AL; Owner: CLEAR CHANNEL BROADCASTING LICENSES, INC.)
WELL-FM (88.7 FM; DADEVILLE, AL; Owner: TIGER COMMUNICATIONS EDUCATIONAL FOUNDATION, INC.)
TV broadcast stations around Auburn:
W18CD (Channel 18; OPELIKA, AL; Owner: TRINITY BROADCASTING NETWORK)
WSWS-TV (Channel 66; OPELIKA, AL; Owner: PAPPAS TELECASTING OF OPELIKA)
WTVM (Channel 9; COLUMBUS, GA; Owner: RAYCOM AMERICA, INC.)
WRBL (Channel 3; COLUMBUS, GA; Owner: MEDIA GENERAL BROADCASTING OF SO. CAROLINA HOLDINGS, INC.)
WLTZ (Channel 38; COLUMBUS, GA; Owner: LEWIS BROADCASTING CORPORATION)
WNCF (Channel 32; MONTGOMERY, AL; Owner: CHANNEL 32 MONTGOMERY LLC)
WXTX (Channel 54; COLUMBUS, GA; Owner: FISHER BROADCASTING - GEORGIA, L.L.C.)
WCGT-LP (Channel 16; COLUMBUS, GA; Owner: COLUMBUS TELEVISION, INC.)
WRJM-TV (Channel 67; TROY, AL; Owner: JOSIE PARK BROADCASTING, INC.)
WSFA (Channel 12; MONTGOMERY, AL; Owner: LIBCO, INC.)
WMCF-TV (Channel 45; MONTGOMERY, AL; Owner: TRINITY BROADCASTING NETWORK)
W55CR (Channel 55; ATLANTA, GA; Owner: WORD OF GOD FELLOWSHIP, INC.)
National Bridge Inventory (NBI) Statistics 69 Number of bridges682ft / 208m Total length $101,171,000 Total costs726,459 Total average daily traffic135,403 Total average daily truck traffic
New bridges - historical statistics
2 1930-1939 4 1940-1949 6 1950-1959 17 1960-1969 6 1970-1979 4 1980-1989 4 1990-1999 11 2000-2009 13 2010-2019 2 2020-2022
See full National Bridge Inventory statistics for Auburn, AL
Home Mortgage Disclosure Act Aggregated Statistics For Year 2009(Based on 5 full and 8 partial tracts) A) FHA, FSA/RHS & VA B) Conventional C) Refinancings D) Home Improvement Loans E) Loans on Dwellings For 5+ Families F) Non-occupant Loans on G) Loans On Manufactured Number Average Value Number Average Value Number Average Value Number Average Value Number Average Value Number Average Value Number Average Value
LOANS ORIGINATED 124 $167,236 294 $164,107 638 $193,867 55 $123,634 5 $2,126,614 190 $152,286 30 $27,981 APPLICATIONS APPROVED, NOT ACCEPTED 3 $144,880 7 $186,533 33 $198,499 0 $0 0 $0 8 $123,891 1 $41,580 APPLICATIONS DENIED 12 $162,666 40 $136,798 161 $203,098 4 $42,188 2 $9,321,950 30 $133,213 8 $22,931 APPLICATIONS WITHDRAWN 14 $184,015 35 $172,956 149 $204,994 4 $121,460 0 $0 28 $142,025 1 $23,550 FILES CLOSED FOR INCOMPLETENESS 4 $184,610 6 $208,382 23 $196,621 0 $0 0 $0 5 $157,518 1 $28,240
Aggregated Statistics For Year 2008(Based on 5 full and 8 partial tracts) A) FHA, FSA/RHS & VA B) Conventional C) Refinancings D) Home Improvement Loans E) Loans on Dwellings For 5+ Families F) Non-occupant Loans on G) Loans On Manufactured Number Average Value Number Average Value Number Average Value Number Average Value Number Average Value Number Average Value Number Average Value
LOANS ORIGINATED 87 $177,102 498 $162,722 405 $187,080 50 $92,370 11 $1,739,391 358 $147,679 37 $31,776 APPLICATIONS APPROVED, NOT ACCEPTED 5 $137,204 34 $192,603 32 $150,357 3 $79,140 0 $0 18 $148,143 8 $40,339 APPLICATIONS DENIED 10 $159,509 59 $136,331 106 $160,786 18 $78,414 0 $0 48 $126,128 11 $68,893 APPLICATIONS WITHDRAWN 9 $179,854 52 $183,727 78 $208,139 3 $129,100 1 $399,000 43 $147,736 1 $57,940 FILES CLOSED FOR INCOMPLETENESS 2 $135,105 7 $125,186 20 $197,797 2 $157,920 0 $0 4 $129,393 0 $0
Aggregated Statistics For Year 2007(Based on 5 full and 8 partial tracts) A) FHA, FSA/RHS & VA B) Conventional C) Refinancings D) Home Improvement Loans E) Loans on Dwellings For 5+ Families F) Non-occupant Loans on G) Loans On Manufactured Number Average Value Number Average Value Number Average Value Number Average Value Number Average Value Number Average Value Number Average Value
LOANS ORIGINATED 38 $174,340 977 $146,426 367 $166,745 51 $58,729 14 $2,360,930 554 $128,564 37 $17,876 APPLICATIONS APPROVED, NOT ACCEPTED 0 $0 92 $112,855 38 $183,037 8 $33,578 1 $388,990 47 $109,559 5 $36,508 APPLICATIONS DENIED 3 $120,893 93 $140,898 137 $169,444 24 $54,941 1 $621,010 39 $130,798 25 $30,088 APPLICATIONS WITHDRAWN 3 $159,500 98 $138,847 70 $188,455 11 $134,265 1 $82,250 48 $120,273 3 $17,027 FILES CLOSED FOR INCOMPLETENESS 1 $150,620 23 $159,757 24 $177,962 2 $258,655 0 $0 17 $125,433 0 $0
Aggregated Statistics For Year 2006(Based on 5 full and 8 partial tracts) A) FHA, FSA/RHS & VA B) Conventional C) Refinancings D) Home Improvement Loans E) Loans on Dwellings For 5+ Families F) Non-occupant Loans on G) Loans On Manufactured Number Average Value Number Average Value Number Average Value Number Average Value Number Average Value Number Average Value Number Average Value
LOANS ORIGINATED 31 $150,946 980 $127,347 352 $140,013 53 $55,084 15 $2,601,099 496 $107,757 55 $24,825 APPLICATIONS APPROVED, NOT ACCEPTED 1 $12,960 64 $131,114 43 $150,017 3 $37,823 0 $0 25 $104,056 8 $33,274 APPLICATIONS DENIED 2 $144,110 114 $108,586 122 $119,126 24 $29,775 0 $0 41 $89,890 21 $29,279 APPLICATIONS WITHDRAWN 5 $157,186 122 $122,255 101 $156,920 11 $92,907 0 $0 60 $108,269 1 $43,850 FILES CLOSED FOR INCOMPLETENESS 1 $81,840 29 $146,872 35 $173,410 1 $178,200 0 $0 15 $121,659 0 $0
Aggregated Statistics For Year 2005(Based on 5 full and 8 partial tracts) A) FHA, FSA/RHS & VA B) Conventional C) Refinancings D) Home Improvement Loans E) Loans on Dwellings For 5+ Families F) Non-occupant Loans on G) Loans On Manufactured Number Average Value Number Average Value Number Average Value Number Average Value Number Average Value Number Average Value Number Average Value
LOANS ORIGINATED 29 $140,691 875 $137,783 364 $141,711 39 $55,375 12 $3,209,978 413 $109,445 37 $26,224 APPLICATIONS APPROVED, NOT ACCEPTED 0 $0 65 $119,435 49 $118,880 6 $101,042 0 $0 30 $103,172 7 $49,229 APPLICATIONS DENIED 2 $96,055 105 $114,613 107 $122,300 26 $46,616 0 $0 42 $92,948 26 $51,443 APPLICATIONS WITHDRAWN 4 $102,140 112 $121,396 102 $152,509 16 $120,787 1 $6,982,500 44 $103,351 4 $78,280 FILES CLOSED FOR INCOMPLETENESS 0 $0 21 $104,606 19 $126,686 2 $67,095 0 $0 11 $83,506 0 $0
Aggregated Statistics For Year 2004(Based on 5 full and 8 partial tracts) A) FHA, FSA/RHS & VA B) Conventional C) Refinancings D) Home Improvement Loans E) Loans on Dwellings For 5+ Families F) Non-occupant Loans on G) Loans On Manufactured Number Average Value Number Average Value Number Average Value Number Average Value Number Average Value Number Average Value Number Average Value
LOANS ORIGINATED 22 $136,518 754 $129,342 388 $129,955 38 $38,544 10 $2,441,883 334 $107,333 45 $23,824 APPLICATIONS APPROVED, NOT ACCEPTED 3 $128,020 62 $123,854 50 $118,135 4 $54,658 0 $0 16 $101,584 9 $44,260 APPLICATIONS DENIED 1 $125,280 70 $90,967 134 $112,379 25 $42,856 0 $0 30 $80,575 35 $36,930 APPLICATIONS WITHDRAWN 3 $112,660 73 $140,635 95 $146,241 9 $54,366 0 $0 16 $99,631 3 $18,297 FILES CLOSED FOR INCOMPLETENESS 0 $0 10 $113,778 49 $141,021 2 $48,860 0 $0 6 $95,752 1 $66,100
Aggregated Statistics For Year 2003(Based on 5 full and 8 partial tracts) A) FHA, FSA/RHS & VA B) Conventional C) Refinancings D) Home Improvement Loans E) Loans on Dwellings For 5+ Families F) Non-occupant Loans on Number Average Value Number Average Value Number Average Value Number Average Value Number Average Value Number Average Value
LOANS ORIGINATED 74 $124,294 669 $119,383 959 $125,730 25 $38,983 14 $1,921,905 357 $95,333 APPLICATIONS APPROVED, NOT ACCEPTED 4 $128,805 45 $127,837 84 $115,271 4 $24,305 0 $0 27 $109,625 APPLICATIONS DENIED 4 $94,600 69 $77,965 134 $108,424 19 $41,545 0 $0 32 $91,272 APPLICATIONS WITHDRAWN 2 $132,220 52 $115,635 110 $134,307 4 $68,588 0 $0 34 $99,204 FILES CLOSED FOR INCOMPLETENESS 1 $68,670 9 $125,846 20 $118,358 2 $98,265 0 $0 7 $116,796
Aggregated Statistics For Year 2002(Based on 5 full and 6 partial tracts) A) FHA, FSA/RHS & VA B) Conventional C) Refinancings D) Home Improvement Loans E) Loans on Dwellings For 5+ Families F) Non-occupant Loans on Number Average Value Number Average Value Number Average Value Number Average Value Number Average Value Number Average Value
LOANS ORIGINATED 74 $115,610 477 $114,862 641 $120,926 25 $25,622 8 $662,290 231 $94,153 APPLICATIONS APPROVED, NOT ACCEPTED 3 $83,463 30 $91,043 56 $117,713 3 $41,837 0 $0 13 $77,674 APPLICATIONS DENIED 9 $99,221 74 $64,096 94 $122,618 12 $15,643 0 $0 23 $116,164 APPLICATIONS WITHDRAWN 6 $106,363 35 $109,005 70 $129,607 5 $58,856 0 $0 17 $88,332 FILES CLOSED FOR INCOMPLETENESS 0 $0 5 $140,148 18 $132,138 0 $0 0 $0 2 $139,160
Aggregated Statistics For Year 2001(Based on 5 full and 6 partial tracts) A) FHA, FSA/RHS & VA B) Conventional C) Refinancings D) Home Improvement Loans E) Loans on Dwellings For 5+ Families F) Non-occupant Loans on Number Average Value Number Average Value Number Average Value Number Average Value Number Average Value Number Average Value
LOANS ORIGINATED 57 $97,312 480 $105,312 469 $117,244 33 $22,998 13 $712,831 184 $88,488 APPLICATIONS APPROVED, NOT ACCEPTED 1 $65,830 39 $75,895 34 $84,894 5 $21,812 0 $0 4 $94,218 APPLICATIONS DENIED 8 $123,682 95 $56,744 74 $110,814 13 $24,886 0 $0 17 $101,164 APPLICATIONS WITHDRAWN 5 $110,602 32 $111,583 73 $105,778 3 $49,573 0 $0 9 $90,716 FILES CLOSED FOR INCOMPLETENESS 0 $0 7 $108,243 15 $116,003 0 $0 0 $0 4 $84,210
Aggregated Statistics For Year 2000(Based on 5 full and 6 partial tracts) A) FHA, FSA/RHS & VA B) Conventional C) Refinancings D) Home Improvement Loans E) Loans on Dwellings For 5+ Families F) Non-occupant Loans on Number Average Value Number Average Value Number Average Value Number Average Value Number Average Value Number Average Value
LOANS ORIGINATED 30 $96,435 389 $107,471 120 $92,533 30 $39,913 9 $4,695,894 107 $79,498 APPLICATIONS APPROVED, NOT ACCEPTED 7 $41,989 34 $57,121 18 $65,122 6 $24,085 0 $0 9 $31,460 APPLICATIONS DENIED 6 $75,785 153 $52,177 30 $93,768 10 $20,135 0 $0 9 $48,760 APPLICATIONS WITHDRAWN 6 $113,447 29 $101,710 21 $92,684 2 $12,725 0 $0 9 $70,289 FILES CLOSED FOR INCOMPLETENESS 1 $130,210 8 $145,866 8 $102,864 0 $0 0 $0 2 $125,740
Detailed mortgage data for all 12 tracts in Auburn, AL
Private Mortgage Insurance Companies Aggregated Statistics For Year 2009(Based on 4 full and 8 partial tracts) A) Conventional B) Refinancings C) Non-occupant Loans on Number Average Value Number Average Value Number Average Value
LOANS ORIGINATED 39 $207,854 24 $205,002 4 $149,955 APPLICATIONS APPROVED, NOT ACCEPTED 9 $183,930 9 $213,163 0 $0 APPLICATIONS DENIED 5 $206,326 4 $269,485 1 $87,450 APPLICATIONS WITHDRAWN 1 $350,870 3 $355,507 0 $0 FILES CLOSED FOR INCOMPLETENESS 6 $153,998 2 $218,650 4 $156,008
Aggregated Statistics For Year 2008(Based on 5 full and 8 partial tracts) A) Conventional B) Refinancings C) Non-occupant Loans on Number Average Value Number Average Value Number Average Value
LOANS ORIGINATED 136 $179,306 35 $200,368 61 $147,286 APPLICATIONS APPROVED, NOT ACCEPTED 23 $182,110 16 $199,758 15 $152,969 APPLICATIONS DENIED 17 $156,697 3 $238,503 15 $152,409 APPLICATIONS WITHDRAWN 7 $165,646 1 $155,880 4 $98,430 FILES CLOSED FOR INCOMPLETENESS 4 $212,722 1 $401,830 3 $183,240
Aggregated Statistics For Year 2007(Based on 5 full and 8 partial tracts) A) Conventional B) Refinancings C) Non-occupant Loans on Number Average Value Number Average Value Number Average Value
LOANS ORIGINATED 135 $161,311 21 $211,895 59 $137,881 APPLICATIONS APPROVED, NOT ACCEPTED 18 $144,521 5 $261,456 11 $139,695 APPLICATIONS DENIED 4 $172,648 0 $0 2 $169,295 APPLICATIONS WITHDRAWN 10 $234,874 1 $279,330 4 $146,935 FILES CLOSED FOR INCOMPLETENESS 1 $91,200 0 $0 1 $75,140
Aggregated Statistics For Year 2006(Based on 5 full and 8 partial tracts) A) Conventional B) Refinancings C) Non-occupant Loans on Number Average Value Number Average Value Number Average Value
LOANS ORIGINATED 124 $156,626 21 $177,070 48 $133,429 APPLICATIONS APPROVED, NOT ACCEPTED 14 $162,874 8 $161,132 10 $136,362 APPLICATIONS DENIED 3 $237,653 0 $0 2 $242,815 APPLICATIONS WITHDRAWN 4 $170,962 2 $214,045 2 $170,285 FILES CLOSED FOR INCOMPLETENESS 1 $104,660 0 $0 0 $0
Aggregated Statistics For Year 2005(Based on 5 full and 8 partial tracts) A) Conventional B) Refinancings C) Non-occupant Loans on Number Average Value Number Average Value Number Average Value
LOANS ORIGINATED 125 $138,257 34 $155,632 68 $107,333 APPLICATIONS APPROVED, NOT ACCEPTED 15 $153,118 5 $141,446 6 $79,098 APPLICATIONS DENIED 2 $92,480 0 $0 2 $65,540 APPLICATIONS WITHDRAWN 12 $132,491 5 $144,106 9 $104,837 FILES CLOSED FOR INCOMPLETENESS 1 $155,670 0 $0 0 $0
Aggregated Statistics For Year 2004(Based on 5 full and 8 partial tracts) A) Conventional B) Refinancings C) Non-occupant Loans on Number Average Value Number Average Value Number Average Value
LOANS ORIGINATED 143 $127,947 35 $132,160 70 $101,557 APPLICATIONS APPROVED, NOT ACCEPTED 20 $112,760 8 $148,891 10 $97,898 APPLICATIONS DENIED 2 $188,305 0 $0 2 $123,745 APPLICATIONS WITHDRAWN 14 $134,088 5 $146,492 9 $111,713 FILES CLOSED FOR INCOMPLETENESS 0 $0 0 $0 0 $0
Aggregated Statistics For Year 2003(Based on 5 full and 8 partial tracts) A) Conventional B) Refinancings C) Non-occupant Loans on Number Average Value Number Average Value Number Average Value
LOANS ORIGINATED 165 $129,345 97 $138,744 71 $108,131 APPLICATIONS APPROVED, NOT ACCEPTED 16 $131,481 19 $154,105 11 $99,388 APPLICATIONS DENIED 2 $113,150 2 $56,850 1 $32,000 APPLICATIONS WITHDRAWN 8 $94,119 9 $142,314 6 $92,558 FILES CLOSED FOR INCOMPLETENESS 0 $0 0 $0 0 $0
Aggregated Statistics For Year 2002(Based on 5 full and 6 partial tracts) A) Conventional B) Refinancings C) Non-occupant Loans on Number Average Value Number Average Value Number Average Value
LOANS ORIGINATED 130 $128,926 61 $137,065 38 $101,580 APPLICATIONS APPROVED, NOT ACCEPTED 7 $141,897 5 $164,190 0 $0 APPLICATIONS DENIED 0 $0 1 $156,880 0 $0 APPLICATIONS WITHDRAWN 5 $164,324 0 $0 1 $56,860 FILES CLOSED FOR INCOMPLETENESS 0 $0 1 $67,370 0 $0
Aggregated Statistics For Year 2001(Based on 4 full and 6 partial tracts) A) Conventional B) Refinancings C) Non-occupant Loans on Number Average Value Number Average Value Number Average Value
LOANS ORIGINATED 110 $125,578 45 $124,931 18 $98,114 APPLICATIONS APPROVED, NOT ACCEPTED 10 $116,281 4 $129,590 3 $66,630 APPLICATIONS DENIED 0 $0 1 $79,840 1 $79,740 APPLICATIONS WITHDRAWN 2 $114,980 1 $60,250 0 $0 FILES CLOSED FOR INCOMPLETENESS 0 $0 0 $0 0 $0
Aggregated Statistics For Year 2000(Based on 4 full and 6 partial tracts) A) Conventional B) Refinancings C) Non-occupant Loans on Number Average Value Number Average Value Number Average Value
LOANS ORIGINATED 96 $123,359 5 $98,560 11 $96,135 APPLICATIONS APPROVED, NOT ACCEPTED 4 $146,072 4 $182,732 1 $127,270 APPLICATIONS DENIED 1 $89,780 2 $68,520 0 $0 APPLICATIONS WITHDRAWN 2 $120,300 0 $0 0 $0 FILES CLOSED FOR INCOMPLETENESS 1 $149,520 0 $0 0 $0
Fire-safe hotels and motels in Auburn, Alabama:
Auburn University Hotel & Conference, 241 S College St, Auburn, Alabama 36830 Phone: (800) 228-2876, Fax: (334) 826-8746
Days Inn & Suites, 333 S College St, Auburn, Alabama 36830 Phone: (334) 887-3462, Fax: (334) 887-5564
Quality Inn, 1212 Mall Pkwy, Auburn, Alabama 36831 Phone: (334) 502-5020, Fax: (334) 502-5021
Econolodge, 2145 S College St, Auburn, Alabama 36830 Phone: (334) 826-8900
Quality Inn, 2283 S College St, Auburn, Alabama 36832 Phone: (334) 821-6699, Fax: (334) 821-1192
Hilton Garden Inn, 2555 Hilton Garden Dr, Auburn, Alabama 36830 Phone: (334) 502-3500, Fax: (334) 502-3572
Auburn Hampton Inn, 2430 S College St, Auburn, Alabama 36832 Phone: (334) 821-4111, Fax: (334) 821-2146
Microtel Inn & Suites, 2174 S College St, Auburn, Alabama 36832 Phone: (334) 826-1444, Fax: (334) 826-5456
7 other hotels and motels
All 15 fire-safe hotels and motels in Auburn, Alabama
Most common first names in Auburn, AL among deceased individuals Name Count Lived (average)
Mary 185 79.4 years John 143 72.6 years James 138 72.6 years William 113 75.7 years Willie 103 72.5 years Robert 94 74.2 years Annie 90 79.8 years George 69 74.3 years Margaret 54 81.1 years Charles 48 72.5 years
Most common last names in Auburn, AL among deceased individuals Last name Count Lived (average)
Williams 74 73.4 years Jones 71 77.7 years Smith 68 73.7 years Brown 64 74.1 years Dowdell 59 72.2 years Jackson 46 78.3 years Moore 44 75.7 years Baker 42 70.5 years Thomas 42 76.3 years Hill 39 76.2 years
Auburn compared to Alabama state average:
Median house value above state average. Unemployed percentage below state average. Median age significantly below state average. Foreign-born population percentage significantly above state average. Renting percentage above state average. Length of stay since moving in below state average. House age below state average. Number of college students significantly above state average. Percentage of population with a bachelor's degree or higher significantly above state average.
#1 on the list of "Top 101 cities with the largest household incomes disparities (population 50,000+)"
#1 on the list of "Top 101 larger cities with the highest increase in household income from 2000 (population 50,000+)"
#4 on the list of "Top 101 cities with largest percentage of females in industries: educational services (population 50,000+)"
#6 on the list of "Top 100 cities with highest percentage of college students (pop. 50,000+)"
#8 on the list of "Top 101 cities with the smallest percentage of likely homosexual households (counted as self-reported same-sex unmarried-partner households) (population 50,000+)"
#9 on the list of "Top 101 cities with largest percentage of males in occupations: education, training, and library occupations (population 50,000+)"
#10 on the list of "Top 101 cities with largest percentage of females in occupations: education, training, and library occupations (population 50,000+)"
#10 on the list of "Top 101 cities with largest percentage of males in industries: educational services (population 50,000+)"
#11 on the list of "Top 100 cities with youngest residents (pop. 50,000+)"
#15 on the list of "Top 101 cities with the most people having Doctorate degrees (population 50,000+)"
#15 on the list of "Top 101 cities with largest percentage of males in industries: accommodation and food services (population 50,000+)"
#16 on the list of "Top 101 cities with the largest house values disparities (population 50,000+)"
#19 on the list of "Top 101 cities with largest percentage of females in occupations: life, physical, and social science occupations (population 50,000+)"
#20 on the list of "Top 101 cities with the most people having Master's or Doctorate degrees (population 50,000+)"
#21 on the list of "Top 101 cities where the highest percentage of females (15+ years) which never married (with at least 10,000 females in this group)"
#23 on the list of "Top 101 cities where the highest percentage of males (15+ years) which never married (with at least 10,000 males in this group)"
#32 on the list of "Top 101 cities with the smallest percentage of unmarried partner households (population 50,000+)"
#33 on the list of "Top 100 cities with strongest arts, entertainment, recreation, accommodation and food services industries (pop. 50,000+)"
#41 on the list of "Top 101 cities with the lowest number of arson incidents per 100,000 residents (population 50,000+)"
#41 on the list of "Top 100 best educated cities (highest percentage of bachelor degree holding residents) (pop. 50,000+)"
#58 on the list of "Top 101 counties with the largest number of people moving in compared to moving out (pop. 50,000+)"
#80 on the list of "Top 101 counties with the most Black Protestant congregations"
#82 on the list of "Top 101 counties with the highest percentage of residents relocating from other counties between 2010 and 2011 (pop. 50,000+)"
#88 on the list of "Top 101 counties with the smallest number of people without health insurance coverage in 2000 (pop. 50,000+)"
Top Patent Applicants
Jean-Pierre Giraud (19)
Jonathan R. Freedman (19)
Christopher Weikart (18)
Rodrigo Rodriguez-Kabana (15)
John Ferguson (13)
Hongyun Yang (9)
Robert H. Walker (8)
Clayton Yates (7)
Ahmad Taha (6)
Bernhard Kaltenboeck (6)
Total of 448 patent applications in 2008-2024.

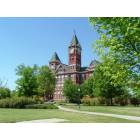

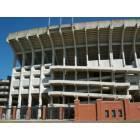
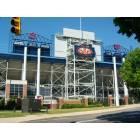
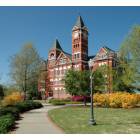
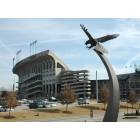

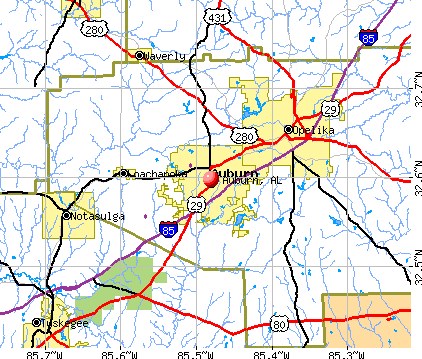


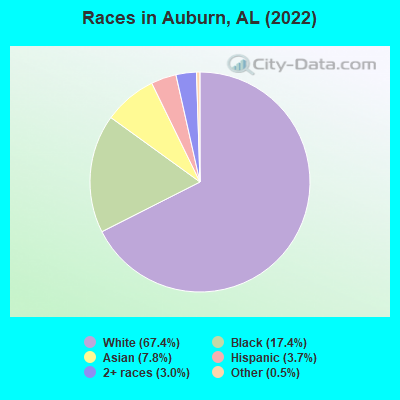
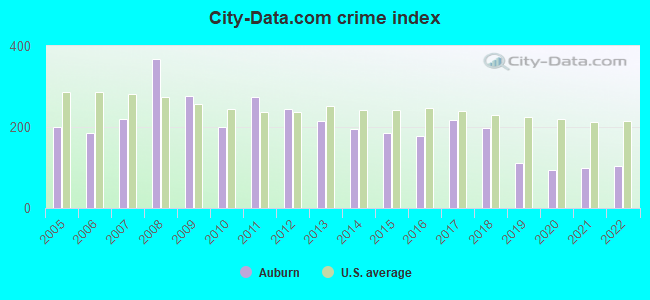
 Recent articles from our blog. Our writers, many of them Ph.D. graduates or candidates, create easy-to-read articles on a wide variety of topics.

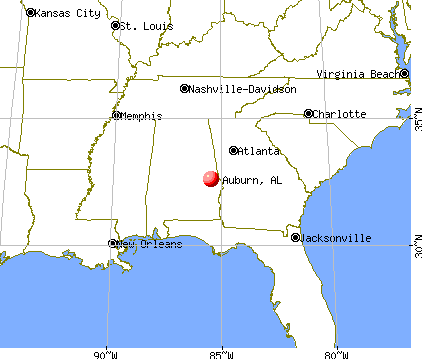
 (32.4 miles
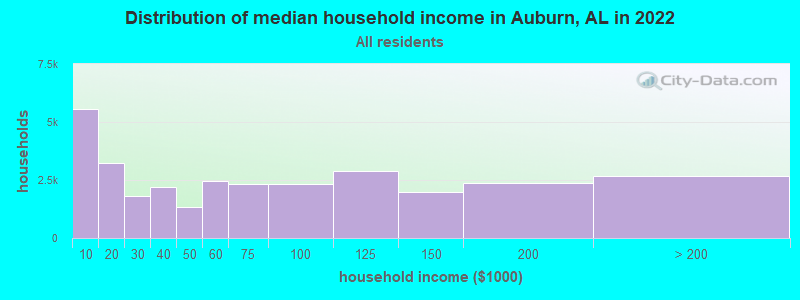
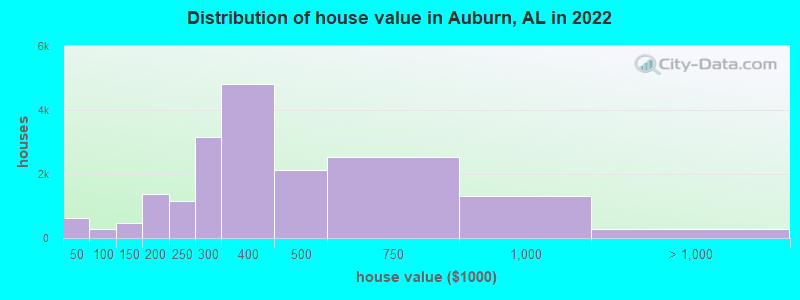
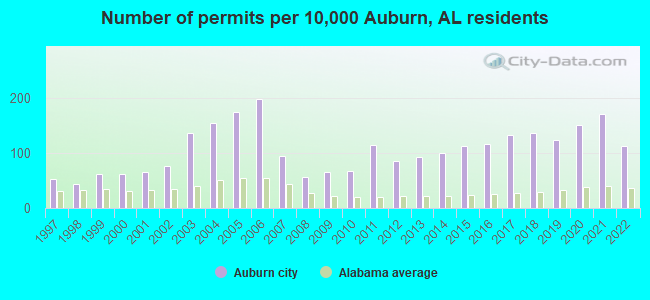
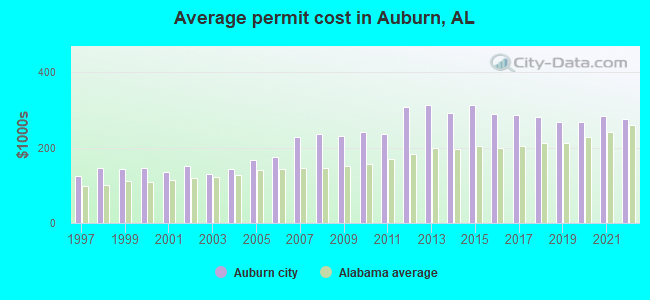
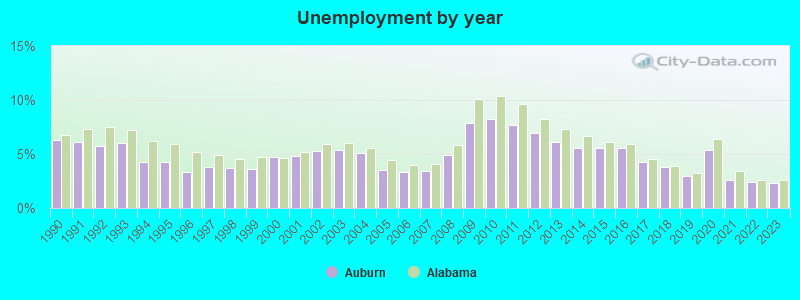
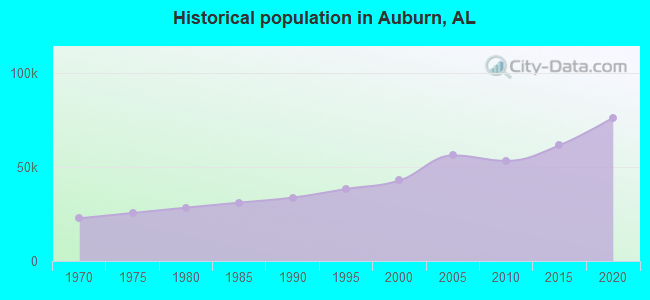
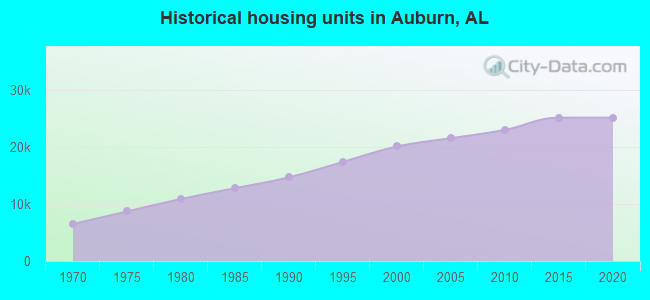
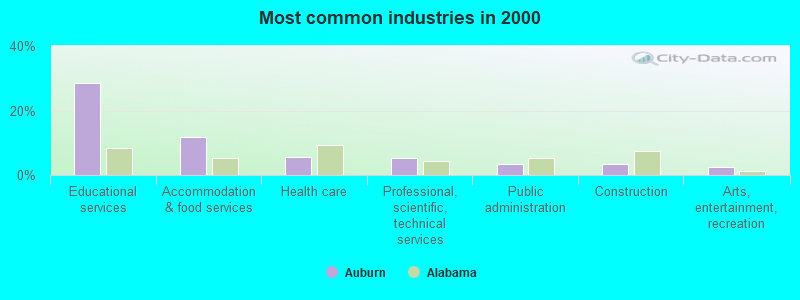
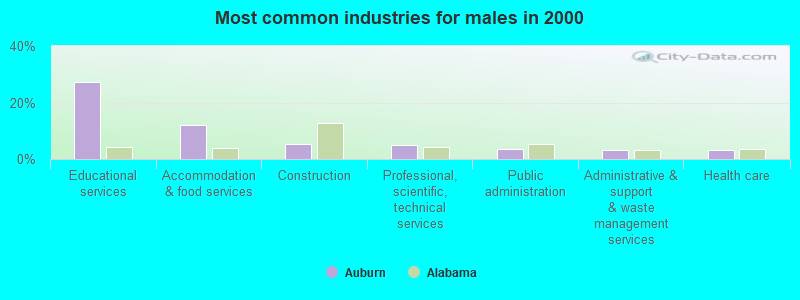
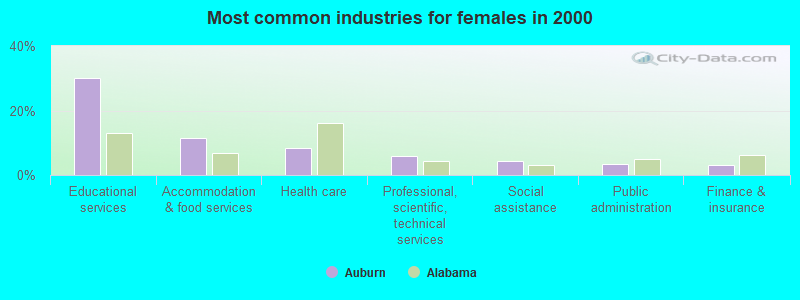
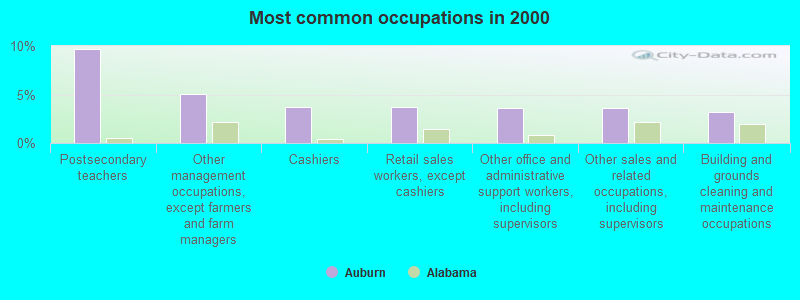
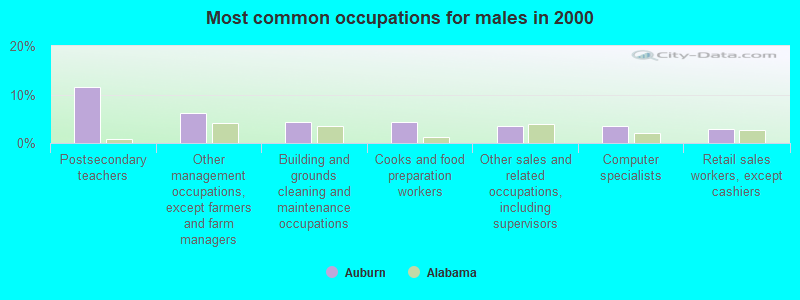
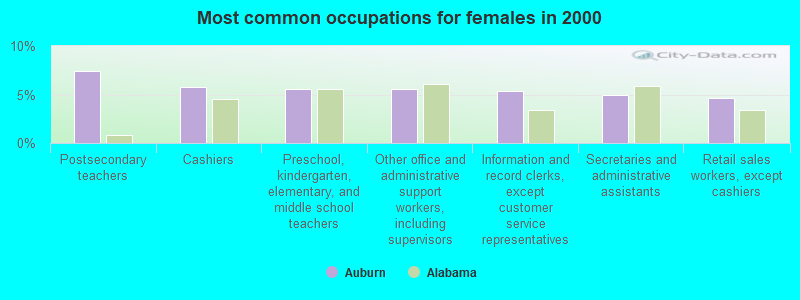
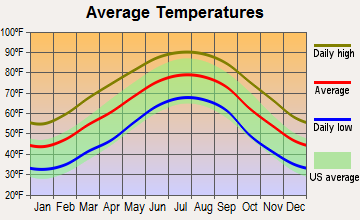
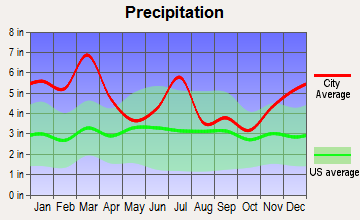
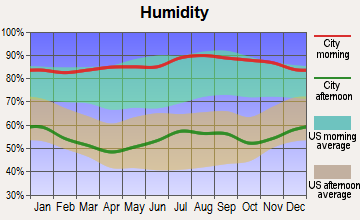
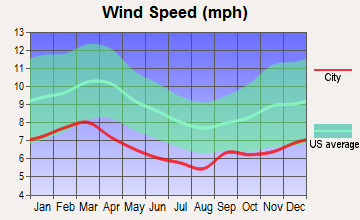
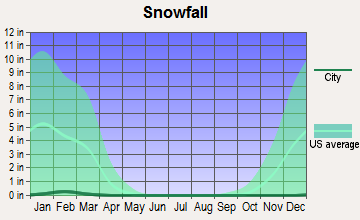
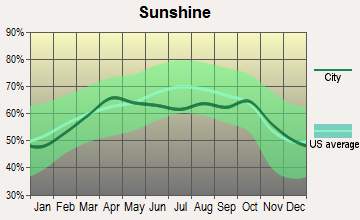
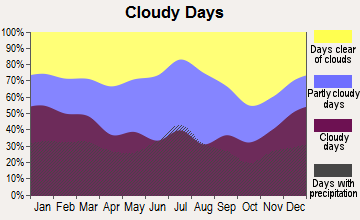
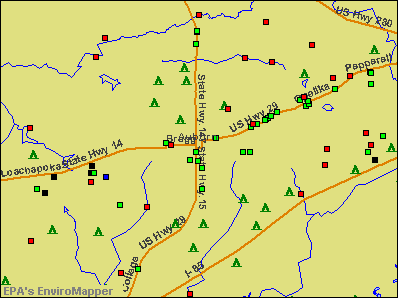

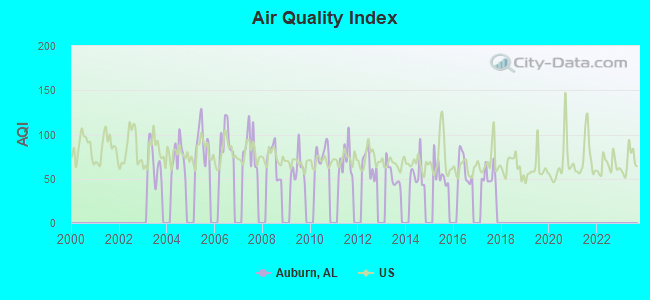
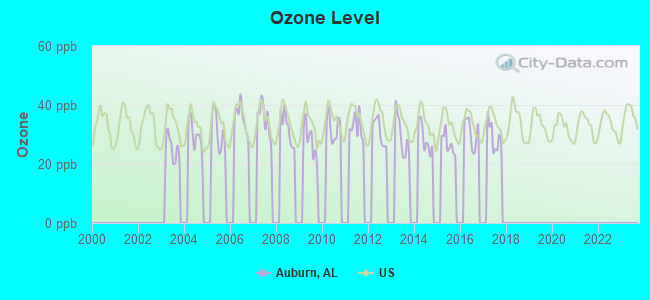
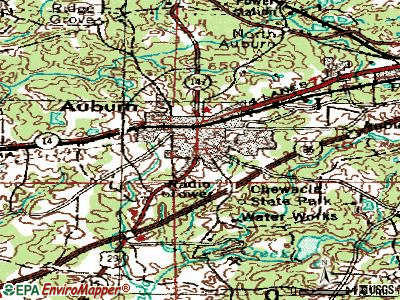
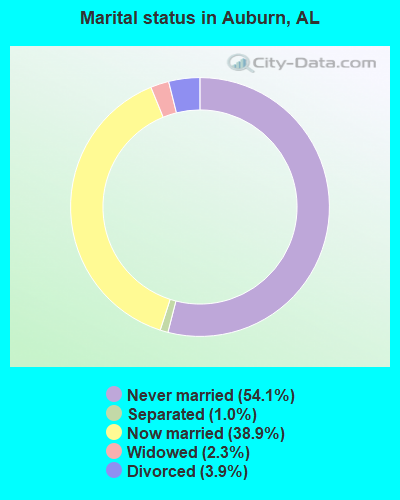
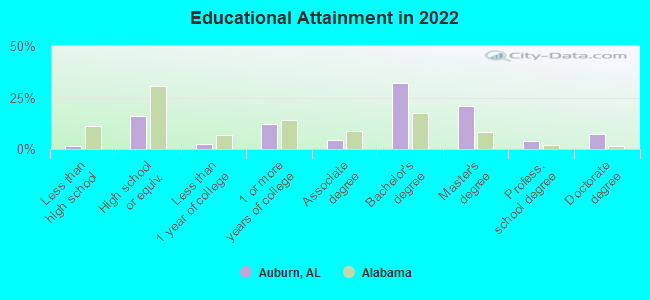
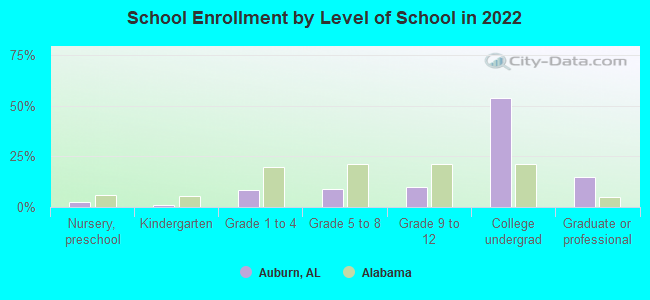
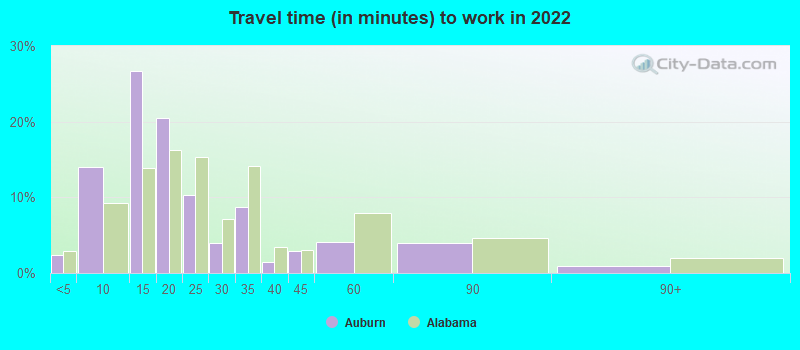
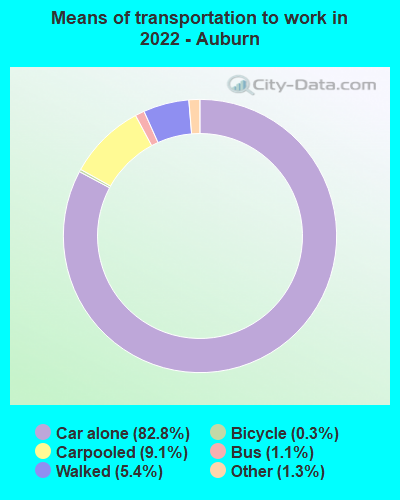
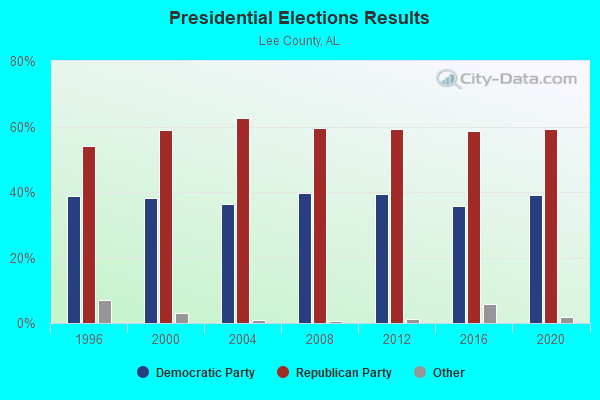
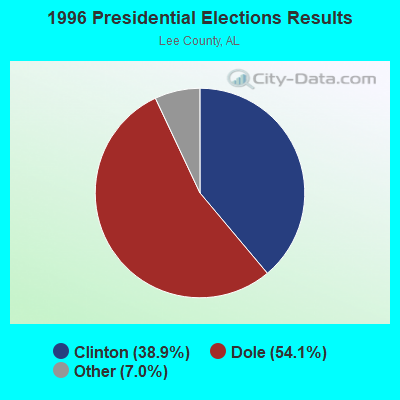
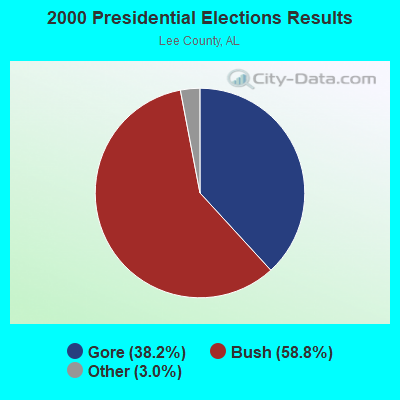
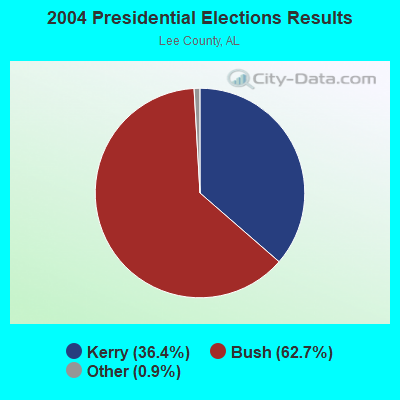
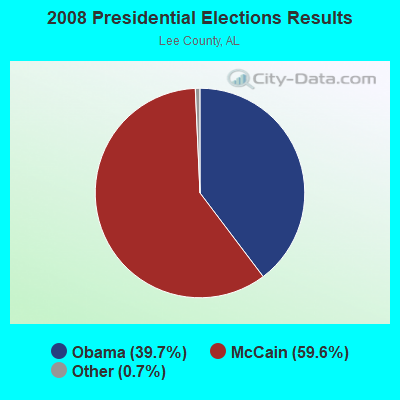
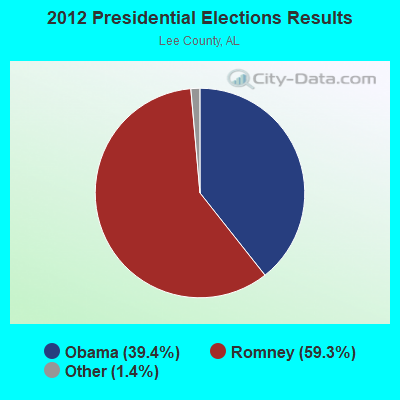

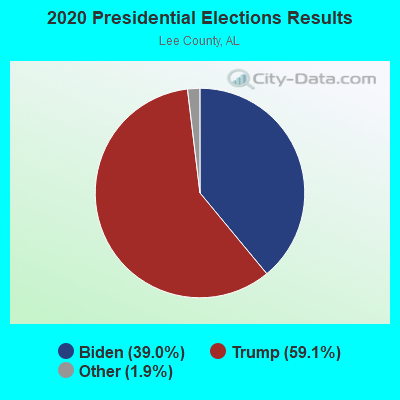
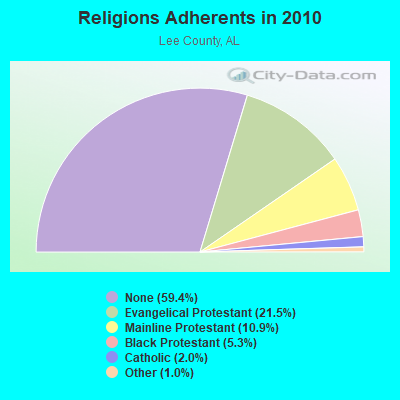
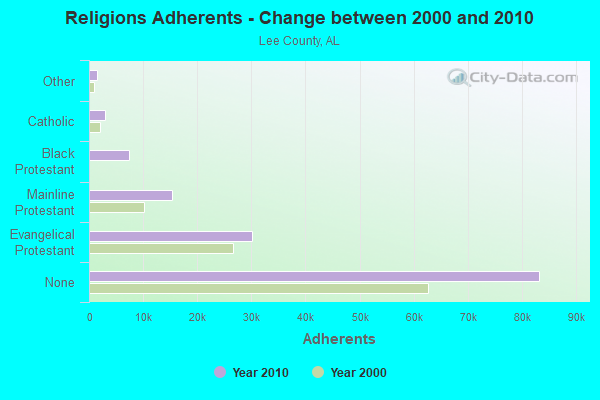
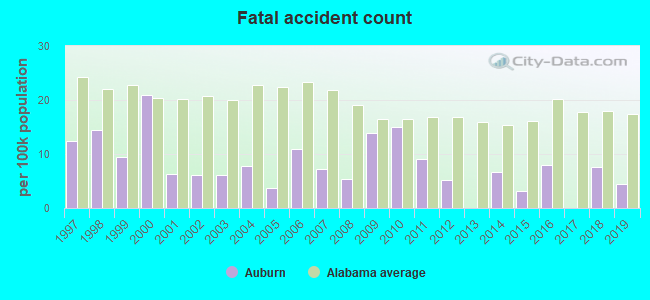
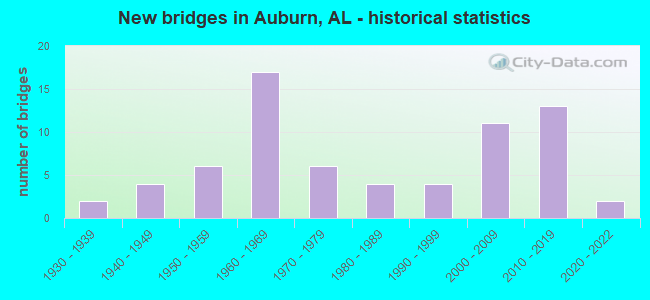
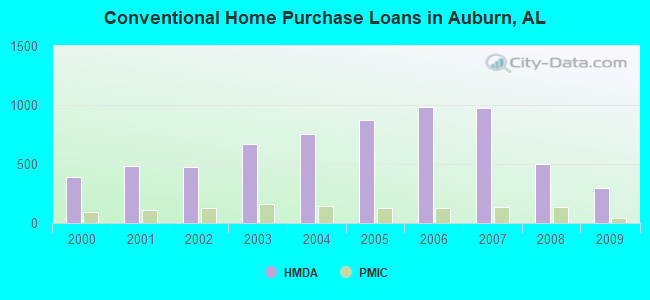
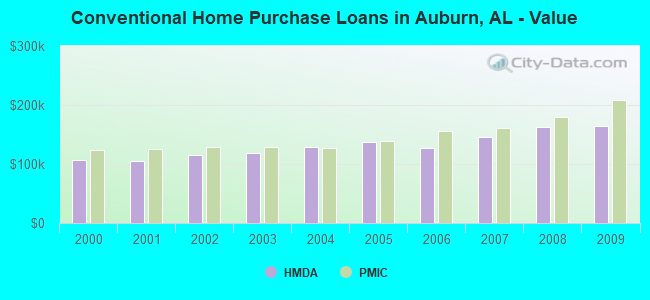
 According to the data from the years 2009 - 2018 the average number of fires per year is 124. The highest number of reported fires - 183 took place in 2012, and the least - 2 in 2010. The data has a growing trend.
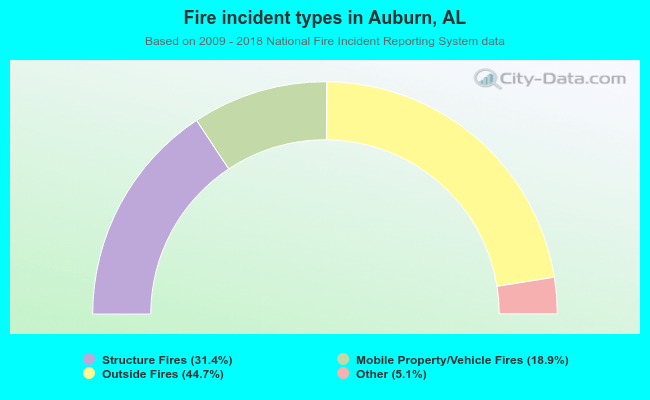 When looking into fire subcategories, the most incidents belonged to: Outside Fires (44.7%), and Structure Fires (31.4%).