Augusta, Kansas Submit your own pictures of this city and show them to the world
OSM Map
General Map
Google Map
MSN Map
OSM Map
General Map
Google Map
MSN Map
OSM Map
General Map
Google Map
MSN Map
OSM Map
General Map
Google Map
MSN Map
Please wait while loading the map...
Population in 2022: 9,222 (100% urban, 0% rural). Population change since 2000: +9.5%Males: 4,457 Females: 4,765
March 2022 cost of living index in Augusta: 81.6 (low, U.S. average is 100) Percentage of residents living in poverty in 2022: 11.0%for White Non-Hispanic residents , 5.6% for Hispanic or Latino residents , 7.8% for American Indian residents , 18.9% for two or more races residents )Business Search - 14 Million verified businesses
Data:
Median household income ($)
Median household income (% change since 2000)
Household income diversity
Ratio of average income to average house value (%)
Ratio of average income to average rent
Median household income ($) - White
Median household income ($) - Black or African American
Median household income ($) - Asian
Median household income ($) - Hispanic or Latino
Median household income ($) - American Indian and Alaska Native
Median household income ($) - Multirace
Median household income ($) - Other Race
Median household income for houses/condos with a mortgage ($)
Median household income for apartments without a mortgage ($)
Races - White alone (%)
Races - White alone (% change since 2000)
Races - Black alone (%)
Races - Black alone (% change since 2000)
Races - American Indian alone (%)
Races - American Indian alone (% change since 2000)
Races - Asian alone (%)
Races - Asian alone (% change since 2000)
Races - Hispanic (%)
Races - Hispanic (% change since 2000)
Races - Native Hawaiian and Other Pacific Islander alone (%)
Races - Native Hawaiian and Other Pacific Islander alone (% change since 2000)
Races - Two or more races (%)
Races - Two or more races (% change since 2000)
Races - Other race alone (%)
Races - Other race alone (% change since 2000)
Racial diversity
Unemployment (%)
Unemployment (% change since 2000)
Unemployment (%) - White
Unemployment (%) - Black or African American
Unemployment (%) - Asian
Unemployment (%) - Hispanic or Latino
Unemployment (%) - American Indian and Alaska Native
Unemployment (%) - Multirace
Unemployment (%) - Other Race
Population density (people per square mile)
Population - Males (%)
Population - Females (%)
Population - Males (%) - White
Population - Males (%) - Black or African American
Population - Males (%) - Asian
Population - Males (%) - Hispanic or Latino
Population - Males (%) - American Indian and Alaska Native
Population - Males (%) - Multirace
Population - Males (%) - Other Race
Population - Females (%) - White
Population - Females (%) - Black or African American
Population - Females (%) - Asian
Population - Females (%) - Hispanic or Latino
Population - Females (%) - American Indian and Alaska Native
Population - Females (%) - Multirace
Population - Females (%) - Other Race
Coronavirus confirmed cases (Apr 28, 2024)
Deaths caused by coronavirus (Apr 28, 2024)
Coronavirus confirmed cases (per 100k population) (Apr 28, 2024)
Deaths caused by coronavirus (per 100k population) (Apr 28, 2024)
Daily increase in number of cases (Apr 28, 2024)
Weekly increase in number of cases (Apr 28, 2024)
Cases doubled (in days) (Apr 28, 2024)
Hospitalized patients (Apr 18, 2022)
Negative test results (Apr 18, 2022)
Total test results (Apr 18, 2022)
COVID Vaccine doses distributed (per 100k population) (Sep 19, 2023)
COVID Vaccine doses administered (per 100k population) (Sep 19, 2023)
COVID Vaccine doses distributed (Sep 19, 2023)
COVID Vaccine doses administered (Sep 19, 2023)
Likely homosexual households (%)
Likely homosexual households (% change since 2000)
Likely homosexual households - Lesbian couples (%)
Likely homosexual households - Lesbian couples (% change since 2000)
Likely homosexual households - Gay men (%)
Likely homosexual households - Gay men (% change since 2000)
Cost of living index
Median gross rent ($)
Median contract rent ($)
Median monthly housing costs ($)
Median house or condo value ($)
Median house or condo value ($ change since 2000)
Mean house or condo value by units in structure - 1, detached ($)
Mean house or condo value by units in structure - 1, attached ($)
Mean house or condo value by units in structure - 2 ($)
Mean house or condo value by units in structure by units in structure - 3 or 4 ($)
Mean house or condo value by units in structure - 5 or more ($)
Mean house or condo value by units in structure - Boat, RV, van, etc. ($)
Mean house or condo value by units in structure - Mobile home ($)
Median house or condo value ($) - White
Median house or condo value ($) - Black or African American
Median house or condo value ($) - Asian
Median house or condo value ($) - Hispanic or Latino
Median house or condo value ($) - American Indian and Alaska Native
Median house or condo value ($) - Multirace
Median house or condo value ($) - Other Race
Median resident age
Resident age diversity
Median resident age - Males
Median resident age - Females
Median resident age - White
Median resident age - Black or African American
Median resident age - Asian
Median resident age - Hispanic or Latino
Median resident age - American Indian and Alaska Native
Median resident age - Multirace
Median resident age - Other Race
Median resident age - Males - White
Median resident age - Males - Black or African American
Median resident age - Males - Asian
Median resident age - Males - Hispanic or Latino
Median resident age - Males - American Indian and Alaska Native
Median resident age - Males - Multirace
Median resident age - Males - Other Race
Median resident age - Females - White
Median resident age - Females - Black or African American
Median resident age - Females - Asian
Median resident age - Females - Hispanic or Latino
Median resident age - Females - American Indian and Alaska Native
Median resident age - Females - Multirace
Median resident age - Females - Other Race
Commute - mean travel time to work (minutes)
Travel time to work - Less than 5 minutes (%)
Travel time to work - Less than 5 minutes (% change since 2000)
Travel time to work - 5 to 9 minutes (%)
Travel time to work - 5 to 9 minutes (% change since 2000)
Travel time to work - 10 to 19 minutes (%)
Travel time to work - 10 to 19 minutes (% change since 2000)
Travel time to work - 20 to 29 minutes (%)
Travel time to work - 20 to 29 minutes (% change since 2000)
Travel time to work - 30 to 39 minutes (%)
Travel time to work - 30 to 39 minutes (% change since 2000)
Travel time to work - 40 to 59 minutes (%)
Travel time to work - 40 to 59 minutes (% change since 2000)
Travel time to work - 60 to 89 minutes (%)
Travel time to work - 60 to 89 minutes (% change since 2000)
Travel time to work - 90 or more minutes (%)
Travel time to work - 90 or more minutes (% change since 2000)
Marital status - Never married (%)
Marital status - Now married (%)
Marital status - Separated (%)
Marital status - Widowed (%)
Marital status - Divorced (%)
Median family income ($)
Median family income (% change since 2000)
Median non-family income ($)
Median non-family income (% change since 2000)
Median per capita income ($)
Median per capita income (% change since 2000)
Median family income ($) - White
Median family income ($) - Black or African American
Median family income ($) - Asian
Median family income ($) - Hispanic or Latino
Median family income ($) - American Indian and Alaska Native
Median family income ($) - Multirace
Median family income ($) - Other Race
Median year house/condo built
Median year apartment built
Year house built - Built 2005 or later (%)
Year house built - Built 2000 to 2004 (%)
Year house built - Built 1990 to 1999 (%)
Year house built - Built 1980 to 1989 (%)
Year house built - Built 1970 to 1979 (%)
Year house built - Built 1960 to 1969 (%)
Year house built - Built 1950 to 1959 (%)
Year house built - Built 1940 to 1949 (%)
Year house built - Built 1939 or earlier (%)
Average household size
Household density (households per square mile)
Average household size - White
Average household size - Black or African American
Average household size - Asian
Average household size - Hispanic or Latino
Average household size - American Indian and Alaska Native
Average household size - Multirace
Average household size - Other Race
Occupied housing units (%)
Vacant housing units (%)
Owner occupied housing units (%)
Renter occupied housing units (%)
Vacancy status - For rent (%)
Vacancy status - For sale only (%)
Vacancy status - Rented or sold, not occupied (%)
Vacancy status - For seasonal, recreational, or occasional use (%)
Vacancy status - For migrant workers (%)
Vacancy status - Other vacant (%)
Residents with income below the poverty level (%)
Residents with income below 50% of the poverty level (%)
Children below poverty level (%)
Poor families by family type - Married-couple family (%)
Poor families by family type - Male, no wife present (%)
Poor families by family type - Female, no husband present (%)
Poverty status for native-born residents (%)
Poverty status for foreign-born residents (%)
Poverty among high school graduates not in families (%)
Poverty among people who did not graduate high school not in families (%)
Residents with income below the poverty level (%) - White
Residents with income below the poverty level (%) - Black or African American
Residents with income below the poverty level (%) - Asian
Residents with income below the poverty level (%) - Hispanic or Latino
Residents with income below the poverty level (%) - American Indian and Alaska Native
Residents with income below the poverty level (%) - Multirace
Residents with income below the poverty level (%) - Other Race
Air pollution - Air Quality Index (AQI)
Air pollution - CO
Air pollution - NO2
Air pollution - SO2
Air pollution - Ozone
Air pollution - PM10
Air pollution - PM25
Air pollution - Pb
Crime - Murders per 100,000 population
Crime - Rapes per 100,000 population
Crime - Robberies per 100,000 population
Crime - Assaults per 100,000 population
Crime - Burglaries per 100,000 population
Crime - Thefts per 100,000 population
Crime - Auto thefts per 100,000 population
Crime - Arson per 100,000 population
Crime - City-data.com crime index
Crime - Violent crime index
Crime - Property crime index
Crime - Murders per 100,000 population (5 year average)
Crime - Rapes per 100,000 population (5 year average)
Crime - Robberies per 100,000 population (5 year average)
Crime - Assaults per 100,000 population (5 year average)
Crime - Burglaries per 100,000 population (5 year average)
Crime - Thefts per 100,000 population (5 year average)
Crime - Auto thefts per 100,000 population (5 year average)
Crime - Arson per 100,000 population (5 year average)
Crime - City-data.com crime index (5 year average)
Crime - Violent crime index (5 year average)
Crime - Property crime index (5 year average)
1996 Presidential Elections Results (%) - Democratic Party (Clinton)
1996 Presidential Elections Results (%) - Republican Party (Dole)
1996 Presidential Elections Results (%) - Other
2000 Presidential Elections Results (%) - Democratic Party (Gore)
2000 Presidential Elections Results (%) - Republican Party (Bush)
2000 Presidential Elections Results (%) - Other
2004 Presidential Elections Results (%) - Democratic Party (Kerry)
2004 Presidential Elections Results (%) - Republican Party (Bush)
2004 Presidential Elections Results (%) - Other
2008 Presidential Elections Results (%) - Democratic Party (Obama)
2008 Presidential Elections Results (%) - Republican Party (McCain)
2008 Presidential Elections Results (%) - Other
2012 Presidential Elections Results (%) - Democratic Party (Obama)
2012 Presidential Elections Results (%) - Republican Party (Romney)
2012 Presidential Elections Results (%) - Other
2016 Presidential Elections Results (%) - Democratic Party (Clinton)
2016 Presidential Elections Results (%) - Republican Party (Trump)
2016 Presidential Elections Results (%) - Other
2020 Presidential Elections Results (%) - Democratic Party (Biden)
2020 Presidential Elections Results (%) - Republican Party (Trump)
2020 Presidential Elections Results (%) - Other
Ancestries Reported - Arab (%)
Ancestries Reported - Czech (%)
Ancestries Reported - Danish (%)
Ancestries Reported - Dutch (%)
Ancestries Reported - English (%)
Ancestries Reported - French (%)
Ancestries Reported - French Canadian (%)
Ancestries Reported - German (%)
Ancestries Reported - Greek (%)
Ancestries Reported - Hungarian (%)
Ancestries Reported - Irish (%)
Ancestries Reported - Italian (%)
Ancestries Reported - Lithuanian (%)
Ancestries Reported - Norwegian (%)
Ancestries Reported - Polish (%)
Ancestries Reported - Portuguese (%)
Ancestries Reported - Russian (%)
Ancestries Reported - Scotch-Irish (%)
Ancestries Reported - Scottish (%)
Ancestries Reported - Slovak (%)
Ancestries Reported - Subsaharan African (%)
Ancestries Reported - Swedish (%)
Ancestries Reported - Swiss (%)
Ancestries Reported - Ukrainian (%)
Ancestries Reported - United States (%)
Ancestries Reported - Welsh (%)
Ancestries Reported - West Indian (%)
Ancestries Reported - Other (%)
Educational Attainment - No schooling completed (%)
Educational Attainment - Less than high school (%)
Educational Attainment - High school or equivalent (%)
Educational Attainment - Less than 1 year of college (%)
Educational Attainment - 1 or more years of college (%)
Educational Attainment - Associate degree (%)
Educational Attainment - Bachelor's degree (%)
Educational Attainment - Master's degree (%)
Educational Attainment - Professional school degree (%)
Educational Attainment - Doctorate degree (%)
School Enrollment - Nursery, preschool (%)
School Enrollment - Kindergarten (%)
School Enrollment - Grade 1 to 4 (%)
School Enrollment - Grade 5 to 8 (%)
School Enrollment - Grade 9 to 12 (%)
School Enrollment - College undergrad (%)
School Enrollment - Graduate or professional (%)
School Enrollment - Not enrolled in school (%)
School enrollment - Public schools (%)
School enrollment - Private schools (%)
School enrollment - Not enrolled (%)
Median number of rooms in houses and condos
Median number of rooms in apartments
Housing units lacking complete plumbing facilities (%)
Housing units lacking complete kitchen facilities (%)
Density of houses
Urban houses (%)
Rural houses (%)
Households with people 60 years and over (%)
Households with people 65 years and over (%)
Households with people 75 years and over (%)
Households with one or more nonrelatives (%)
Households with no nonrelatives (%)
Population in households (%)
Family households (%)
Nonfamily households (%)
Population in families (%)
Family households with own children (%)
Median number of bedrooms in owner occupied houses
Mean number of bedrooms in owner occupied houses
Median number of bedrooms in renter occupied houses
Mean number of bedrooms in renter occupied houses
Median number of vehichles in owner occupied houses
Mean number of vehichles in owner occupied houses
Median number of vehichles in renter occupied houses
Mean number of vehichles in renter occupied houses
Mortgage status - with mortgage (%)
Mortgage status - with second mortgage (%)
Mortgage status - with home equity loan (%)
Mortgage status - with both second mortgage and home equity loan (%)
Mortgage status - without a mortgage (%)
Average family size
Average family size - White
Average family size - Black or African American
Average family size - Asian
Average family size - Hispanic or Latino
Average family size - American Indian and Alaska Native
Average family size - Multirace
Average family size - Other Race
Geographical mobility - Same house 1 year ago (%)
Geographical mobility - Moved within same county (%)
Geographical mobility - Moved from different county within same state (%)
Geographical mobility - Moved from different state (%)
Geographical mobility - Moved from abroad (%)
Place of birth - Born in state of residence (%)
Place of birth - Born in other state (%)
Place of birth - Native, outside of US (%)
Place of birth - Foreign born (%)
Housing units in structures - 1, detached (%)
Housing units in structures - 1, attached (%)
Housing units in structures - 2 (%)
Housing units in structures - 3 or 4 (%)
Housing units in structures - 5 to 9 (%)
Housing units in structures - 10 to 19 (%)
Housing units in structures - 20 to 49 (%)
Housing units in structures - 50 or more (%)
Housing units in structures - Mobile home (%)
Housing units in structures - Boat, RV, van, etc. (%)
House/condo owner moved in on average (years ago)
Renter moved in on average (years ago)
Year householder moved into unit - Moved in 1999 to March 2000 (%)
Year householder moved into unit - Moved in 1995 to 1998 (%)
Year householder moved into unit - Moved in 1990 to 1994 (%)
Year householder moved into unit - Moved in 1980 to 1989 (%)
Year householder moved into unit - Moved in 1970 to 1979 (%)
Year householder moved into unit - Moved in 1969 or earlier (%)
Means of transportation to work - Drove car alone (%)
Means of transportation to work - Carpooled (%)
Means of transportation to work - Public transportation (%)
Means of transportation to work - Bus or trolley bus (%)
Means of transportation to work - Streetcar or trolley car (%)
Means of transportation to work - Subway or elevated (%)
Means of transportation to work - Railroad (%)
Means of transportation to work - Ferryboat (%)
Means of transportation to work - Taxicab (%)
Means of transportation to work - Motorcycle (%)
Means of transportation to work - Bicycle (%)
Means of transportation to work - Walked (%)
Means of transportation to work - Other means (%)
Working at home (%)
Industry diversity
Most Common Industries - Agriculture, forestry, fishing and hunting, and mining (%)
Most Common Industries - Agriculture, forestry, fishing and hunting (%)
Most Common Industries - Mining, quarrying, and oil and gas extraction (%)
Most Common Industries - Construction (%)
Most Common Industries - Manufacturing (%)
Most Common Industries - Wholesale trade (%)
Most Common Industries - Retail trade (%)
Most Common Industries - Transportation and warehousing, and utilities (%)
Most Common Industries - Transportation and warehousing (%)
Most Common Industries - Utilities (%)
Most Common Industries - Information (%)
Most Common Industries - Finance and insurance, and real estate and rental and leasing (%)
Most Common Industries - Finance and insurance (%)
Most Common Industries - Real estate and rental and leasing (%)
Most Common Industries - Professional, scientific, and management, and administrative and waste management services (%)
Most Common Industries - Professional, scientific, and technical services (%)
Most Common Industries - Management of companies and enterprises (%)
Most Common Industries - Administrative and support and waste management services (%)
Most Common Industries - Educational services, and health care and social assistance (%)
Most Common Industries - Educational services (%)
Most Common Industries - Health care and social assistance (%)
Most Common Industries - Arts, entertainment, and recreation, and accommodation and food services (%)
Most Common Industries - Arts, entertainment, and recreation (%)
Most Common Industries - Accommodation and food services (%)
Most Common Industries - Other services, except public administration (%)
Most Common Industries - Public administration (%)
Occupation diversity
Most Common Occupations - Management, business, science, and arts occupations (%)
Most Common Occupations - Management, business, and financial occupations (%)
Most Common Occupations - Management occupations (%)
Most Common Occupations - Business and financial operations occupations (%)
Most Common Occupations - Computer, engineering, and science occupations (%)
Most Common Occupations - Computer and mathematical occupations (%)
Most Common Occupations - Architecture and engineering occupations (%)
Most Common Occupations - Life, physical, and social science occupations (%)
Most Common Occupations - Education, legal, community service, arts, and media occupations (%)
Most Common Occupations - Community and social service occupations (%)
Most Common Occupations - Legal occupations (%)
Most Common Occupations - Education, training, and library occupations (%)
Most Common Occupations - Arts, design, entertainment, sports, and media occupations (%)
Most Common Occupations - Healthcare practitioners and technical occupations (%)
Most Common Occupations - Health diagnosing and treating practitioners and other technical occupations (%)
Most Common Occupations - Health technologists and technicians (%)
Most Common Occupations - Service occupations (%)
Most Common Occupations - Healthcare support occupations (%)
Most Common Occupations - Protective service occupations (%)
Most Common Occupations - Fire fighting and prevention, and other protective service workers including supervisors (%)
Most Common Occupations - Law enforcement workers including supervisors (%)
Most Common Occupations - Food preparation and serving related occupations (%)
Most Common Occupations - Building and grounds cleaning and maintenance occupations (%)
Most Common Occupations - Personal care and service occupations (%)
Most Common Occupations - Sales and office occupations (%)
Most Common Occupations - Sales and related occupations (%)
Most Common Occupations - Office and administrative support occupations (%)
Most Common Occupations - Natural resources, construction, and maintenance occupations (%)
Most Common Occupations - Farming, fishing, and forestry occupations (%)
Most Common Occupations - Construction and extraction occupations (%)
Most Common Occupations - Installation, maintenance, and repair occupations (%)
Most Common Occupations - Production, transportation, and material moving occupations (%)
Most Common Occupations - Production occupations (%)
Most Common Occupations - Transportation occupations (%)
Most Common Occupations - Material moving occupations (%)
People in Group quarters - Institutionalized population (%)
People in Group quarters - Correctional institutions (%)
People in Group quarters - Federal prisons and detention centers (%)
People in Group quarters - Halfway houses (%)
People in Group quarters - Local jails and other confinement facilities (including police lockups) (%)
People in Group quarters - Military disciplinary barracks (%)
People in Group quarters - State prisons (%)
People in Group quarters - Other types of correctional institutions (%)
People in Group quarters - Nursing homes (%)
People in Group quarters - Hospitals/wards, hospices, and schools for the handicapped (%)
People in Group quarters - Hospitals/wards and hospices for chronically ill (%)
People in Group quarters - Hospices or homes for chronically ill (%)
People in Group quarters - Military hospitals or wards for chronically ill (%)
People in Group quarters - Other hospitals or wards for chronically ill (%)
People in Group quarters - Hospitals or wards for drug/alcohol abuse (%)
People in Group quarters - Mental (Psychiatric) hospitals or wards (%)
People in Group quarters - Schools, hospitals, or wards for the mentally retarded (%)
People in Group quarters - Schools, hospitals, or wards for the physically handicapped (%)
People in Group quarters - Institutions for the deaf (%)
People in Group quarters - Institutions for the blind (%)
People in Group quarters - Orthopedic wards and institutions for the physically handicapped (%)
People in Group quarters - Wards in general hospitals for patients who have no usual home elsewhere (%)
People in Group quarters - Wards in military hospitals for patients who have no usual home elsewhere (%)
People in Group quarters - Juvenile institutions (%)
People in Group quarters - Long-term care (%)
People in Group quarters - Homes for abused, dependent, and neglected children (%)
People in Group quarters - Residential treatment centers for emotionally disturbed children (%)
People in Group quarters - Training schools for juvenile delinquents (%)
People in Group quarters - Short-term care, detention or diagnostic centers for delinquent children (%)
People in Group quarters - Type of juvenile institution unknown (%)
People in Group quarters - Noninstitutionalized population (%)
People in Group quarters - College dormitories (includes college quarters off campus) (%)
People in Group quarters - Military quarters (%)
People in Group quarters - On base (%)
People in Group quarters - Barracks, unaccompanied personnel housing (UPH), (Enlisted/Officer), ;and similar group living quarters for military personnel (%)
People in Group quarters - Transient quarters for temporary residents (%)
People in Group quarters - Military ships (%)
People in Group quarters - Group homes (%)
People in Group quarters - Homes or halfway houses for drug/alcohol abuse (%)
People in Group quarters - Homes for the mentally ill (%)
People in Group quarters - Homes for the mentally retarded (%)
People in Group quarters - Homes for the physically handicapped (%)
People in Group quarters - Other group homes (%)
People in Group quarters - Religious group quarters (%)
People in Group quarters - Dormitories (%)
People in Group quarters - Agriculture workers' dormitories on farms (%)
People in Group quarters - Job Corps and vocational training facilities (%)
People in Group quarters - Other workers' dormitories (%)
People in Group quarters - Crews of maritime vessels (%)
People in Group quarters - Other nonhousehold living situations (%)
People in Group quarters - Other noninstitutional group quarters (%)
Residents speaking English at home (%)
Residents speaking English at home - Born in the United States (%)
Residents speaking English at home - Native, born elsewhere (%)
Residents speaking English at home - Foreign born (%)
Residents speaking Spanish at home (%)
Residents speaking Spanish at home - Born in the United States (%)
Residents speaking Spanish at home - Native, born elsewhere (%)
Residents speaking Spanish at home - Foreign born (%)
Residents speaking other language at home (%)
Residents speaking other language at home - Born in the United States (%)
Residents speaking other language at home - Native, born elsewhere (%)
Residents speaking other language at home - Foreign born (%)
Class of Workers - Employee of private company (%)
Class of Workers - Self-employed in own incorporated business (%)
Class of Workers - Private not-for-profit wage and salary workers (%)
Class of Workers - Local government workers (%)
Class of Workers - State government workers (%)
Class of Workers - Federal government workers (%)
Class of Workers - Self-employed workers in own not incorporated business and Unpaid family workers (%)
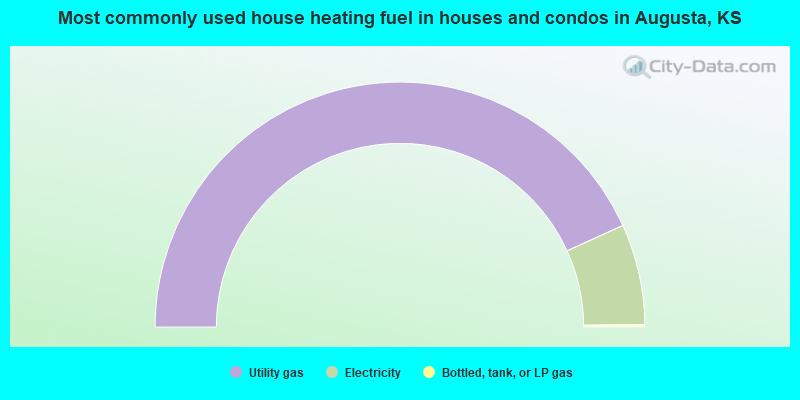
House heating fuel used in houses and condos - Utility gas (%)
House heating fuel used in houses and condos - Bottled, tank, or LP gas (%)
House heating fuel used in houses and condos - Electricity (%)
House heating fuel used in houses and condos - Fuel oil, kerosene, etc. (%)
House heating fuel used in houses and condos - Coal or coke (%)
House heating fuel used in houses and condos - Wood (%)
House heating fuel used in houses and condos - Solar energy (%)
House heating fuel used in houses and condos - Other fuel (%)
House heating fuel used in houses and condos - No fuel used (%)
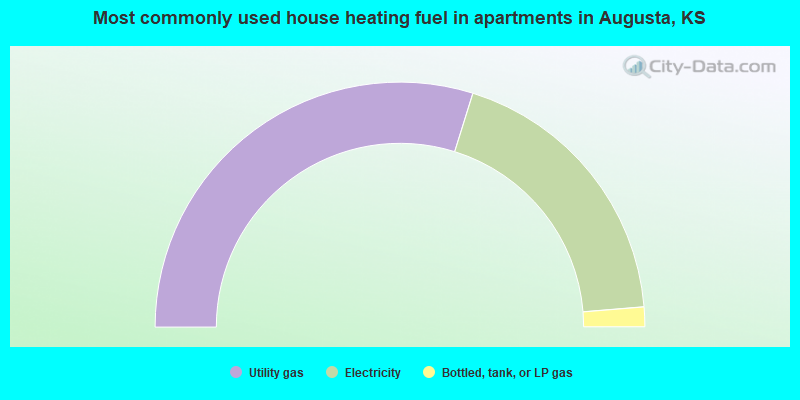
House heating fuel used in apartments - Utility gas (%)
House heating fuel used in apartments - Bottled, tank, or LP gas (%)
House heating fuel used in apartments - Electricity (%)
House heating fuel used in apartments - Fuel oil, kerosene, etc. (%)
House heating fuel used in apartments - Coal or coke (%)
House heating fuel used in apartments - Wood (%)
House heating fuel used in apartments - Solar energy (%)
House heating fuel used in apartments - Other fuel (%)
House heating fuel used in apartments - No fuel used (%)
Armed forces status - In Armed Forces (%)
Armed forces status - Civilian (%)
Armed forces status - Civilian - Veteran (%)
Armed forces status - Civilian - Nonveteran (%)
Fatal accidents locations in years 2005-2021
Fatal accidents locations in 2005
Fatal accidents locations in 2006
Fatal accidents locations in 2007
Fatal accidents locations in 2008
Fatal accidents locations in 2009
Fatal accidents locations in 2010
Fatal accidents locations in 2011
Fatal accidents locations in 2012
Fatal accidents locations in 2013
Fatal accidents locations in 2014
Fatal accidents locations in 2015
Fatal accidents locations in 2016
Fatal accidents locations in 2017
Fatal accidents locations in 2018
Fatal accidents locations in 2019
Fatal accidents locations in 2020
Fatal accidents locations in 2021
Alcohol use - People drinking some alcohol every month (%)
Alcohol use - People not drinking at all (%)
Alcohol use - Average days/month drinking alcohol
Alcohol use - Average drinks/week
Alcohol use - Average days/year people drink much
Audiometry - Average condition of hearing (%)
Audiometry - People that can hear a whisper from across a quiet room (%)
Audiometry - People that can hear normal voice from across a quiet room (%)
Audiometry - Ears ringing, roaring, buzzing (%)
Audiometry - Had a job exposure to loud noise (%)
Audiometry - Had off-work exposure to loud noise (%)
Blood Pressure & Cholesterol - Has high blood pressure (%)
Blood Pressure & Cholesterol - Checking blood pressure at home (%)
Blood Pressure & Cholesterol - Frequently checking blood cholesterol (%)
Blood Pressure & Cholesterol - Has high cholesterol level (%)
Consumer Behavior - Money monthly spent on food at supermarket/grocery store
Consumer Behavior - Money monthly spent on food at other stores
Consumer Behavior - Money monthly spent on eating out
Consumer Behavior - Money monthly spent on carryout/delivered foods
Consumer Behavior - Income spent on food at supermarket/grocery store (%)
Consumer Behavior - Income spent on food at other stores (%)
Consumer Behavior - Income spent on eating out (%)
Consumer Behavior - Income spent on carryout/delivered foods (%)
Current Health Status - General health condition (%)
Current Health Status - Blood donors (%)
Current Health Status - Has blood ever tested for HIV virus (%)
Current Health Status - Left-handed people (%)
Dermatology - People using sunscreen (%)
Diabetes - Diabetics (%)
Diabetes - Had a blood test for high blood sugar (%)
Diabetes - People taking insulin (%)
Diet Behavior & Nutrition - Diet health (%)
Diet Behavior & Nutrition - Milk product consumption (# of products/month)
Diet Behavior & Nutrition - Meals not home prepared (#/week)
Diet Behavior & Nutrition - Meals from fast food or pizza place (#/week)
Diet Behavior & Nutrition - Ready-to-eat foods (#/month)
Diet Behavior & Nutrition - Frozen meals/pizza (#/month)
Drug Use - People that ever used marijuana or hashish (%)
Drug Use - Ever used hard drugs (%)
Drug Use - Ever used any form of cocaine (%)
Drug Use - Ever used heroin (%)
Drug Use - Ever used methamphetamine (%)
Health Insurance - People covered by health insurance (%)
Kidney Conditions-Urology - Avg. # of times urinating at night
Medical Conditions - People with asthma (%)
Medical Conditions - People with anemia (%)
Medical Conditions - People with psoriasis (%)
Medical Conditions - People with overweight (%)
Medical Conditions - Elderly people having difficulties in thinking or remembering (%)
Medical Conditions - People who ever received blood transfusion (%)
Medical Conditions - People having trouble seeing even with glass/contacts (%)
Medical Conditions - People with arthritis (%)
Medical Conditions - People with gout (%)
Medical Conditions - People with congestive heart failure (%)
Medical Conditions - People with coronary heart disease (%)
Medical Conditions - People with angina pectoris (%)
Medical Conditions - People who ever had heart attack (%)
Medical Conditions - People who ever had stroke (%)
Medical Conditions - People with emphysema (%)
Medical Conditions - People with thyroid problem (%)
Medical Conditions - People with chronic bronchitis (%)
Medical Conditions - People with any liver condition (%)
Medical Conditions - People who ever had cancer or malignancy (%)
Mental Health - People who have little interest in doing things (%)
Mental Health - People feeling down, depressed, or hopeless (%)
Mental Health - People who have trouble sleeping or sleeping too much (%)
Mental Health - People feeling tired or having little energy (%)
Mental Health - People with poor appetite or overeating (%)
Mental Health - People feeling bad about themself (%)
Mental Health - People who have trouble concentrating on things (%)
Mental Health - People moving or speaking slowly or too fast (%)
Mental Health - People having thoughts they would be better off dead (%)
Oral Health - Average years since last visit a dentist
Oral Health - People embarrassed because of mouth (%)
Oral Health - People with gum disease (%)
Oral Health - General health of teeth and gums (%)
Oral Health - Average days a week using dental floss/device
Oral Health - Average days a week using mouthwash for dental problem
Oral Health - Average number of teeth
Pesticide Use - Households using pesticides to control insects (%)
Pesticide Use - Households using pesticides to kill weeds (%)
Physical Activity - People doing vigorous-intensity work activities (%)
Physical Activity - People doing moderate-intensity work activities (%)
Physical Activity - People walking or bicycling (%)
Physical Activity - People doing vigorous-intensity recreational activities (%)
Physical Activity - People doing moderate-intensity recreational activities (%)
Physical Activity - Average hours a day doing sedentary activities
Physical Activity - Average hours a day watching TV or videos
Physical Activity - Average hours a day using computer
Physical Functioning - People having limitations keeping them from working (%)
Physical Functioning - People limited in amount of work they can do (%)
Physical Functioning - People that need special equipment to walk (%)
Physical Functioning - People experiencing confusion/memory problems (%)
Physical Functioning - People requiring special healthcare equipment (%)
Prescription Medications - Average number of prescription medicines taking
Preventive Aspirin Use - Adults 40+ taking low-dose aspirin (%)
Reproductive Health - Vaginal deliveries (%)
Reproductive Health - Cesarean deliveries (%)
Reproductive Health - Deliveries resulted in a live birth (%)
Reproductive Health - Pregnancies resulted in a delivery (%)
Reproductive Health - Women breastfeeding newborns (%)
Reproductive Health - Women that had a hysterectomy (%)
Reproductive Health - Women that had both ovaries removed (%)
Reproductive Health - Women that have ever taken birth control pills (%)
Reproductive Health - Women taking birth control pills (%)
Reproductive Health - Women that have ever used Depo-Provera or injectables (%)
Reproductive Health - Women that have ever used female hormones (%)
Sexual Behavior - People 18+ that ever had sex (vaginal, anal, or oral) (%)
Sexual Behavior - Males 18+ that ever had vaginal sex with a woman (%)
Sexual Behavior - Males 18+ that ever performed oral sex on a woman (%)
Sexual Behavior - Males 18+ that ever had anal sex with a woman (%)
Sexual Behavior - Males 18+ that ever had any sex with a man (%)
Sexual Behavior - Females 18+ that ever had vaginal sex with a man (%)
Sexual Behavior - Females 18+ that ever performed oral sex on a man (%)
Sexual Behavior - Females 18+ that ever had anal sex with a man (%)
Sexual Behavior - Females 18+ that ever had any kind of sex with a woman (%)
Sexual Behavior - Average age people first had sex
Sexual Behavior - Average number of female sex partners in lifetime (males 18+)
Sexual Behavior - Average number of female vaginal sex partners in lifetime (males 18+)
Sexual Behavior - Average age people first performed oral sex on a woman (18+)
Sexual Behavior - Average number of woman performed oral sex on in lifetime (18+)
Sexual Behavior - Average number of male sex partners in lifetime (males 18+)
Sexual Behavior - Average number of male anal sex partners in lifetime (males 18+)
Sexual Behavior - Average age people first performed oral sex on a man (18+)
Sexual Behavior - Average number of male oral sex partners in lifetime (18+)
Sexual Behavior - People using protection when performing oral sex (%)
Sexual Behavior - Average number of times people have vaginal or anal sex a year
Sexual Behavior - People having sex without condom (%)
Sexual Behavior - Average number of male sex partners in lifetime (females 18+)
Sexual Behavior - Average number of male vaginal sex partners in lifetime (females 18+)
Sexual Behavior - Average number of female sex partners in lifetime (females 18+)
Sexual Behavior - Circumcised males 18+ (%)
Sleep Disorders - Average hours sleeping at night
Sleep Disorders - People that has trouble sleeping (%)
Smoking-Cigarette Use - People smoking cigarettes (%)
Taste & Smell - People 40+ having problems with smell (%)
Taste & Smell - People 40+ having problems with taste (%)
Taste & Smell - People 40+ that ever had wisdom teeth removed (%)
Taste & Smell - People 40+ that ever had tonsils teeth removed (%)
Taste & Smell - People 40+ that ever had a loss of consciousness because of a head injury (%)
Taste & Smell - People 40+ that ever had a broken nose or other serious injury to face or skull (%)
Taste & Smell - People 40+ that ever had two or more sinus infections (%)
Weight - Average height (inches)
Weight - Average weight (pounds)
Weight - Average BMI
Weight - People that are obese (%)
Weight - People that ever were obese (%)
Weight - People trying to lose weight (%)
According to our research of Kansas and other state lists, there were 38 registered sex offenders living in Augusta, Kansas as of April 28, 2024 . The ratio of all residents to sex offenders in Augusta is 244 to 1.The ratio of registered sex offenders to all residents in this city is near the state average.
Officers per 1,000 residents here:
2.37Kansas average:
2.70
Latest news from Augusta, KS collected exclusively by city-data.com from local newspapers, TV, and radio stations
Ancestries: German (20.6%), English (15.7%), American (15.4%), European (6.0%), Swedish (4.9%), Irish (4.3%).
Current Local Time:
Land area: 4.03 square miles.
Population density: 2,289 people per square mile (low).
194 residents are foreign born (1.7% Latin America , 0.4% Europe ).
This city:
2.1%Kansas:
7.1%
Median real estate property taxes paid for housing units with mortgages in 2022: $2,532 (1.5%)Median real estate property taxes paid for housing units with no mortgage in 2022: $2,918 (2.1%)
Nearest city with pop. 50,000+: Wichita, KS
Nearest city with pop. 1,000,000+: Dallas, TX
Nearest cities:
Latitude: 37.69 N, Longitude: 96.98 W
Daytime population change due to commuting: -2,176 (-23.3%)Workers who live and work in this city: 1,339 (27.8%)
Area code commonly used in this area: 316
Single-family new house construction building permits:
2022: 9 buildings , average cost: $82,2002021: 3 buildings , average cost: $80,0002020: 16 buildings , average cost: $86,6002019: 15 buildings , average cost: $86,6002018: 16 buildings , average cost: $86,6002017: 16 buildings , average cost: $86,6002016: 15 buildings , average cost: $86,6002015: 14 buildings , average cost: $86,6002014: 13 buildings , average cost: $86,6002013: 13 buildings , average cost: $86,6002012: 11 buildings , average cost: $86,6002011: 9 buildings , average cost: $104,1002010: 10 buildings , average cost: $104,1002009: 11 buildings , average cost: $106,1002008: 22 buildings , average cost: $85,6002007: 18 buildings , average cost: $87,9002006: 19 buildings , average cost: $81,7002005: 33 buildings , average cost: $135,8002004: 47 buildings , average cost: $111,8002003: 46 buildings , average cost: $92,8002002: 21 buildings , average cost: $80,4002001: 31 buildings , average cost: $71,7002000: 45 buildings , average cost: $74,2001999: 49 buildings , average cost: $71,0001998: 58 buildings , average cost: $64,2001997: 44 buildings , average cost: $74,700Unemployment in December 2023: Population change in the 1990s: +521 (+6.6%).
Most common occupations in Augusta, KS (%)
Both Males Females
Other production occupations, including supervisors (4.4%)
Other sales and related occupations, including supervisors (3.8%)
Construction traders workers except carpenters, electricians, painters, plumbers, and construction laborers (3.8%)
Other management occupations, except farmers and farm managers (3.6%)
Preschool, kindergarten, elementary, and middle school teachers (3.4%)
Sales representatives, services, wholesale and manufacturing (3.2%)
Secretaries and administrative assistants (3.1%)
Construction traders workers except carpenters, electricians, painters, plumbers, and construction laborers (6.3%)
Other production occupations, including supervisors (6.3%)
Vehicle and mobile equipment mechanics, installers, and repairers (4.6%)
Other sales and related occupations, including supervisors (4.3%)
Material recording, scheduling, dispatching, and distributing workers (4.2%)
Metal workers and plastic workers (4.1%)
Driver/sales workers and truck drivers (4.0%)
Secretaries and administrative assistants (6.7%)
Preschool, kindergarten, elementary, and middle school teachers (6.5%)
Health technologists and technicians (4.3%)
Child care workers (4.1%)
Other management occupations, except farmers and farm managers (4.0%)
Financial clerks, except bookkeeping, accounting and auditing clerks (3.6%)
Other office and administrative support workers, including supervisors (3.6%)
Tornado activity:
Augusta-area historical tornado activity is near Kansas state average. It is 91% greater than the overall U.S. average.
On 4/26/1991, a category F5 (max. wind speeds 261-318 mph) tornado 15.6 miles away from the Augusta city center killed 17 people and injured 225 people and caused between $50,000,000 and $500,000,000 in damages.
On 5/25/1955, a category F5 tornado 21.0 miles away from the city center killed 80 people and injured 273 people and caused between $50,000 and $500,000 in damages.
Earthquake activity:
Augusta-area historical earthquake activity is significantly above Kansas state average. It is 804% greater than the overall U.S. average. On 9/3/2016 at 12:02:44, a magnitude 5.8 (5.8 MW, Depth: 3.5 mi, Class: Moderate, Intensity: VI - VII) earthquake occurred 87.7 miles away from the city center On 11/6/2011 at 03:53:10, a magnitude 5.7 (5.7 MW, Depth: 3.2 mi) earthquake occurred 149.9 miles away from the city center On 11/12/2014 at 21:40:00, a magnitude 4.9 (4.9 MW, Depth: 2.5 mi, Class: Light, Intensity: IV - V) earthquake occurred 45.7 miles away from the city center On 2/13/2016 at 17:07:06, a magnitude 5.1 (5.1 MW, Depth: 5.2 mi) earthquake occurred 126.6 miles away from the city center On 11/7/2016 at 01:44:24, a magnitude 5.0 (5.0 MW, Depth: 2.8 mi) earthquake occurred 118.1 miles away from the city center On 11/30/2015 at 09:49:12, a magnitude 4.7 (4.7 MW, Depth: 3.5 mi) earthquake occurred 88.1 miles away from the city center Magnitude types: moment magnitude (MW) Natural disasters: The number of natural disasters in Butler County (23) is greater than the US average (15).Major Disasters (Presidential) Declared: 19Emergencies Declared: 2Floods: 15, Storms: 14, Tornadoes: 9, Winds: 5, Winter Storms: 5, Heavy Rain: 1, Hurricane: 1, Ice Storm: 1, Landslide: 1, Mudslide: 1, Snow: 1, Snowstorm: 1, Other: 1 (Note: some incidents may be assigned to more than one category). Hospitals and medical centers in Augusta: AUGUSTA MEDICAL COMPLEX LTCU (2101 DEARBORN)
LAKEPOINT NURSING CENTER (901 LAKEPOINT DR)
Other hospitals and medical centers near Augusta: VICTORIA FALLS (Nursing Home, about 9 miles away; ANDOVER, KS)
LIFE CARE CENTER OF ANDOVER (Nursing Home, about 10 miles away; ANDOVER, KS)
KANSAS MEDICAL CENTER LLC (about 10 miles away; ANDOVER, KS)
LAKEPOINT NURSING AND REHAB CENTER OF EL DORADO (Nursing Home, about 11 miles away; EL DORADO, KS)
SUSAN B ALLEN MEMORIAL HOSPITAL (about 11 miles away; EL DORADO, KS)
SUSAN B. ALLEN DIALYSIS CENTER (Dialysis Facility, about 11 miles away; EL DORADO, KS)
FOUNTAINVIEW NURSING AND REHAB CENTER (Nursing Home, about 13 miles away; ROSE HILL, KS)
Colleges/universities with over 2000 students nearest to Augusta:
Butler Community College (about 10 miles; El Dorado, KS ; Full-time enrollment: 6,676)
Wichita Area Technical College (about 15 miles; Wichita, KS ; FT enrollment: 2,220)
Wichita State University (about 18 miles; Wichita, KS ; FT enrollment: 11,743)
Friends University (about 22 miles; Wichita, KS ; FT enrollment: 2,024)
Wichita Technical Institute (about 22 miles; Wichita, KS ; FT enrollment: 2,015)
Newman University (about 22 miles; Wichita, KS ; FT enrollment: 2,066)
Cowley County Community College (about 44 miles; Arkansas City, KS ; FT enrollment: 3,173)
Public high school in Augusta:
Public elementary/middle schools in Augusta: AUGUSTA MIDDLE SCHOOL Students: 463, Location: 1001 STATE ST, Grades: 6-8)EWALT ELEMENTARY Students: 414, Location: 2340 GREYHOUND DRIVE, Grades: PK-5)ROBINSON ELEM Students: 255, Location: 1301 HELEN, Grades: PK-5)GARFIELD ELEM Location: 1053 OSAGE, Grades: PK-5)
LINCOLN ELEM Location: 1812 CRON, Grades: PK-5)
Private elementary/middle school in Augusta: ST JAMES CATHOLIC SCHOOL Students: 117, Location: 1010 BELMONT AVE, Grades: PK-6)
See full list of schools located in Augusta Library in Augusta: AUGUSTA PUBLIC LIBRARY Operating income: $319,164; Location: 1609 STATE ST.; 29,760 books ; 106 e-books ; 475 audio materials ; 1,038 video materials ; 30 state licensed databases ; 90 print serial subscriptions )
User-submitted facts and corrections:
Augusta hospital is no londer in operation
The hospital on Dearbor is closed
We also have another school. Augusta Learning Center Located:512 S. Walnut
Notable locations in Augusta: (A) , Augusta Municipal Power Plant Number 1 (B) , Augusta Plaza (C) , Kansas Highway Patrol Troop F - Butler (D) , Augusta Public Library (E) , Augusta Historical Museum (F) , Augusta City Hall (G) , Augusta Chamber of Commerce (H) , Augusta Department of Safety (I) . Display/hide their locations on the map
Shopping Centers: (1) , Augusta Country Club Shopping Center (2) . Display/hide their locations on the map
Churches in Augusta include: (A) , Lakecrest Bible Baptist Church (B) , Victory Worship Center (C) , First Christian Church of Augusta (D) , Augusta United Methodist Church (E) , Christ Lutheran Church (F) , First Baptist Church of Augusta (G) , Church of Christ (H) , Augusta Church of the Nazarene (I) . Display/hide their locations on the map
Cemetery: (1) . Display/hide its location on the map
Reservoirs: (A) , Augusta Lake (B) . Display/hide their locations on the map
Parks in Augusta include: (1) , Garvin Park (2) , Butler County State Park (3) . Display/hide their locations on the map
Tourist attraction: (1) . Display/hide its approximate location on the map
Hotels: (1) , Lehr's Motel (212 West 7th Avenue) (2) . Display/hide their approximate locations on the map
Birthplace of: Charles T. Payne - Soilder, Kyle Taylor - College basketball player (Kansas State Wildcats).
Butler County has a predicted average indoor radon screening level between 2 and 4 pCi/L (pico curies per liter) - Moderate Potential Drinking water stations with addresses in Augusta and their reported violations in the past:
AUGUSTA, CITY OF (Population served: 9,217, Surface water):
Past health violations:
MCL, Monthly (TCR) - In DEC-2007, Contaminant: Coliform. Follow-up actions: St Public Notif requested (DEC-17-2007), St Violation/Reminder Notice (DEC-17-2007), St Compliance Meeting conducted (JAN-10-2008), St Public Notif received (JAN-23-2008), St Compliance achieved (JAN-31-2008)
Past monitoring violations:
Monitoring, Routine (IDSE) - In APR-02-2008, Contaminant: DBP STAGE 2. Follow-up actions: Fed Violation/Reminder Notice (MAY-02-2008), Fed Compliance achieved (MAY-12-2008)
Treatment Technique Precursor Removal - Between OCT-2007 and DEC-2007, Contaminant: CARBON, TOTAL. Follow-up actions: St Public Notif requested (JAN-28-2008), St Violation/Reminder Notice (JAN-28-2008), St Compliance achieved (MAR-30-2008)
Treatment Technique Precursor Removal - Between JUL-2007 and SEP-2007, Contaminant: CARBON, TOTAL. Follow-up actions: St Public Notif requested (OCT-25-2007), St Violation/Reminder Notice (OCT-25-2007), St Public Notif received (NOV-26-2007), St Compliance achieved (MAR-30-2008)
Treatment Technique Precursor Removal - Between APR-2006 and JUN-2006, Contaminant: CARBON, TOTAL. Follow-up actions: St Public Notif requested (AUG-03-2006), St Violation/Reminder Notice (AUG-03-2006), St Public Notif received (SEP-11-2006), St Compliance achieved (SEP-30-2006)
Treatment Technique Precursor Removal - Between OCT-2005 and DEC-2005, Contaminant: CARBON, TOTAL. Follow-up actions: St Public Notif requested (JAN-31-2006), St Violation/Reminder Notice (JAN-31-2006), St Public Notif received (MAR-15-2006), St Compliance achieved (2 times from MAY-04-2006 to SEP-30-2006)
One minor monitoring violation
2 other older monitoring violations
Population served: 1,940, Purch surface water):
Past health violations:
MCL, Monthly (TCR) - In SEP-2012, Contaminant: Coliform. Follow-up actions: St Public Notif requested (SEP-14-2012), St Violation/Reminder Notice (SEP-14-2012), St Compliance achieved (OCT-31-2012), St Public Notif received (JUN-26-2013)
MCL, Monthly (TCR) - In AUG-2012, Contaminant: Coliform. Follow-up actions: St Public Notif requested (SEP-14-2012), St Violation/Reminder Notice (SEP-14-2012), St Compliance achieved (OCT-31-2012), St Public Notif received (JUN-26-2013)
MCL, Monthly (TCR) - In JUL-2006, Contaminant: Coliform. Follow-up actions: St Public Notif requested (AUG-17-2006), St Violation/Reminder Notice (AUG-17-2006), St Compliance achieved (AUG-31-2006), St Public Notif received (SEP-25-2006)
Past monitoring violations:
Monitoring and Reporting (DBP) - In OCT-2013, Contaminant: Total Haloacetic Acids (HAA5). Follow-up actions: St Violation/Reminder Notice (FEB-10-2014), St Public Notif requested (FEB-10-2014)
Monitoring and Reporting (DBP) - In OCT-2013, Contaminant: TTHM. Follow-up actions: St Violation/Reminder Notice (FEB-10-2014), St Public Notif requested (FEB-10-2014)
Failure Submit IDSE/Subpart V Plan Rpt - In JUL-02-2010, Contaminant: DBP STAGE 2. Follow-up actions: Fed FAO issued (DEC-20-2010), Fed Public Notif requested (DEC-20-2010), Fed Compliance achieved (JUL-11-2011)
Monitoring, Routine (IDSE) - Between APR-2009 and MAR-2010, Contaminant: Total Haloacetic Acids (HAA5). Follow-up actions: Fed FAO issued (DEC-20-2010), Fed Public Notif requested (DEC-20-2010), Fed Compliance achieved (JUL-11-2011)
Monitoring, Routine (IDSE) - Between APR-2009 and MAR-2010, Contaminant: TTHM. Follow-up actions: Fed FAO issued (DEC-20-2010), Fed Public Notif requested (DEC-20-2010), Fed Compliance achieved (JUL-11-2011)
One routine major monitoring violation
One minor monitoring violation
One other older monitoring violation
Drinking water stations with addresses in Augusta that have no violations reported:
WHEATSTATE CAMP (Population served: 25, Primary Water Source Type: Groundwater)
Average household size: This city:
2.5 peopleKansas:
2.5 people
Percentage of family households: This city:
66.7%Whole state:
66.0%
Percentage of households with unmarried partners: This city:
5.5%Whole state:
5.8%
Likely homosexual households (counted as self-reported same-sex unmarried-partner households)
Lesbian couples: 0.3% of all households Gay men: 0.0% of all households
104 people in nursing facilities/skilled-nursing facilities in 2010people in nursing homes in 2000people in other noninstitutional group quarters in 2000
Banks with branches in Augusta (2011 data):
Emprise Bank: Augusta - Downtown, Augusta - West, Augusta - Country Club. Info updated 2011/04/13: Bank assets: $1,461.9 mil, Deposits: $1,282.4 mil, headquarters in Wichita, KS, positive income , Commercial Lending Specialization, 42 total offices , Holding Company: Emprise Financial Corporation
Rose Hill Bank: Augusta Branch at 133 East 7th Street, branch established on 2000/06/12. Info updated 2010/06/16: Bank assets: $267.3 mil, Deposits: $237.0 mil, headquarters in Rose Hill, KS, positive income , Commercial Lending Specialization, 4 total offices , Holding Company: American State Bancshares, Inc.
Bank of the West: Augusta at 1420 North Ohio, branch established on 1925/01/01. Info updated 2009/11/16: Bank assets: $62,408.3 mil, Deposits: $43,995.2 mil, headquarters in San Francisco, CA, positive income , 647 total offices , Holding Company: Bnp Paribas
Verus Bank: Augusta Branch at 2330 North Ohio Street, branch established on 2004/04/22. Info updated 2012/01/05: Bank assets: $115.8 mil, Deposits: $103.9 mil, headquarters in Derby, KS, positive income , 6 total offices , Holding Company: First Team Resources Corporation
Bank of America, National Association: Augusta Branch at 645 State Street, branch established on 1959/01/30. Info updated 2009/11/18: Bank assets: $1,451,969.3 mil, Deposits: $1,077,176.8 mil, headquarters in Charlotte, NC, positive income , 5782 total offices , Holding Company: Bank Of America Corporation
Intrust Bank, National Association: 203 West 7th Street Branch at 112 West 7th Street, branch established on 1988/06/30. Info updated 2007/03/28: Bank assets: $4,066.0 mil, Deposits: $3,310.3 mil, headquarters in Wichita, KS, positive income , Commercial Lending Specialization, 48 total offices , Holding Company: Intrust Financial Corporation
For population 15 years and over in Augusta:
Never married: 24.6%Now married: 59.7%Separated: 0.3%Widowed: 7.1%Divorced: 8.2% For population 25 years and over in Augusta:
High school or higher: 93.9%Bachelor's degree or higher: 23.6%Graduate or professional degree: 7.7%Unemployed: 4.4%Mean travel time to work (commute): 24.8 minutes
Education Gini index (Inequality in education) Here:
8.8Kansas average:
11.5
Religion statistics for Augusta, KS (based on Butler County data)
Religion Adherents Congregations Evangelical Protestant 10,598 55 Mainline Protestant 8,866 26 Catholic 7,800 3 Other 571 4 None 38,045 -
Source: Clifford Grammich, Kirk Hadaway, Richard Houseal, Dale E.Jones, Alexei Krindatch, Richie Stanley and Richard H.Taylor. 2012. 2010 U.S.Religion Census: Religious Congregations & Membership Study. Association of Statisticians of American Religious Bodies. Jones, Dale E., et al. 2002. Congregations and Membership in the United States 2000. Nashville, TN: Glenmary Research Center. Graphs represent county-level data
Food Environment Statistics: Number of grocery stores : 7Butler County :
1.11 / 10,000 pop.Kansas :
1.96 / 10,000 pop.
Number of convenience stores (no gas) : 2This county :
0.32 / 10,000 pop.State :
0.51 / 10,000 pop.
Number of convenience stores (with gas) : 21Here :
3.34 / 10,000 pop.State :
3.84 / 10,000 pop.
Number of full-service restaurants : 33This county :
5.25 / 10,000 pop.State :
7.33 / 10,000 pop.
Adult diabetes rate : This county :
8.8%Kansas :
8.1%
Adult obesity rate : Butler County :
28.5%Kansas :
27.9%
Low-income preschool obesity rate : Health and Nutrition:
Average overall health of teeth and gums : People feeling badly about themselves : This city:
21.5%Kansas:
21.2%
People not drinking alcohol at all : Augusta:
11.8%Kansas:
10.5%
Average hours sleeping at night : Overweight people : This city:
34.4%State:
33.5%
General health condition : Average condition of hearing : Augusta:
77.8%Kansas:
78.6%
More about Health and Nutrition of Augusta, KS Residents
Local government employment and payroll (March 2022)
Function
Full-time employees
Monthly full-time payroll
Average yearly full-time wage
Part-time employees
Monthly part-time payroll
Police Protection - Officers
21 $108,375 $61,929 0 $0 Electric Power
15 $68,380 $54,704 1 $2,760 Water Supply
9 $32,286 $43,048 0 $0 Financial Administration
7 $28,219 $48,375 0 $0 Other and Unallocable
7 $29,153 $49,977 0 $0 Police - Other
7 $22,948 $39,339 0 $0 Streets and Highways
6 $19,667 $39,334 0 $0 Sewerage
6 $22,682 $45,364 0 $0 Solid Waste Management
6 $17,836 $35,672 0 $0 Other Government Administration
5 $33,740 $80,976 16 $1,674 Parks and Recreation
5 $19,575 $46,980 2 $2,980 Local Libraries
5 $18,139 $43,534 4 $2,250 Judicial and Legal
4 $10,708 $32,124 0 $0 Firefighters
3 $19,450 $77,800 0 $0 Airports
2 $9,172 $55,032 2 $4,064
Totals for Government
108 $460,330 $51,148 25 $13,728
Augusta government finances - Expenditure in 2021 (per resident):
Construction - Regular Highways: $45,000 ($4.88)
Current Operations - Electric Utilities: $8,447,000 ($915.96)
Water Utilities: $1,571,000 ($170.35)General - Other: $1,395,000 ($151.27)Police Protection: $894,000 ($96.94)Local Fire Protection: $894,000 ($96.94)Libraries: $825,000 ($89.46)Solid Waste Management: $684,000 ($74.17)Parks and Recreation: $610,000 ($66.15)Regular Highways: $585,000 ($63.44)Sewerage: $554,000 ($60.07)Central Staff Services: $529,000 ($57.36)Air Transportation: $509,000 ($55.19)Housing and Community Development: $265,000 ($28.74)Miscellaneous Commercial Activities - Other: $106,000 ($11.49)Judicial and Legal Services: $104,000 ($11.28)Health - Other: $67,000 ($7.27)Natural Resources - Other: $12,000 ($1.30)Electric Utilities - Interest on Debt: $96,000 ($10.41)
General - Interest on Debt: $186,000 ($20.17)
Other Capital Outlay - Sewerage: $631,000 ($68.42)
General - Other: $532,000 ($57.69)Electric Utilities: $267,000 ($28.95)Water Utilities: $241,000 ($26.13)Parks and Recreation: $209,000 ($22.66)Air Transportation: $148,000 ($16.05)Regular Highways: $77,000 ($8.35)Natural Resources - Other: $59,000 ($6.40)Solid Waste Management: $27,000 ($2.93)Central Staff Services: $13,000 ($1.41)Police Protection: $8,000 ($0.87)Miscellaneous Commercial Activities - Other: $5,000 ($0.54)Total Salaries and Wages: $216,000 ($23.42)
Water Utilities - Interest on Debt: $552,000 ($59.86)
Augusta government finances - Revenue in 2021 (per resident):
Charges - Sewerage: $1,336,000 ($144.87)
Solid Waste Management: $900,000 ($97.59)Air Transportation: $507,000 ($54.98)Parks and Recreation: $203,000 ($22.01)Other: $84,000 ($9.11)Miscellaneous Commercial Activities: $57,000 ($6.18)Regular Highways: $29,000 ($3.14)Federal Intergovernmental - Air Transportation: $31,000 ($3.36)
General Local Government Support: $28,000 ($3.04)Local Intergovernmental - Other: $87,000 ($9.43)
General Local Government Support: $54,000 ($5.86)Miscellaneous - Special Assessments: $281,000 ($30.47)
Interest Earnings: $126,000 ($13.66)Fines and Forfeits: $114,000 ($12.36)General Revenue - Other: $101,000 ($10.95)Donations From Private Sources: $10,000 ($1.08)Rents: $5,000 ($0.54)Sale of Property: $1,000 ($0.11)Revenue - Electric Utilities: $9,671,000 ($1048.69)
Water Utilities: $2,042,000 ($221.43)State Intergovernmental - Highways: $289,000 ($31.34)
General Local Government Support: $53,000 ($5.75)Other: $3,000 ($0.33)Sewerage: $2,000 ($0.22)Tax - Property: $4,223,000 ($457.93)
General Sales and Gross Receipts: $2,686,000 ($291.26)Occupation and Business License - Other: $247,000 ($26.78)Other License: $104,000 ($11.28)Other Selective Sales: $11,000 ($1.19)
Augusta government finances - Debt in 2021 (per resident):
Long Term Debt - Beginning Outstanding - Unspecified Public Purpose: $17,850,000 ($1935.59)
Outstanding Unspecified Public Purpose: $12,450,000 ($1350.03)Retired Unspecified Public Purpose: $5,400,000 ($585.56)
Augusta government finances - Cash and Securities in 2021 (per resident):
Bond Funds - Cash and Securities: $4,876,000 ($528.74)
Other Funds - Cash and Securities: $14,008,000 ($1518.98)
Sinking Funds - Cash and Securities: $87,000 ($9.43)
Businesses in Augusta, KS
Name Count Name Count
Ace Hardware 1 Nike 2 Chevrolet 1 Pizza Hut 1 Dairy Queen 1 SONIC Drive-In 1 FedEx 1 Subway 1 Ford 1 Taco Bell 1 H&R Block 1 U-Haul 1 Kroger 1 UPS 2 McDonald's 1 Walmart 1
Strongest AM radio stations in Augusta:
KFTI (1070 AM; 10 kW; WICHITA, KS; Owner: JOURNAL BROADCAST CORPORATION)
KFH (1330 AM; 5 kW; WICHITA, KS; Owner: ENTERCOM WICHITA LICENSE, LLC)
KQAM (1480 AM; 5 kW; WICHITA, KS; Owner: ABC, INC.)
KMYR (1410 AM; 5 kW; WICHITA, KS; Owner: AGAPE COMMUNICATIONS, INC.)
KAHS (1360 AM; 1 kW; EL DORADO, KS; Owner: REUNION BROADCASTING L.L.C.)
KRMG (740 AM; 50 kW; TULSA, OK; Owner: CXR HOLDINGS, INC.)
KFAQ (1170 AM; 50 kW; TULSA, OK; Owner: JOURNAL BROADCAST CORPORATION)
WHB (810 AM; 50 kW; KANSAS CITY, MO; Owner: UNION BROADCASTING, INC.)
KGGF (690 AM; 10 kW; COFFEYVILLE, KS; Owner: KGGF-KUSN, INC.)
KNSS (1240 AM; 1 kW; WICHITA, KS; Owner: ENTERCOM WICHITA LICENSE, LLC)
KTBZ (1430 AM; 25 kW; TULSA, OK; Owner: CLEAR CHANNEL BROADCASTING LICENSES, INC.)
KOMA (1520 AM; 50 kW; OKLAHOMA CITY, OK; Owner: RENDA BROADCASTING CORP. OF NEVADA)
KMUS (1380 AM; 20 kW; MUSKOGEE, OK; Owner: ABC, INC.)
Strongest FM radio stations in Augusta:
KTLI (99.1 FM; EL DORADO, KS; Owner: ADONAI RADIO GROUP, INC.)
KFXJ (104.5 FM; AUGUSTA, KS; Owner: JOURNAL BROADCAST CORPORATION)
KYQQ (106.5 FM; ARKANSAS CITY, KS; Owner: JOURNAL BROADCAST CORPORATION)
KEYN-FM (103.7 FM; WICHITA, KS; Owner: ENTERCOM WICHITA LICENSE, LLC)
KFDI-FM (101.3 FM; WICHITA, KS; Owner: JOURNAL BROADCAST CORPORATION)
KRBB (97.9 FM; WICHITA, KS; Owner: CAPSTAR TX LIMITED PARTNERSHIP)
KFBZ (105.3 FM; HAYSVILLE, KS; Owner: ENTERCOM WICHITA LICENSE, LLC)
KZSN (102.1 FM; HUTCHINSON, KS; Owner: CAPSTAR TX LIMITED PARTNERSHIP)
KICT-FM (95.1 FM; WICHITA, KS; Owner: JOURNAL BROADCAST CORPORATION)
KRZZ-FM (96.3 FM; DERBY, KS; Owner: CAPSTAR TX LIMITED PARTNERSHIP)
KKRD (107.3 FM; WICHITA, KS; Owner: CAPSTAR TX LIMITED PARTNERSHIP)
KMUW (89.1 FM; WICHITA, KS; Owner: WICHITA STATE UNIVERSITY)
KBDD (91.9 FM; WINFILED, KS; Owner: AMERICAN FAMILY ASSOCIATION)
KANR (92.7 FM; BELLE PLAINE, KS; Owner: DANIEL D. SMITH)
KMXW (92.3 FM; NEWTON, KS; Owner: JOURNAL BROADCAST CORPORATION)
KDGS (93.9 FM; ANDOVER, KS; Owner: ENTERCOM WICHITA LICENSE, LLC)
KBTL (88.1 FM; EL DORADO, KS; Owner: BUTLER COUNTY COMMUNITY COLLEGE)
TV broadcast stations around Augusta:
KSNW (Channel 3; WICHITA, KS; Owner: EMMIS TELEVISION LICENSE CORPORATION OF WICHITA)
KTQW-LP (Channel 53; WICHITA, KS; Owner: KNOWLEDGE L.C.)
KSAS-TV (Channel 24; WICHITA, KS; Owner: CLEAR CHANNEL BROADCASTING LICENSES, INC.)
KWCV (Channel 33; WICHITA, KS; Owner: WLBB BROADCASTING, L.L.C.)
KAKE-TV (Channel 10; WICHITA, KS; Owner: GRAY MIDAMERICA TV LICENSEE CORP.)
KSCC (Channel 36; HUTCHINSON, KS; Owner: MERCURY BROADCASTING COMPANY, INC.)
KCTU-LP (Channel 55; WICHITA, KS; Owner: RIVER CITY BROADCASTING CORP.)
KSMI-LP (Channel 51; WICHITA, KS; Owner: RIVER CITY BROADCASTING CORP.)
KWCH-TV (Channel 12; HUTCHINSON, KS; Owner: MEDIA GENERAL BROADCASTING OF SO. CAROLINA HOLDINGS, INC.)
KFVT-LP (Channel 40; WICHITA, KS; Owner: LOCKE SUPPLY CO.)
K59DA (Channel 59; WICHITA, KS; Owner: TRINITY BROADCASTING NETWORK)
K15DD (Channel 15; WICHITA, KS; Owner: VENTANA TELEVISION, INC.)
Augusta fatal accident statistics for 1975 - 2021
Augusta fatal accident list:
Jul 26, 2012 02:22 PM, Us-54, Lat: 37.705478, Lon: -96.844567, Vehicles: 1, Persons: 2, Pedestrians: 1, Fatalities: 1Lat: 37.678940, Lon: -96.966730, Vehicles: 2, Persons: 2, Fatalities: 1, Drunk persons involved: 1Vehicles: 1, Persons: 2, Pedestrians: 1, Fatalities: 1Vehicles: 1, Persons: 2, Fatalities: 1, Drunk persons involved: 1Vehicles: 2, Persons: 3, Fatalities: 1Vehicles: 1, Persons: 2, Fatalities: 1
National Bridge Inventory (NBI) Statistics 51 Number of bridges942ft / 287m Total length $605,000 Total costs125,140 Total average daily traffic18,632 Total average daily truck traffic
New bridges - historical statistics
2 1900-1909 1 1920-1929 4 1930-1939 2 1940-1949 12 1950-1959 5 1960-1969 3 1970-1979 12 1980-1989 4 1990-1999 5 2000-2009 1 2010-2019
See full National Bridge Inventory statistics for Augusta, KS
Home Mortgage Disclosure Act Aggregated Statistics For Year 2009(Based on 5 partial tracts) A) FHA, FSA/RHS & VA B) Conventional C) Refinancings D) Home Improvement Loans F) Non-occupant Loans on G) Loans On Manufactured Number Average Value Number Average Value Number Average Value Number Average Value Number Average Value Number Average Value
LOANS ORIGINATED 31 $98,546 17 $98,915 61 $89,512 7 $38,049 16 $59,774 1 $34,480 APPLICATIONS APPROVED, NOT ACCEPTED 0 $0 4 $55,132 7 $102,163 1 $41,400 1 $28,320 2 $59,805 APPLICATIONS DENIED 8 $83,166 7 $83,574 18 $99,571 5 $21,788 1 $116,170 2 $47,195 APPLICATIONS WITHDRAWN 4 $87,102 0 $0 17 $103,839 1 $6,740 1 $79,820 1 $178,870 FILES CLOSED FOR INCOMPLETENESS 0 $0 0 $0 1 $111,780 0 $0 0 $0 0 $0
Aggregated Statistics For Year 2008(Based on 5 partial tracts) A) FHA, FSA/RHS & VA B) Conventional C) Refinancings D) Home Improvement Loans F) Non-occupant Loans on G) Loans On Manufactured Number Average Value Number Average Value Number Average Value Number Average Value Number Average Value Number Average Value
LOANS ORIGINATED 36 $94,015 34 $92,207 46 $75,681 19 $22,280 22 $60,000 2 $28,840 APPLICATIONS APPROVED, NOT ACCEPTED 1 $25,240 6 $55,602 4 $71,540 2 $8,545 2 $53,785 3 $32,527 APPLICATIONS DENIED 6 $87,302 14 $50,219 26 $81,351 12 $32,677 3 $46,430 9 $34,646 APPLICATIONS WITHDRAWN 4 $86,635 1 $114,640 10 $90,870 2 $44,180 0 $0 0 $0 FILES CLOSED FOR INCOMPLETENESS 0 $0 1 $40,460 2 $98,195 0 $0 0 $0 0 $0
Aggregated Statistics For Year 2007(Based on 5 partial tracts) A) FHA, FSA/RHS & VA B) Conventional C) Refinancings D) Home Improvement Loans E) Loans on Dwellings For 5+ Families F) Non-occupant Loans on G) Loans On Manufactured Number Average Value Number Average Value Number Average Value Number Average Value Number Average Value Number Average Value Number Average Value
LOANS ORIGINATED 16 $87,587 78 $76,523 56 $71,891 20 $28,460 1 $515,300 24 $64,830 6 $26,482 APPLICATIONS APPROVED, NOT ACCEPTED 0 $0 10 $71,127 6 $64,113 3 $11,077 0 $0 2 $40,910 1 $60,200 APPLICATIONS DENIED 5 $85,648 18 $59,412 28 $76,316 13 $24,465 0 $0 1 $81,320 5 $32,380 APPLICATIONS WITHDRAWN 0 $0 6 $87,945 8 $89,739 1 $17,670 0 $0 1 $74,820 1 $37,180 FILES CLOSED FOR INCOMPLETENESS 1 $38,170 1 $177,580 3 $97,093 1 $51,610 0 $0 0 $0 0 $0
Aggregated Statistics For Year 2006(Based on 5 partial tracts) A) FHA, FSA/RHS & VA B) Conventional C) Refinancings D) Home Improvement Loans E) Loans on Dwellings For 5+ Families F) Non-occupant Loans on G) Loans On Manufactured Number Average Value Number Average Value Number Average Value Number Average Value Number Average Value Number Average Value Number Average Value
LOANS ORIGINATED 15 $76,535 85 $65,341 58 $74,100 14 $19,749 1 $35,550 32 $48,474 7 $44,771 APPLICATIONS APPROVED, NOT ACCEPTED 1 $69,320 11 $69,604 14 $79,770 2 $66,530 0 $0 2 $33,555 4 $54,200 APPLICATIONS DENIED 1 $74,340 12 $71,398 36 $80,930 13 $37,876 0 $0 2 $65,555 3 $58,560 APPLICATIONS WITHDRAWN 2 $71,285 10 $56,663 20 $80,481 1 $68,910 0 $0 2 $56,650 1 $15,280 FILES CLOSED FOR INCOMPLETENESS 1 $70,810 2 $103,210 3 $120,313 1 $32,020 0 $0 0 $0 0 $0
Aggregated Statistics For Year 2005(Based on 5 partial tracts) A) FHA, FSA/RHS & VA B) Conventional C) Refinancings D) Home Improvement Loans F) Non-occupant Loans on G) Loans On Manufactured Number Average Value Number Average Value Number Average Value Number Average Value Number Average Value Number Average Value
LOANS ORIGINATED 12 $81,420 74 $68,294 60 $80,973 11 $24,135 21 $65,160 3 $40,103 APPLICATIONS APPROVED, NOT ACCEPTED 0 $0 12 $66,293 6 $101,823 1 $23,310 0 $0 3 $52,207 APPLICATIONS DENIED 1 $62,500 20 $50,702 44 $77,616 12 $22,872 2 $55,025 9 $46,176 APPLICATIONS WITHDRAWN 1 $104,140 9 $89,661 29 $82,354 2 $49,035 3 $99,953 1 $24,740 FILES CLOSED FOR INCOMPLETENESS 0 $0 3 $45,877 2 $122,785 0 $0 0 $0 0 $0
Aggregated Statistics For Year 2004(Based on 5 partial tracts) A) FHA, FSA/RHS & VA B) Conventional C) Refinancings D) Home Improvement Loans E) Loans on Dwellings For 5+ Families F) Non-occupant Loans on G) Loans On Manufactured Number Average Value Number Average Value Number Average Value Number Average Value Number Average Value Number Average Value Number Average Value
LOANS ORIGINATED 16 $83,174 60 $64,076 75 $72,919 14 $27,674 1 $262,040 30 $51,786 4 $37,595 APPLICATIONS APPROVED, NOT ACCEPTED 1 $65,510 9 $63,691 17 $83,512 4 $32,068 0 $0 1 $26,770 3 $49,260 APPLICATIONS DENIED 2 $56,905 28 $66,181 48 $74,342 21 $36,444 0 $0 4 $53,298 14 $47,450 APPLICATIONS WITHDRAWN 1 $66,360 4 $77,845 23 $84,476 4 $47,848 0 $0 0 $0 2 $47,755 FILES CLOSED FOR INCOMPLETENESS 0 $0 1 $82,900 9 $76,357 0 $0 0 $0 0 $0 0 $0
Aggregated Statistics For Year 2003(Based on 5 partial tracts) A) FHA, FSA/RHS & VA B) Conventional C) Refinancings D) Home Improvement Loans E) Loans on Dwellings For 5+ Families F) Non-occupant Loans on Number Average Value Number Average Value Number Average Value Number Average Value Number Average Value Number Average Value
LOANS ORIGINATED 16 $72,641 54 $61,171 122 $71,031 10 $7,818 2 $384,105 31 $46,817 APPLICATIONS APPROVED, NOT ACCEPTED 1 $69,570 6 $50,345 9 $76,282 2 $9,255 0 $0 1 $40,110 APPLICATIONS DENIED 1 $69,460 17 $48,666 37 $73,832 3 $17,087 0 $0 2 $40,125 APPLICATIONS WITHDRAWN 1 $89,730 4 $65,125 17 $72,964 0 $0 0 $0 1 $27,090 FILES CLOSED FOR INCOMPLETENESS 0 $0 2 $75,040 5 $72,654 0 $0 0 $0 0 $0
Aggregated Statistics For Year 2002(Based on 5 partial tracts) A) FHA, FSA/RHS & VA B) Conventional C) Refinancings D) Home Improvement Loans F) Non-occupant Loans on Number Average Value Number Average Value Number Average Value Number Average Value Number Average Value
LOANS ORIGINATED 15 $70,107 53 $61,941 89 $82,441 15 $11,381 27 $47,608 APPLICATIONS APPROVED, NOT ACCEPTED 0 $0 9 $50,172 14 $62,002 2 $37,430 3 $45,897 APPLICATIONS DENIED 3 $63,317 21 $40,661 23 $64,334 9 $10,308 2 $34,500 APPLICATIONS WITHDRAWN 0 $0 7 $69,720 19 $85,048 1 $9,240 1 $87,200 FILES CLOSED FOR INCOMPLETENESS 1 $40,640 4 $58,420 5 $86,774 0 $0 1 $47,860
Aggregated Statistics For Year 2001(Based on 5 partial tracts) A) FHA, FSA/RHS & VA B) Conventional C) Refinancings D) Home Improvement Loans F) Non-occupant Loans on Number Average Value Number Average Value Number Average Value Number Average Value Number Average Value
LOANS ORIGINATED 28 $74,372 49 $63,704 99 $64,844 16 $14,092 28 $40,427 APPLICATIONS APPROVED, NOT ACCEPTED 1 $82,540 11 $52,109 12 $68,701 1 $7,910 2 $43,625 APPLICATIONS DENIED 2 $129,535 37 $43,353 29 $67,018 9 $14,863 3 $35,610 APPLICATIONS WITHDRAWN 1 $69,350 4 $56,880 22 $73,509 2 $20,790 3 $57,707 FILES CLOSED FOR INCOMPLETENESS 0 $0 2 $77,730 6 $61,128 1 $12,310 0 $0
Aggregated Statistics For Year 2000(Based on 5 partial tracts) A) FHA, FSA/RHS & VA B) Conventional C) Refinancings D) Home Improvement Loans E) Loans on Dwellings For 5+ Families F) Non-occupant Loans on Number Average Value Number Average Value Number Average Value Number Average Value Number Average Value Number Average Value
LOANS ORIGINATED 26 $70,438 64 $60,612 44 $55,707 21 $13,670 1 $43,570 22 $40,358 APPLICATIONS APPROVED, NOT ACCEPTED 1 $29,770 15 $57,851 5 $49,314 2 $12,870 0 $0 2 $27,445 APPLICATIONS DENIED 2 $56,880 43 $47,910 21 $50,658 7 $16,497 0 $0 3 $41,590 APPLICATIONS WITHDRAWN 1 $52,150 3 $42,570 18 $53,863 1 $12,620 0 $0 2 $30,000 FILES CLOSED FOR INCOMPLETENESS 0 $0 1 $60,230 3 $36,517 0 $0 0 $0 0 $0
Aggregated Statistics For Year 1999(Based on 5 partial tracts) A) FHA, FSA/RHS & VA B) Conventional C) Refinancings D) Home Improvement Loans E) Loans on Dwellings For 5+ Families F) Non-occupant Loans on Number Average Value Number Average Value Number Average Value Number Average Value Number Average Value Number Average Value
LOANS ORIGINATED 22 $72,103 79 $52,497 81 $51,021 26 $11,587 1 $72,640 35 $34,185 APPLICATIONS APPROVED, NOT ACCEPTED 0 $0 18 $48,161 8 $60,092 2 $65,625 0 $0 1 $41,470 APPLICATIONS DENIED 4 $66,792 69 $45,377 28 $50,171 9 $15,912 0 $0 3 $27,417 APPLICATIONS WITHDRAWN 3 $56,127 6 $35,750 13 $49,247 0 $0 0 $0 2 $17,500 FILES CLOSED FOR INCOMPLETENESS 0 $0 1 $46,000 2 $77,160 0 $0 0 $0 0 $0
Detailed HMDA statistics for the following Tracts:
0202.03
, 0207.00 , 0208.00
Private Mortgage Insurance Companies Aggregated Statistics For Year 2009(Based on 5 partial tracts) A) Conventional B) Refinancings Number Average Value Number Average Value
LOANS ORIGINATED 1 $235,240 3 $141,147 APPLICATIONS APPROVED, NOT ACCEPTED 1 $163,370 1 $46,920 APPLICATIONS DENIED 0 $0 1 $84,730 APPLICATIONS WITHDRAWN 0 $0 0 $0 FILES CLOSED FOR INCOMPLETENESS 0 $0 0 $0
Aggregated Statistics For Year 2008(Based on 5 partial tracts) A) Conventional B) Refinancings C) Non-occupant Loans on Number Average Value Number Average Value Number Average Value
LOANS ORIGINATED 15 $88,989 5 $83,180 2 $68,475 APPLICATIONS APPROVED, NOT ACCEPTED 2 $108,185 1 $111,030 0 $0 APPLICATIONS DENIED 1 $81,540 0 $0 1 $81,540 APPLICATIONS WITHDRAWN 1 $147,000 0 $0 0 $0 FILES CLOSED FOR INCOMPLETENESS 0 $0 0 $0 0 $0
Aggregated Statistics For Year 2007(Based on 5 partial tracts) A) Conventional B) Refinancings C) Non-occupant Loans on Number Average Value Number Average Value Number Average Value
LOANS ORIGINATED 33 $83,661 9 $96,156 2 $39,405 APPLICATIONS APPROVED, NOT ACCEPTED 2 $107,540 1 $37,900 0 $0 APPLICATIONS DENIED 1 $53,570 0 $0 0 $0 APPLICATIONS WITHDRAWN 1 $52,430 0 $0 0 $0 FILES CLOSED FOR INCOMPLETENESS 0 $0 0 $0 0 $0
Aggregated Statistics For Year 2006(Based on 5 partial tracts) A) Conventional B) Refinancings C) Non-occupant Loans on Number Average Value Number Average Value Number Average Value
LOANS ORIGINATED 20 $75,062 9 $80,106 4 $42,702 APPLICATIONS APPROVED, NOT ACCEPTED 1 $86,580 3 $90,637 0 $0 APPLICATIONS DENIED 0 $0 0 $0 0 $0 APPLICATIONS WITHDRAWN 1 $83,460 0 $0 0 $0 FILES CLOSED FOR INCOMPLETENESS 0 $0 0 $0 0 $0
Aggregated Statistics For Year 2005(Based on 5 partial tracts) A) Conventional B) Refinancings C) Non-occupant Loans on Number Average Value Number Average Value Number Average Value
LOANS ORIGINATED 16 $74,726 11 $81,040 3 $63,827 APPLICATIONS APPROVED, NOT ACCEPTED 6 $52,628 0 $0 0 $0 APPLICATIONS DENIED 1 $59,340 0 $0 0 $0 APPLICATIONS WITHDRAWN 1 $62,190 0 $0 0 $0 FILES CLOSED FOR INCOMPLETENESS 0 $0 0 $0 0 $0
Aggregated Statistics For Year 2004(Based on 5 partial tracts) A) Conventional B) Refinancings C) Non-occupant Loans on Number Average Value Number Average Value Number Average Value
LOANS ORIGINATED 16 $77,649 14 $85,075 5 $48,494 APPLICATIONS APPROVED, NOT ACCEPTED 2 $68,480 3 $81,387 0 $0 APPLICATIONS DENIED 0 $0 0 $0 0 $0 APPLICATIONS WITHDRAWN 0 $0 0 $0 0 $0 FILES CLOSED FOR INCOMPLETENESS 0 $0 0 $0 0 $0
Aggregated Statistics For Year 2003(Based on 5 partial tracts) A) Conventional B) Refinancings C) Non-occupant Loans on Number Average Value Number Average Value Number Average Value
LOANS ORIGINATED 16 $75,248 23 $84,991 2 $53,570 APPLICATIONS APPROVED, NOT ACCEPTED 2 $95,240 3 $106,087 0 $0 APPLICATIONS DENIED 0 $0 0 $0 0 $0 APPLICATIONS WITHDRAWN 0 $0 2 $80,410 1 $30,790 FILES CLOSED FOR INCOMPLETENESS 0 $0 0 $0 0 $0
Aggregated Statistics For Year 2002(Based on 5 partial tracts) A) Conventional B) Refinancings C) Non-occupant Loans on Number Average Value Number Average Value Number Average Value
LOANS ORIGINATED 16 $69,689 24 $99,500 3 $43,117 APPLICATIONS APPROVED, NOT ACCEPTED 2 $75,735 3 $84,857 1 $35,710 APPLICATIONS DENIED 0 $0 0 $0 0 $0 APPLICATIONS WITHDRAWN 0 $0 2 $78,760 0 $0 FILES CLOSED FOR INCOMPLETENESS 0 $0 0 $0 0 $0
Aggregated Statistics For Year 2001(Based on 5 partial tracts) A) Conventional B) Refinancings C) Non-occupant Loans on Number Average Value Number Average Value Number Average Value
LOANS ORIGINATED 17 $66,151 15 $88,479 6 $48,730 APPLICATIONS APPROVED, NOT ACCEPTED 4 $57,108 1 $57,640 1 $52,950 APPLICATIONS DENIED 0 $0 1 $123,370 1 $55,410 APPLICATIONS WITHDRAWN 0 $0 0 $0 0 $0 FILES CLOSED FOR INCOMPLETENESS 0 $0 0 $0 0 $0
Aggregated Statistics For Year 2000(Based on 5 partial tracts) A) Conventional B) Refinancings C) Non-occupant Loans on Number Average Value Number Average Value Number Average Value
LOANS ORIGINATED 17 $78,208 4 $109,505 1 $41,020 APPLICATIONS APPROVED, NOT ACCEPTED 3 $49,193 1 $95,820 0 $0 APPLICATIONS DENIED 1 $70,930 0 $0 0 $0 APPLICATIONS WITHDRAWN 0 $0 0 $0 0 $0 FILES CLOSED FOR INCOMPLETENESS 0 $0 0 $0 0 $0
Aggregated Statistics For Year 1999(Based on 5 partial tracts) A) Conventional B) Refinancings C) Non-occupant Loans on Number Average Value Number Average Value Number Average Value
LOANS ORIGINATED 19 $78,328 5 $89,114 1 $15,680 APPLICATIONS APPROVED, NOT ACCEPTED 2 $76,095 1 $217,810 0 $0 APPLICATIONS DENIED 1 $66,990 0 $0 0 $0 APPLICATIONS WITHDRAWN 1 $52,860 0 $0 0 $0 FILES CLOSED FOR INCOMPLETENESS 0 $0 0 $0 0 $0
Detailed PMIC statistics for the following Tracts:
0202.03
, 0207.00 , 0208.00
Most common first names in Augusta, KS among deceased individuals Name Count Lived (average)
John 77 76.7 years Robert 62 72.7 years James 59 78.6 years Charles 57 76.5 years William 53 73.6 years Mary 48 81.0 years George 42 76.6 years Dorothy 31 76.6 years Raymond 29 76.7 years Walter 28 74.9 years
Most common last names in Augusta, KS among deceased individuals Last name Count Lived (average)
Smith 31 78.0 years Wilson 30 82.1 years Jones 25 79.9 years Davis 24 81.0 years Johnson 22 79.9 years Miller 22 73.8 years Williams 20 77.1 years Martin 19 81.4 years Clark 17 77.3 years Dennett 17 76.8 years
Augusta compared to Kansas state average:
Unemployed percentage significantly below state average. Black race population percentage significantly below state average. Hispanic race population percentage below state average. Foreign-born population percentage significantly below state average.
#95 on the list of "Top 101 cities with largest percentage of females in occupations: construction and extraction occupations (population 5,000+)"
#46 on the list of "Top 101 counties with the lowest ground withdrawal of fresh water for public supply (pop. 50,000+)"
#101 on the list of "Top 101 counties with highest percentage of residents voting for Romney (Republican) in the 2012 Presidential Election (pop. 50,000+)"
Top Patent Applicants
Robert Ray Wampler (4)
Michael J. Erwin (3)
Robert R. Wampler (2)
Luke E. Kelly (2)
Jeffrey D. Weide (2)
Britt Moore (2)
Kyle Bourget (2)
Courtnie R. Kingsley (1)
Peggy S. Hardison (1)
Debra A. Urbanek (1)
Total of 23 patent applications in 2008-2024.

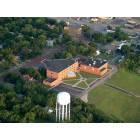
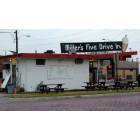
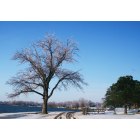

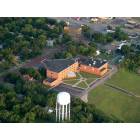
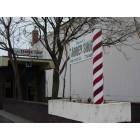
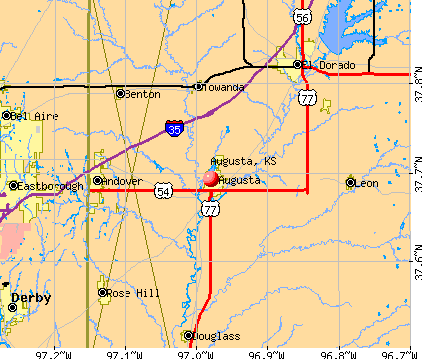


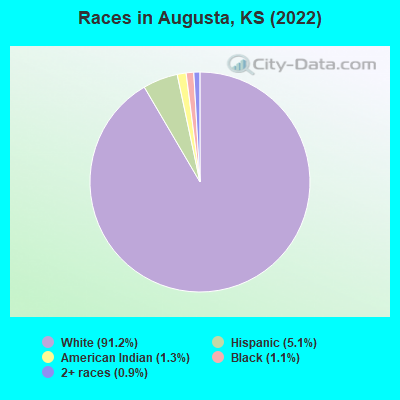
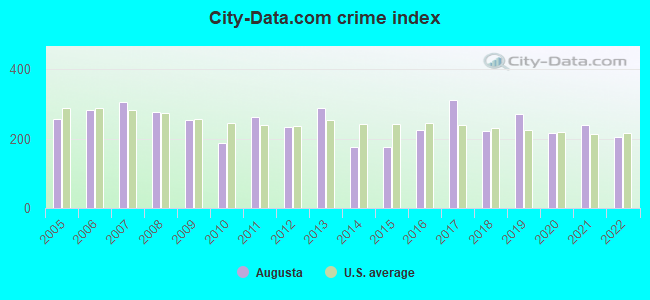
 Recent articles from our blog. Our writers, many of them Ph.D. graduates or candidates, create easy-to-read articles on a wide variety of topics.

 (19.5 miles
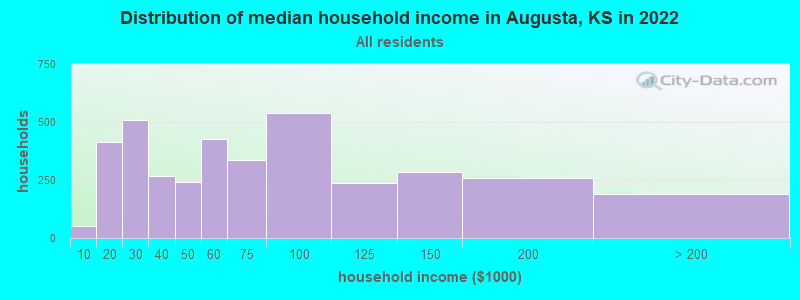
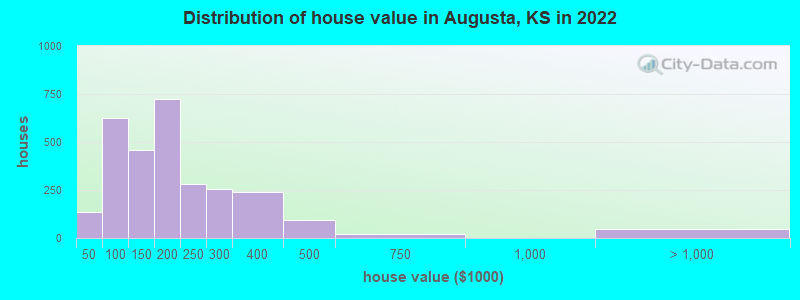
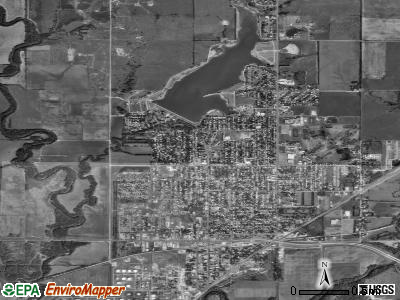
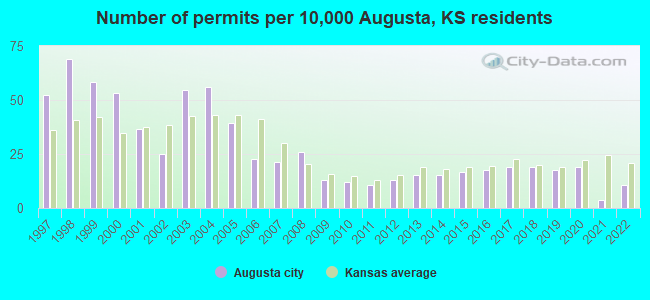
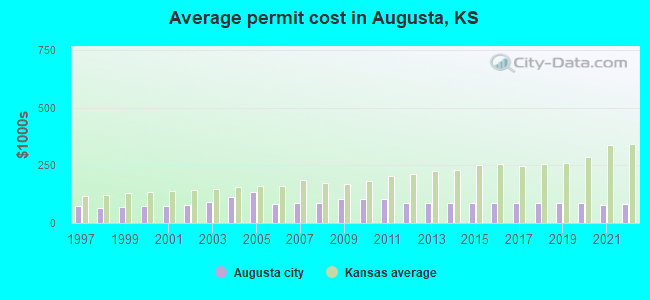
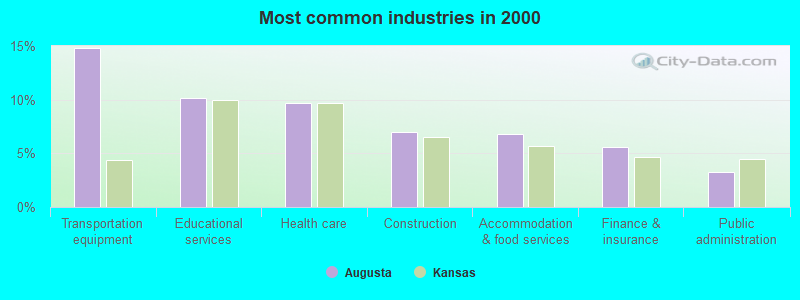
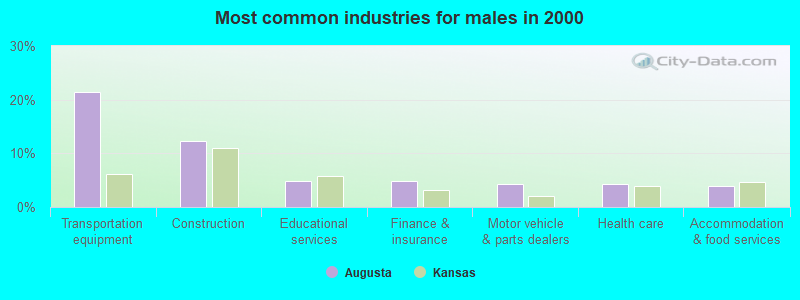
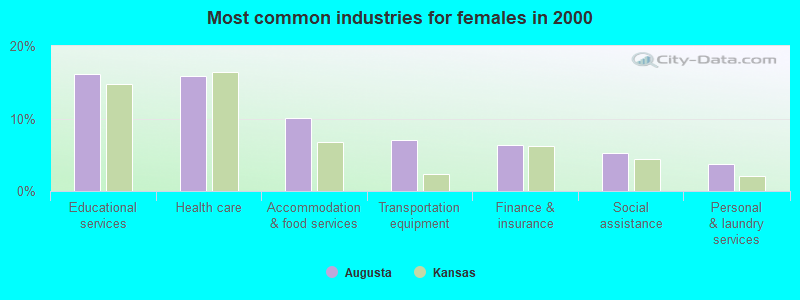
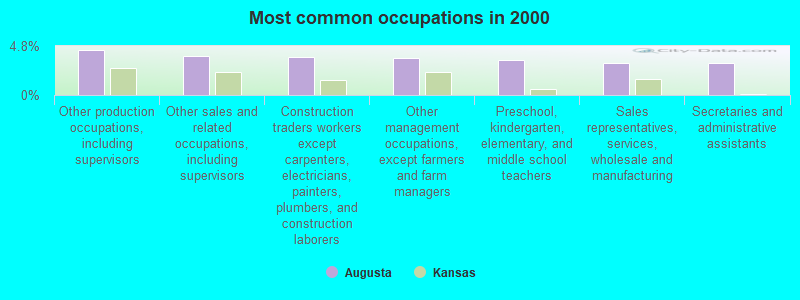
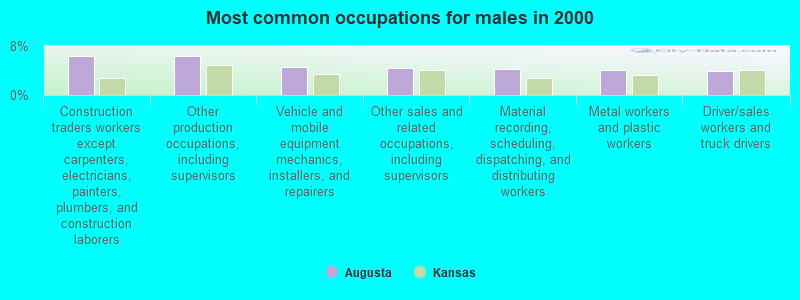
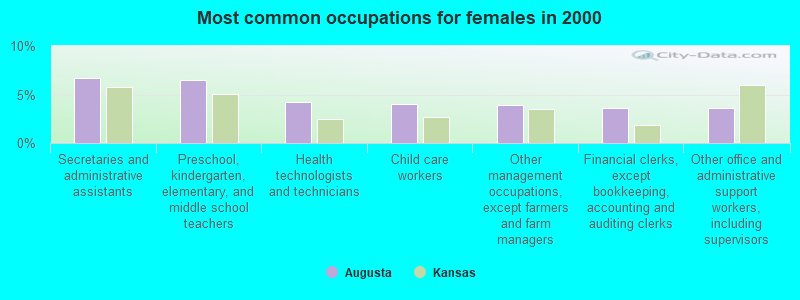
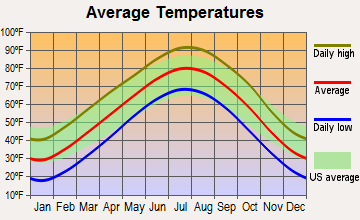
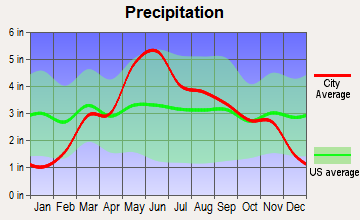
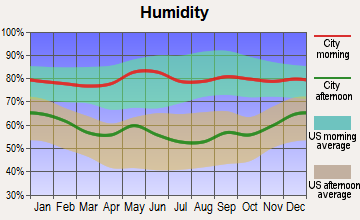
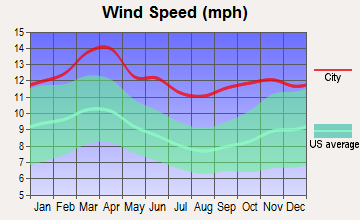
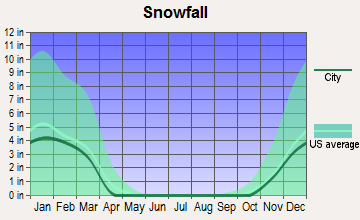
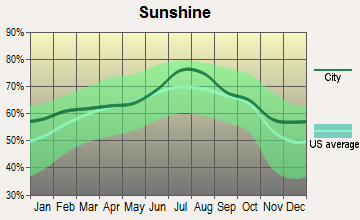
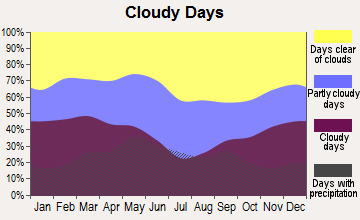


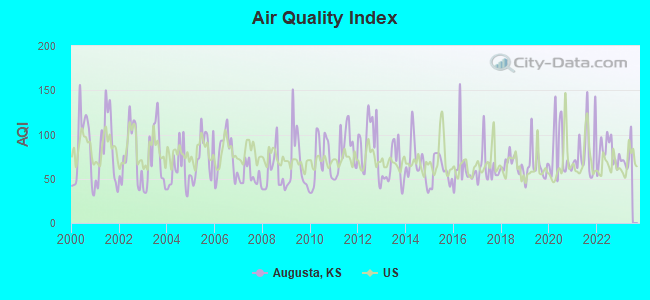
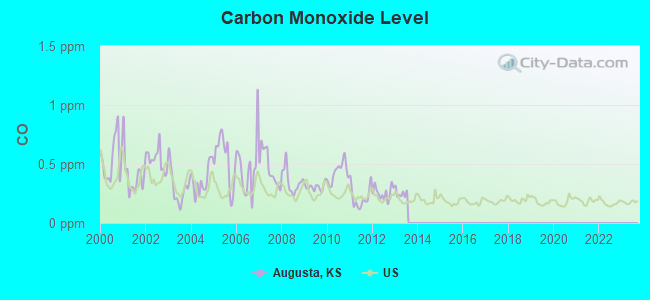
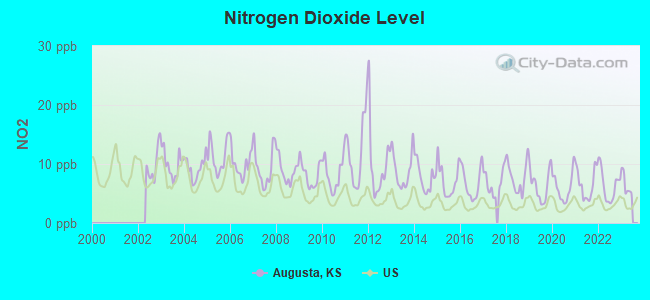
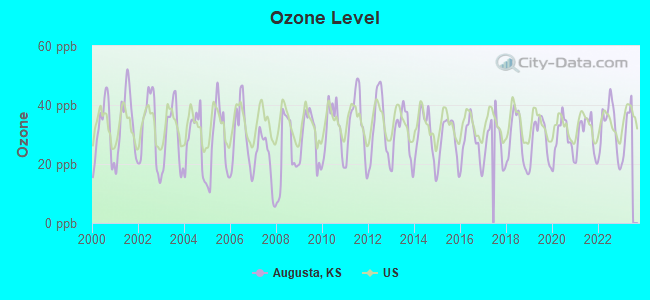
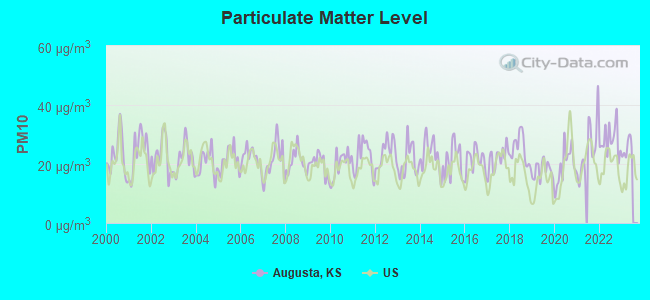
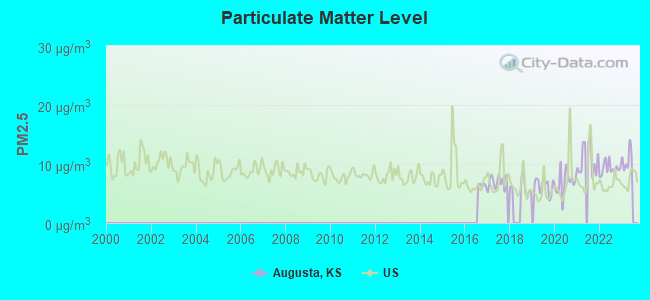
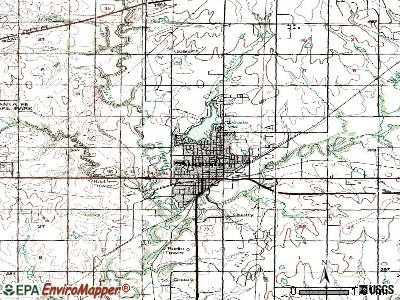
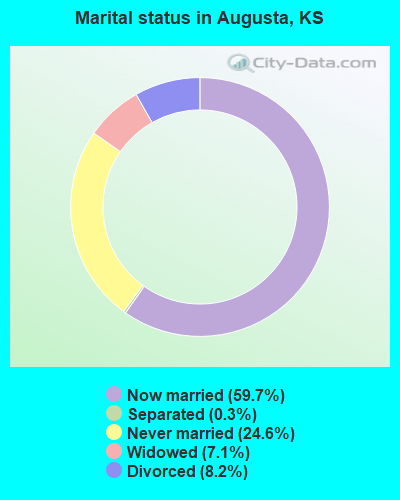
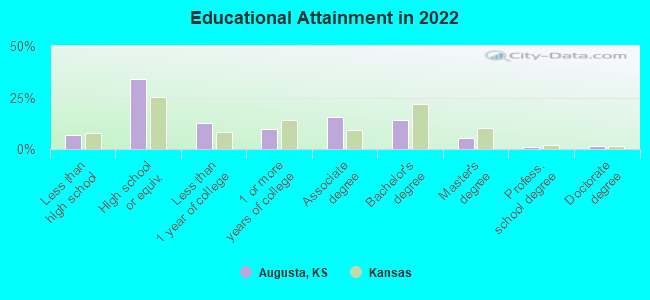
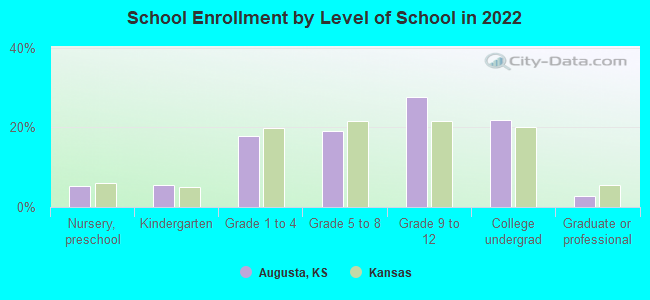
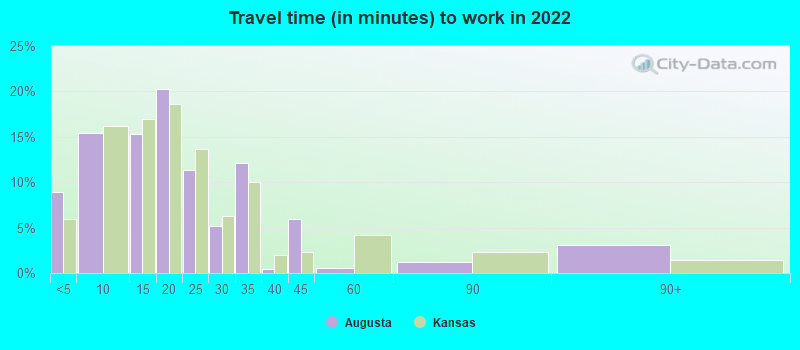
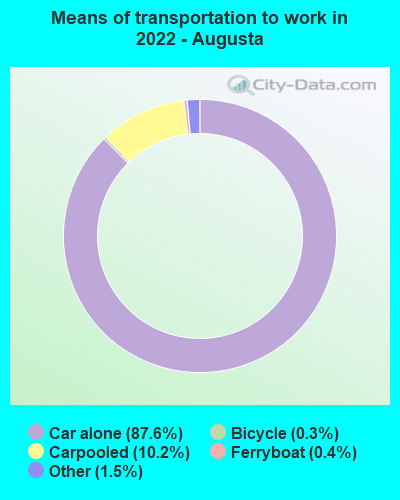
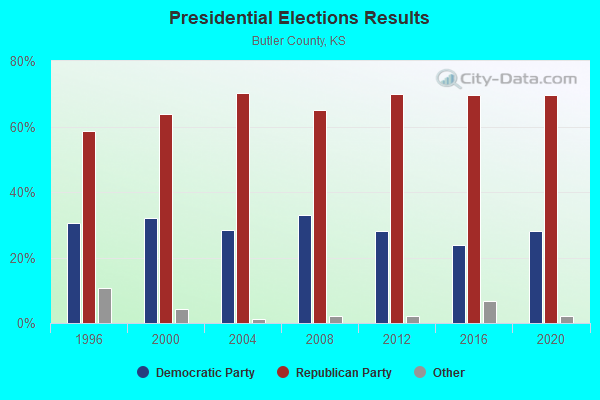
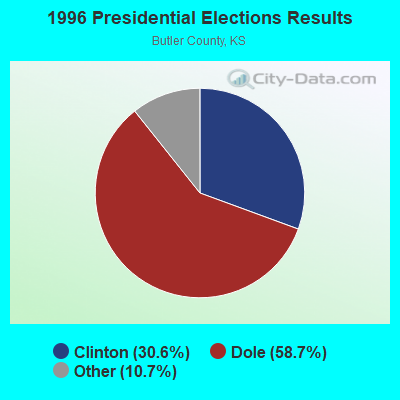

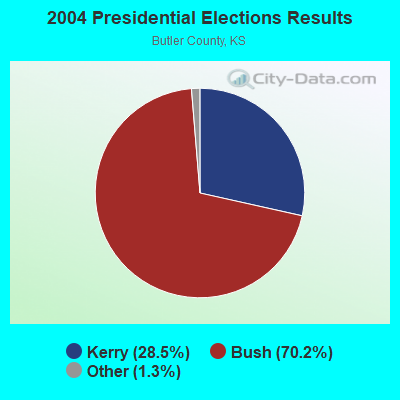
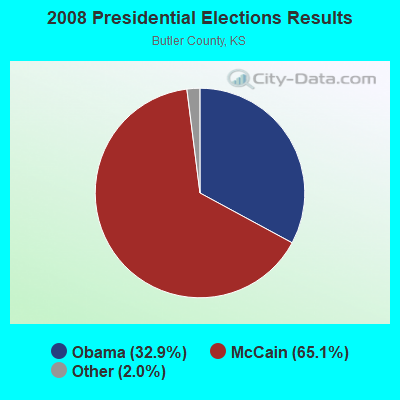

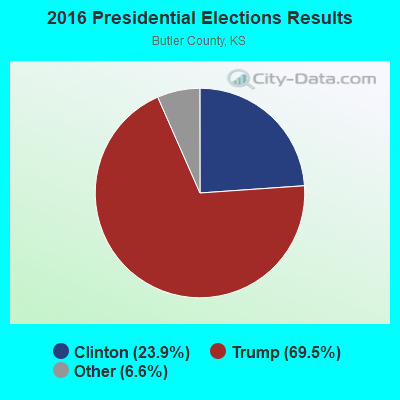

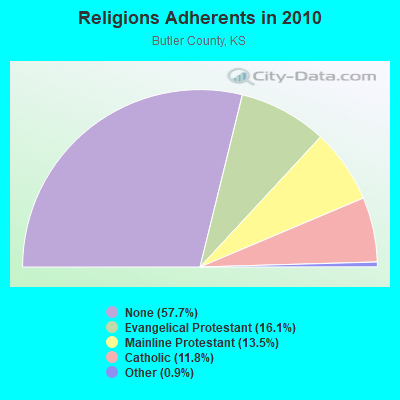
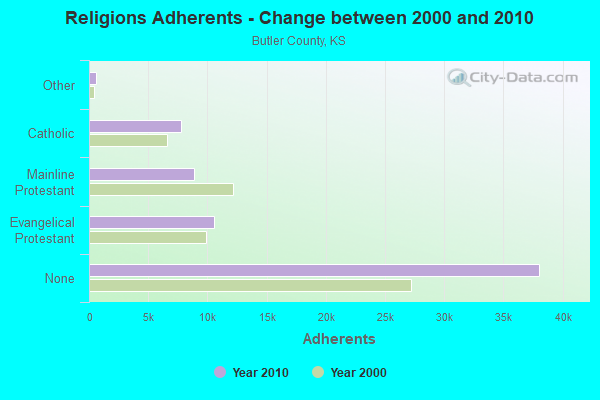
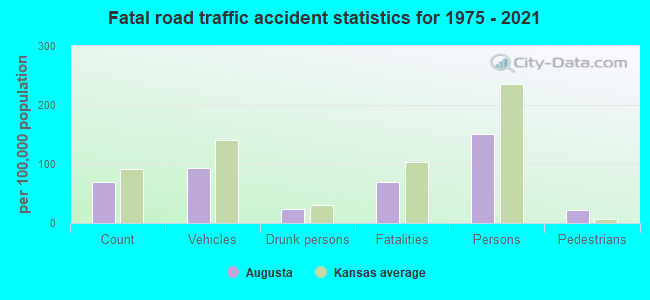
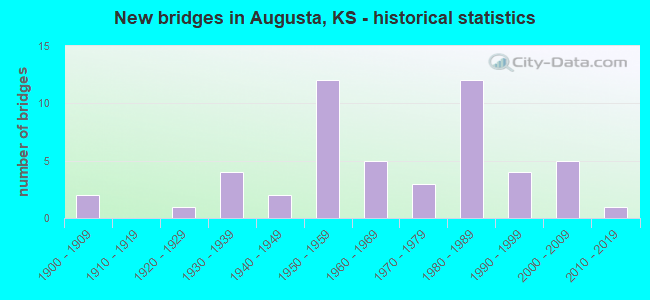
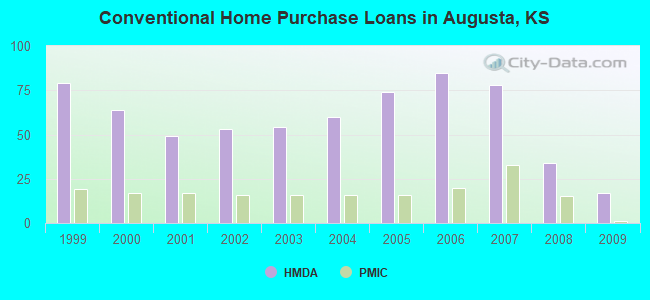
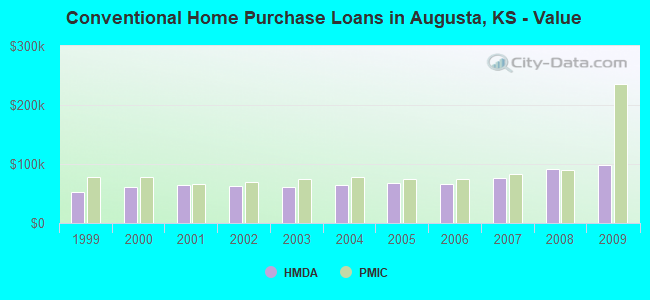
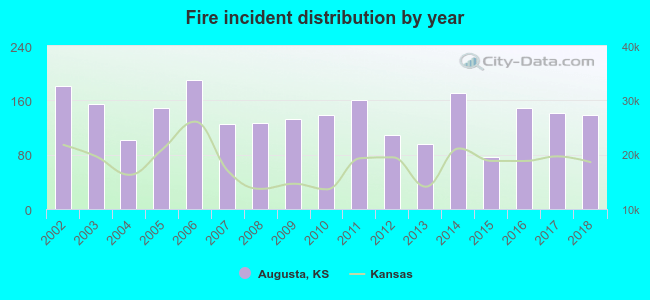 According to the data from the years 2002 - 2018 the average number of fire incidents per year is 137. The highest number of reported fire incidents - 190 took place in 2006, and the least - 77 in 2015. The data has a decreasing trend.
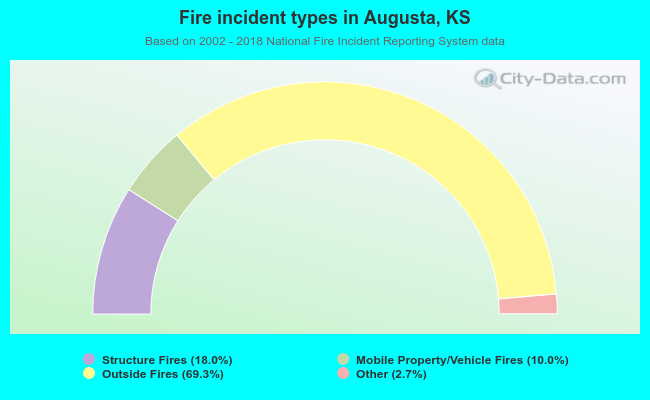 When looking into fire subcategories, the most incidents belonged to: Outside Fires (69.3%), and Structure Fires (18.0%).