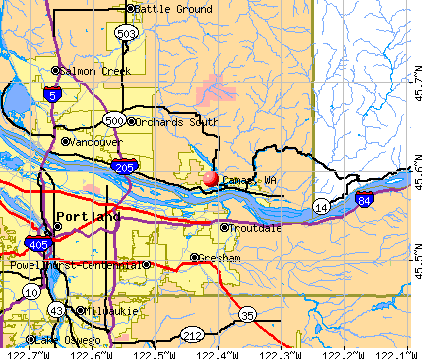
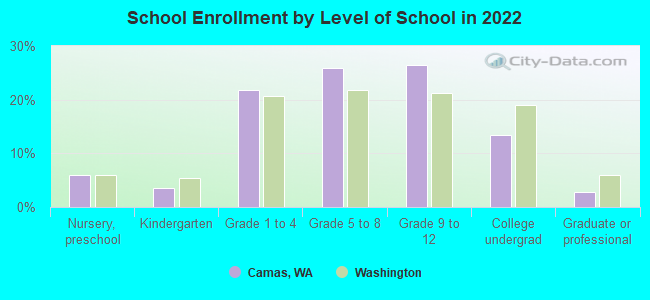
Camas, Washington
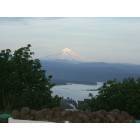
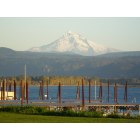
Camas: View of Mt. Hood
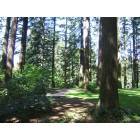
Camas: Lacamas Park
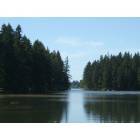
Camas: Lacamas Lake
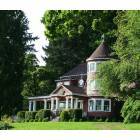
Camas: Leadbetter House on Lacamas Lake
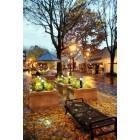
Camas: Evening glow downtown Camas
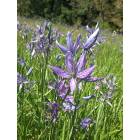
Camas: Camas Lily - Camas Lily Fields, Camas, WA
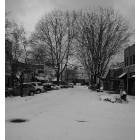
Camas: Snow in downtown Camas
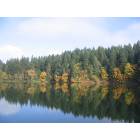
Camas: Fall Colors - Round Lake Camas, WA
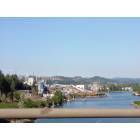
Camas: Columbia River - Camas/Washougal Port
Camas: A paper mill in Camas.
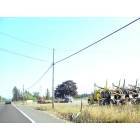
Camas: Heading eastward from Camas towards Washougal
- add
your
Submit your own pictures of this city and show them to the world
- OSM Map
- General Map
- Google Map
- MSN Map
Population change since 2000: +118.4%
| Males: 13,854 | |
| Females: 13,517 |
| Median resident age: | 40.4 years |
| Washington median age: | 38.4 years |
| Camas: | $135,512 |
| WA: | $91,306 |
Estimated per capita income in 2022: $61,858 (it was $27,267 in 2000)
Camas city income, earnings, and wages data
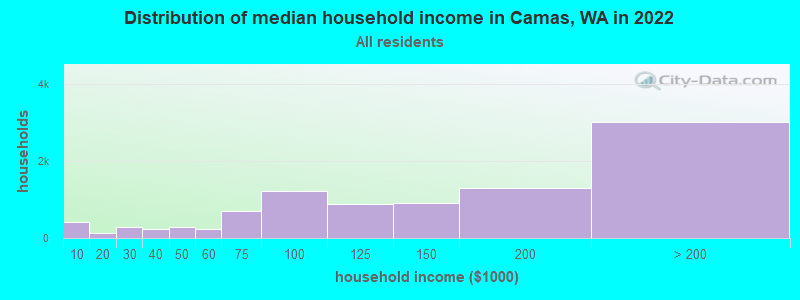
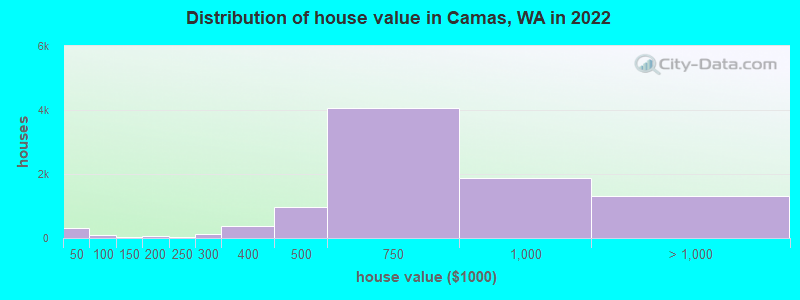
Estimated median house or condo value in 2022: $708,379 (it was $190,800 in 2000)
| Camas: | $708,379 |
| WA: | $569,500 |
Mean prices in 2022: all housing units: $813,277; detached houses: $819,978; townhouses or other attached units: $560,551; mobile homes: $66,671
Median gross rent in 2022: $1,811.
(4.7% for White Non-Hispanic residents, 3.9% for Black residents, 1.5% for two or more races residents)
Detailed information about poverty and poor residents in Camas, WA


Compare current foreclosures in Camas, WA:
| Photo | Address | Area | Beds / Baths | Price | Details |
|---|---|---|---|---|---|

|
#1
NW Galaxy St
Camas, WA 98607
|
1,950 sq. feet
|
1 baths 3 beds |
show details | |

|
#2
NE Sitka Dr
Camas, WA 98607
|
2,312 sq. feet
|
2 baths 4 beds |
show details | |

|
#3
SE 33rd St
Camas, WA 98607
|
1,860 sq. feet
|
3 baths 4 beds |
show details | |

|
#4
NW Valley St
Camas, WA 98607
|
4,840 sq. feet
|
3 baths 4 beds |
show details | |

|
#5
SE 6th Ave
Camas, WA 98607
|
702 sq. feet
|
1 baths 2 beds |
show details | |

|
#6
NE 277th Ave
Camas, WA 98607
|
3,778 sq. feet
|
4 baths 4 beds |
show details | |

|
#7
NW 17th Cir
Camas, WA 98607
|
3,883 sq. feet
|
2 baths 3 beds |
show details | |

|
#8
NW 37th Ave
Camas, WA 98607
|
2,566 sq. feet
|
2 baths 4 beds |
show details | |

|
#9
NW Astor Ct
Camas, WA 98607
|
3,352 sq. feet
|
3 baths 3 beds |
show details | |

|
#10
NW Hill St
Camas, WA 98607
|
2,204 sq. feet
|
3 baths 4 beds |
show details |
| Photo | Address | Area | Beds / Baths | Price | Details |
|---|---|---|---|---|---|

|
#11
NW Couch St
Camas, WA 98607
|
1,660 sq. feet
|
2 baths 3 beds |
show details | |

|
#12
NW Valley St
Camas, WA 98607
|
3,125 sq. feet
|
3 baths 4 beds |
show details | |

|
#13
NE Spruce Dr
Camas, WA 98607
|
- sq. feet
|
- baths - beds |
show details | |

|
#14
NW Astor Ct
Camas, WA 98607
|
- sq. feet
|
- baths - beds |
show details | |

|
#15
N Wright St
Camas, WA 98607
|
- sq. feet
|
- baths - beds |
show details | |

|
#16
NE 3rd Ave # 302
Camas, WA 98607
|
- sq. feet
|
- baths - beds |
show details | |

|
#17
NW Norwood St
Camas, WA 98607
|
- sq. feet
|
- baths - beds |
show details | |

|
#18
NW 5th Ave
Camas, WA 98607
|
- sq. feet
|
- baths - beds |
show details | |

|
#19
SE 3rd Way # 216
Camas, WA 98607
|
- sq. feet
|
- baths - beds |
show details | |

|
#20
NE Sitka Dr
Camas, WA 98607
|
- sq. feet
|
- baths - beds |
show details |
| Photo | Address | Area | Beds / Baths | Price | Details |
|---|---|---|---|---|---|

|
#21
SE 1st St, Apt 401
Camas, WA 98607
|
- sq. feet
|
- baths - beds |
show details | |

|
#22
NE 94th St
Camas, WA 98607
|
- sq. feet
|
- baths - beds |
show details | |

|
#23
NE Tacoma Ct
Camas, WA 98607
|
- sq. feet
|
- baths - beds |
show details | |

|
#24
NE Laurel St
Camas, WA 98607
|
- sq. feet
|
- baths - beds |
show details | |

|
#25
SE 1st St, Apt 233
Camas, WA 98607
|
- sq. feet
|
- baths - beds |
show details | |

|
#26
SE 34th St, Ste 106 Pmb 120
Camas, WA 98607
|
- sq. feet
|
- baths - beds |
show details | |

|
#27
NW 27th Ave
Camas, WA 98607
|
- sq. feet
|
- baths - beds |
show details | |

|
#28
NW 9th Ave
Camas, WA 98607
|
- sq. feet
|
- baths - beds |
show details | |

|
#29
NE 3rd Ave # 103
Camas, WA 98607
|
- sq. feet
|
- baths - beds |
show details | |

|
#30
N 89th Loop
Camas, WA 98607
|
- sq. feet
|
- baths - beds |
show details |
| Photo | Address | Area | Beds / Baths | Price | Details |
|---|---|---|---|---|---|

|
Check over 1 million property listings on Foreclosure.com!
|
browse all offers | |||
| Photo | Address | Area | Beds / Baths | Price | Details |
|---|


- 19,64872.6%White alone
- 2,92510.8%Asian alone
- 2,0407.5%Two or more races
- 1,4185.2%Hispanic
- 6202.3%Black alone
- 2210.8%Other race alone
- 970.4%American Indian alone
- 320.1%Native Hawaiian and Other
Pacific Islander alone
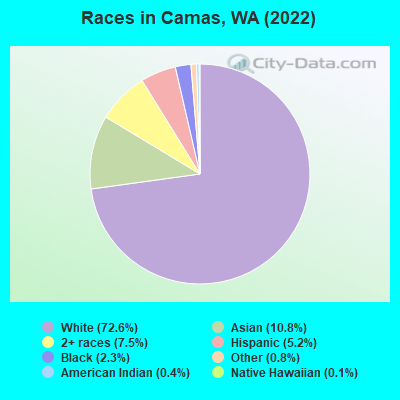
Races in Camas detailed stats: ancestries, foreign born residents, place of birth
According to our research of Washington and other state lists, there were 6 registered sex offenders living in Camas, Washington as of April 27, 2024.
The ratio of all residents to sex offenders in Camas is 3,693 to 1.
The ratio of registered sex offenders to all residents in this city is much lower than the state average.
Type |
2009 |
2010 |
2011 |
2012 |
2013 |
2014 |
2015 |
2016 |
2017 |
2018 |
2019 |
2020 |
2021 |
2022 |
|---|---|---|---|---|---|---|---|---|---|---|---|---|---|---|
| Murders (per 100,000) | 0 (0.0) | 0 (0.0) | 0 (0.0) | 0 (0.0) | 0 (0.0) | 0 (0.0) | 0 (0.0) | 0 (0.0) | 0 (0.0) | 1 (4.2) | 0 (0.0) | 0 (0.0) | 0 (0.0) | 0 (0.0) |
| Rapes (per 100,000) | 7 (37.6) | 9 (46.5) | 4 (20.3) | 2 (10.0) | 3 (14.4) | 4 (18.8) | 7 (32.3) | 7 (31.3) | 4 (17.4) | 10 (41.9) | 5 (20.5) | 5 (20.0) | 6 (22.5) | 5 (18.1) |
| Robberies (per 100,000) | 3 (16.1) | 1 (5.2) | 2 (10.2) | 1 (5.0) | 2 (9.6) | 3 (14.1) | 1 (4.6) | 2 (8.9) | 3 (13.1) | 2 (8.4) | 2 (8.2) | 1 (4.0) | 0 (0.0) | 0 (0.0) |
| Assaults (per 100,000) | 4 (21.5) | 8 (41.3) | 3 (15.3) | 9 (45.2) | 9 (43.2) | 9 (42.3) | 9 (41.5) | 6 (26.8) | 6 (26.1) | 6 (25.1) | 8 (32.8) | 3 (12.0) | 5 (18.7) | 3 (10.8) |
| Burglaries (per 100,000) | 61 (327.6) | 48 (248.0) | 45 (228.9) | 90 (452.1) | 66 (316.6) | 52 (244.4) | 58 (267.6) | 67 (299.8) | 70 (304.7) | 35 (146.7) | 30 (123.0) | 40 (160.1) | 65 (243.6) | 40 (144.6) |
| Thefts (per 100,000) | 274 (1,472) | 274 (1,416) | 243 (1,236) | 293 (1,472) | 300 (1,439) | 228 (1,072) | 239 (1,103) | 219 (979.9) | 269 (1,171) | 170 (712.3) | 182 (746.3) | 225 (900.8) | 245 (918.2) | 231 (835.4) |
| Auto thefts (per 100,000) | 13 (69.8) | 15 (77.5) | 13 (66.1) | 18 (90.4) | 22 (105.5) | 15 (70.5) | 19 (87.7) | 23 (102.9) | 36 (156.7) | 16 (67.0) | 12 (49.2) | 33 (132.1) | 43 (161.2) | 42 (151.9) |
| Arson (per 100,000) | 4 (21.5) | 4 (20.7) | 2 (10.2) | 6 (30.1) | 6 (28.8) | 3 (14.1) | 4 (18.5) | 2 (8.9) | 4 (17.4) | 1 (4.2) | 0 (0.0) | 2 (8.0) | 2 (7.5) | 1 (3.6) |
| City-Data.com crime index | 126.6 | 127.2 | 93.1 | 116.4 | 111.2 | 93.3 | 105.4 | 101.5 | 103.8 | 93.6 | 67.8 | 77.4 | 88.4 | 72.3 |
The City-Data.com crime index weighs serious crimes and violent crimes more heavily. Higher means more crime, U.S. average is 246.1. It adjusts for the number of visitors and daily workers commuting into cities.
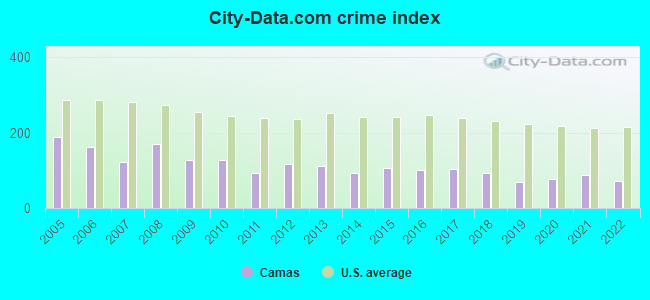
Crime rate in Camas detailed stats: murders, rapes, robberies, assaults, burglaries, thefts, arson
Full-time law enforcement employees in 2021, including police officers: 29 (27 officers - 23 male; 4 female).
| Officers per 1,000 residents here: | 1.01 |
| Washington average: | 1.35 |
 Recent articles from our blog. Our writers, many of them Ph.D. graduates or candidates, create easy-to-read articles on a wide variety of topics.

 | Ended up going for Camas (25 replies) |
| Camas house - But different SD - boundary exceptions (24 replies) |
| Potential Move To Camas from SF Bay Area (134 replies) |
| Camas Business 'Shaming' for personal choices? Community support? (34 replies) |
| Camas schools (4 replies) |
| Property Situation in Camas & Washougal (11 replies) |
Latest news from Camas, WA collected exclusively by city-data.com from local newspapers, TV, and radio stations
Ancestries: English (8.7%), German (8.4%), American (6.0%), European (5.5%), Irish (3.9%), Italian (2.9%).
Current Local Time: PST time zone
Incorporated in 1906
Land area: 10.9 square miles.
Population density: 2,510 people per square mile (average).
3,352 residents are foreign born (8.0% Asia, 2.3% Europe).
| This city: | 12.4% |
| Washington: | 14.9% |
Median real estate property taxes paid for housing units with mortgages in 2022: $6,097 (0.8%)
Median real estate property taxes paid for housing units with no mortgage in 2022: $6,466 (0.9%)
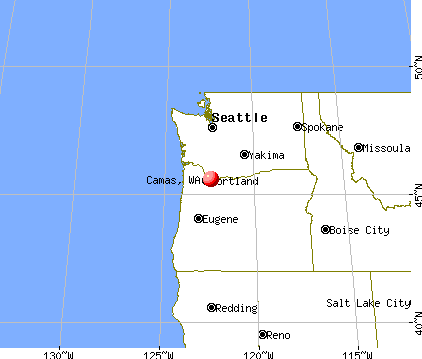
Nearest city with pop. 50,000+: Gresham, OR  (6.2 miles , pop. 90,205).
Nearest city with pop. 200,000+: Portland, OR (12.0 miles , pop. 529,121).
Nearest city with pop. 1,000,000+: Los Angeles, CA (823.8 miles , pop. 3,694,820).
Nearest cities:
), ), ), Latitude: 45.59 N, Longitude: 122.41 W
Daytime population change due to commuting: +1,264 (+4.7%)
Workers who live and work in this city: 5,497 (42.1%)
Area code: 360
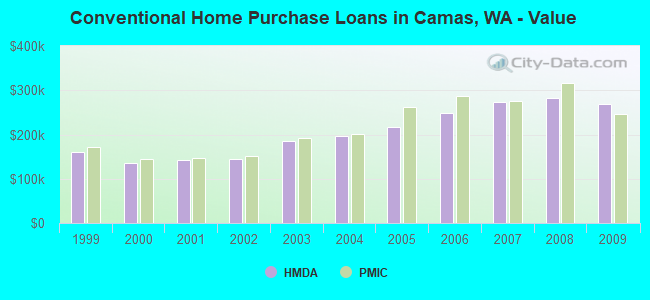
Property values in Camas, WA
Camas, Washington accommodation & food services, waste management - Economy and Business Data
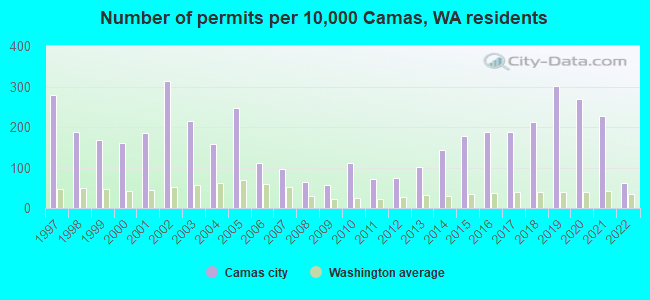
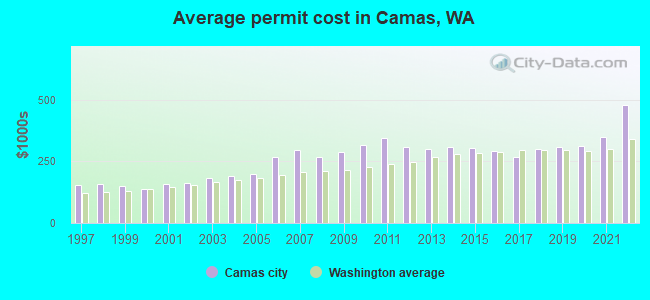
Single-family new house construction building permits:
- 2022: 76 buildings, average cost: $478,700
- 2021: 286 buildings, average cost: $346,500
- 2020: 337 buildings, average cost: $313,300
- 2019: 379 buildings, average cost: $308,100
- 2018: 266 buildings, average cost: $299,500
- 2017: 235 buildings, average cost: $267,500
- 2016: 234 buildings, average cost: $293,400
- 2015: 224 buildings, average cost: $305,300
- 2014: 178 buildings, average cost: $307,600
- 2013: 127 buildings, average cost: $300,800
- 2012: 93 buildings, average cost: $306,000
- 2011: 90 buildings, average cost: $345,900
- 2010: 140 buildings, average cost: $316,000
- 2009: 71 buildings, average cost: $289,300
- 2008: 82 buildings, average cost: $268,100
- 2007: 122 buildings, average cost: $296,300
- 2006: 140 buildings, average cost: $266,000
- 2005: 311 buildings, average cost: $197,000
- 2004: 197 buildings, average cost: $189,100
- 2003: 269 buildings, average cost: $181,600
- 2002: 394 buildings, average cost: $163,300
- 2001: 230 buildings, average cost: $156,800
- 2000: 201 buildings, average cost: $136,200
- 1999: 210 buildings, average cost: $148,400
- 1998: 235 buildings, average cost: $155,500
- 1997: 351 buildings, average cost: $151,800
| Here: | 4.9% |
| Washington: | 4.6% |
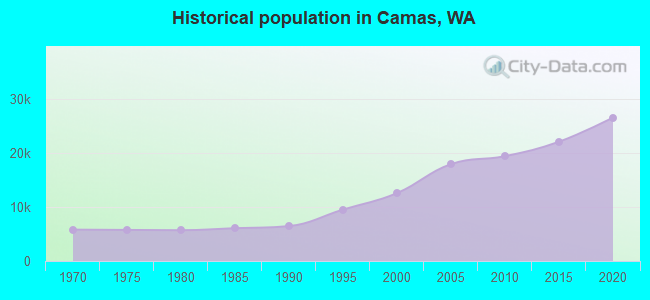
Population change in the 1990s: +5,624 (+81.4%).
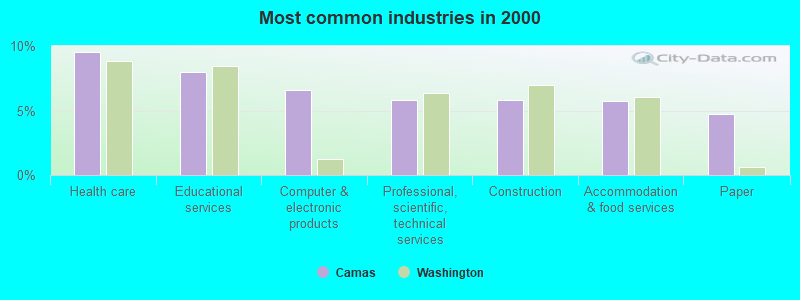
- Health care (9.6%)
- Educational services (8.0%)
- Computer & electronic products (6.6%)
- Professional, scientific, technical services (5.9%)
- Construction (5.8%)
- Accommodation & food services (5.8%)
- Paper (4.7%)
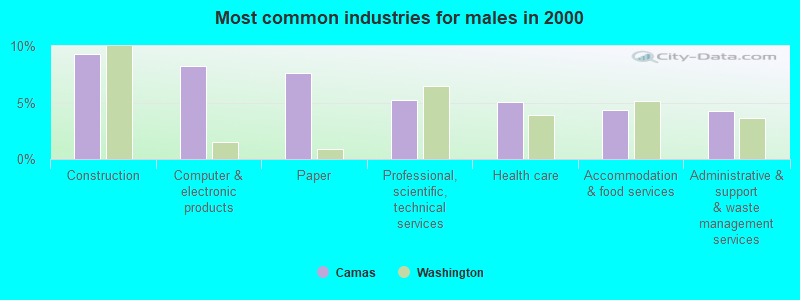
- Construction (9.3%)
- Computer & electronic products (8.2%)
- Paper (7.6%)
- Professional, scientific, technical services (5.2%)
- Health care (5.1%)
- Accommodation & food services (4.3%)
- Administrative & support & waste management services (4.3%)
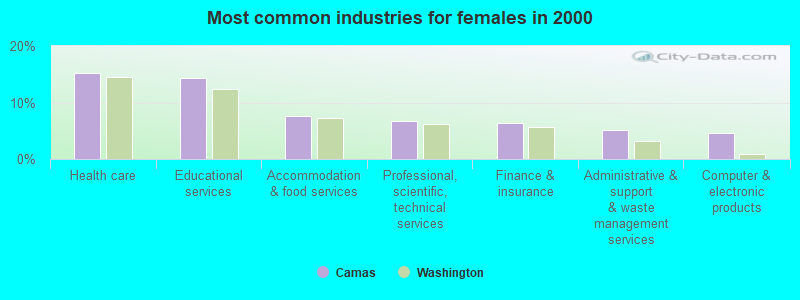
- Health care (15.2%)
- Educational services (14.4%)
- Accommodation & food services (7.6%)
- Professional, scientific, technical services (6.7%)
- Finance & insurance (6.4%)
- Administrative & support & waste management services (5.2%)
- Computer & electronic products (4.6%)
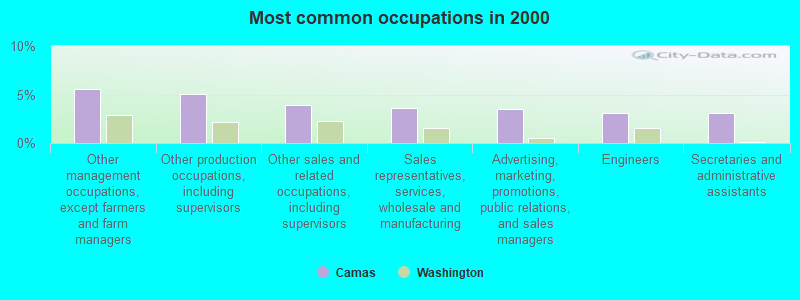
- Other management occupations, except farmers and farm managers (5.5%)
- Other production occupations, including supervisors (5.0%)
- Other sales and related occupations, including supervisors (3.9%)
- Sales representatives, services, wholesale and manufacturing (3.6%)
- Advertising, marketing, promotions, public relations, and sales managers (3.5%)
- Engineers (3.1%)
- Secretaries and administrative assistants (3.1%)
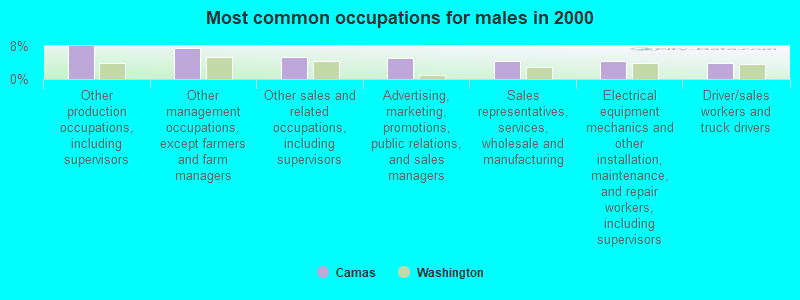
- Other production occupations, including supervisors (7.9%)
- Other management occupations, except farmers and farm managers (7.5%)
- Other sales and related occupations, including supervisors (5.3%)
- Advertising, marketing, promotions, public relations, and sales managers (5.2%)
- Sales representatives, services, wholesale and manufacturing (4.4%)
- Electrical equipment mechanics and other installation, maintenance, and repair workers, including supervisors (4.3%)
- Driver/sales workers and truck drivers (4.0%)
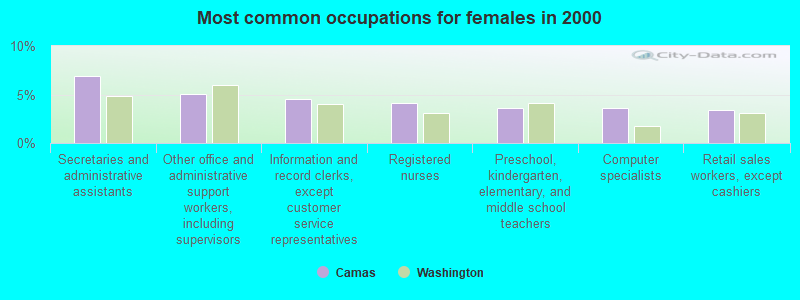
- Secretaries and administrative assistants (6.9%)
- Other office and administrative support workers, including supervisors (5.1%)
- Information and record clerks, except customer service representatives (4.5%)
- Registered nurses (4.2%)
- Preschool, kindergarten, elementary, and middle school teachers (3.6%)
- Computer specialists (3.6%)
- Retail sales workers, except cashiers (3.4%)
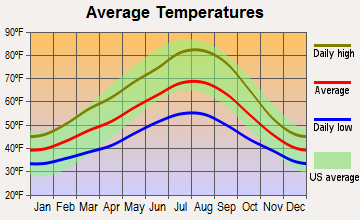
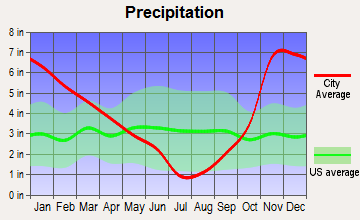
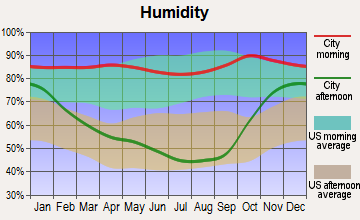
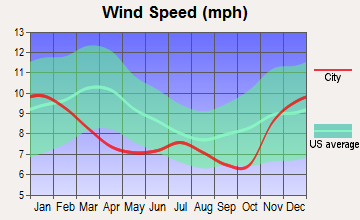
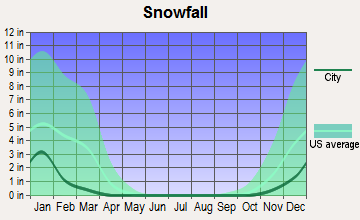
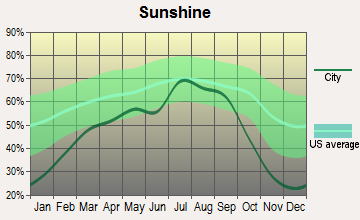
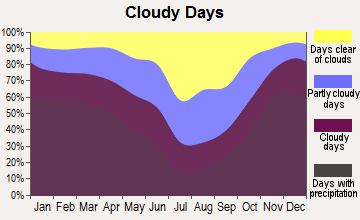
Average climate in Camas, Washington
Based on data reported by over 4,000 weather stations
|
|


(lower is better)
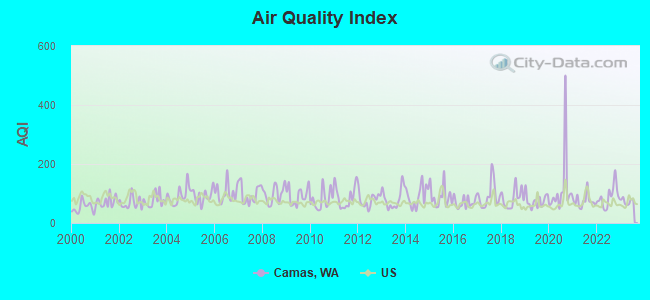
Air Quality Index (AQI) level in 2023 was 74.0. This is about average.
| City: | 74.0 |
| U.S.: | 72.6 |
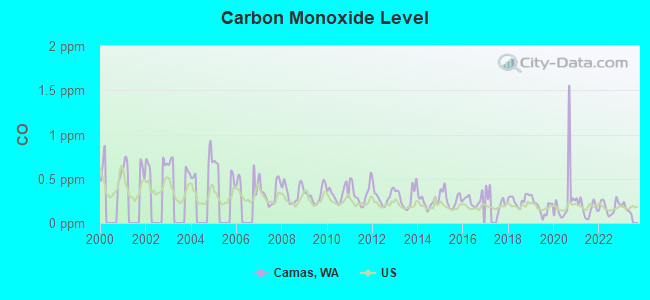
Carbon Monoxide (CO) [ppm] level in 2022 was 0.181. This is better than average. Closest monitor was 10.8 miles away from the city center.
| City: | 0.181 |
| U.S.: | 0.251 |
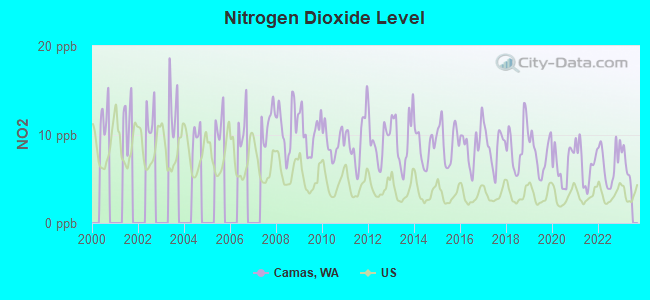
Nitrogen Dioxide (NO2) [ppb] level in 2022 was 6.68. This is worse than average. Closest monitor was 5.4 miles away from the city center.
| City: | 6.68 |
| U.S.: | 5.11 |
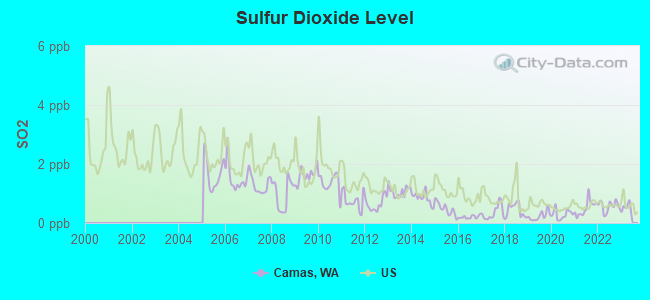
Sulfur Dioxide (SO2) [ppb] level in 2022 was 0.569. This is significantly better than average. Closest monitor was 0.6 miles away from the city center.
| City: | 0.569 |
| U.S.: | 1.515 |
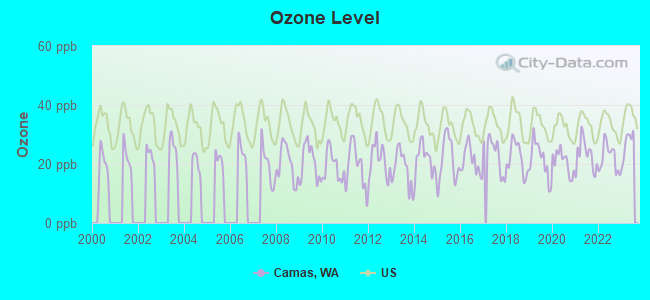
Ozone [ppb] level in 2023 was 26.8. This is better than average. Closest monitor was 5.4 miles away from the city center.
| City: | 26.8 |
| U.S.: | 33.3 |
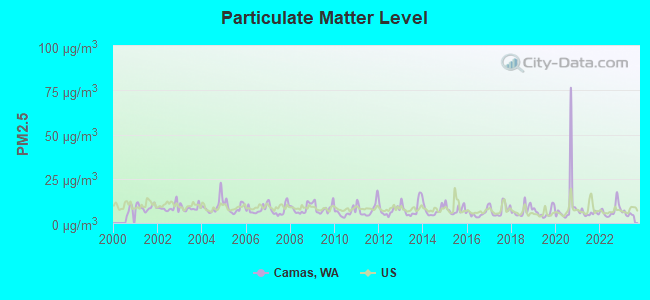
Particulate Matter (PM2.5) [µg/m3] level in 2023 was 5.10. This is significantly better than average. Closest monitor was 0.5 miles away from the city center.
| City: | 5.10 |
| U.S.: | 8.11 |
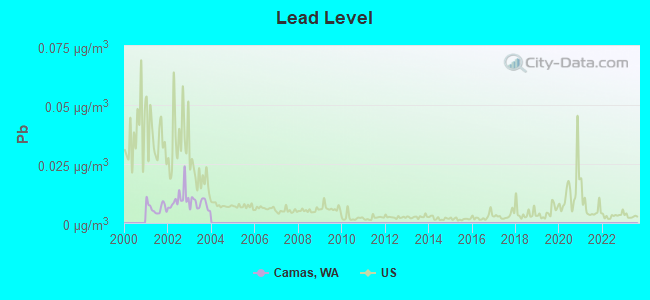
Lead (Pb) [µg/m3] level in 2003 was 0.00810. This is about average. Closest monitor was 6.6 miles away from the city center.
| City: | 0.00810 |
| U.S.: | 0.00931 |
Earthquake activity:
Camas-area historical earthquake activity is significantly above Washington state average. It is 1500% greater than the overall U.S. average.On 4/13/1949 at 19:55:42, a magnitude 7.0 (7.0 UK, Class: Major, Intensity: VIII - XII) earthquake occurred 114.8 miles away from Camas center, causing $80,000,000 total damage
On 2/28/2001 at 18:54:32, a magnitude 6.8 (6.5 MB, 6.6 MS, 6.8 MW, Class: Strong, Intensity: VII - IX) earthquake occurred 104.0 miles away from Camas center, causing $2,000,000,000 total damage and $305,000,000 insured losses
On 2/28/2001 at 18:54:32, a magnitude 6.8 (6.8 MD, Depth: 32.2 mi) earthquake occurred 108.8 miles away from Camas center
On 4/29/1965 at 15:28:43, a magnitude 6.6 (6.6 UK) earthquake occurred 119.4 miles away from Camas center, causing $28,000,000 total damage
On 1/31/1922 at 13:17:28, a magnitude 7.6 (7.6 UK) earthquake occurred 373.5 miles away from the city center
On 11/8/1980 at 10:27:34, a magnitude 7.2 (6.2 MB, 7.2 MS, 7.2 MW, 7.0 ML) earthquake occurred 324.1 miles away from Camas center
Magnitude types: body-wave magnitude (MB), duration magnitude (MD), local magnitude (ML), surface-wave magnitude (MS), moment magnitude (MW)
Natural disasters:
The number of natural disasters in Clark County (13) is near the US average (15).Major Disasters (Presidential) Declared: 12
Emergencies Declared: 1
Causes of natural disasters: Floods: 7, Mudslides: 4, Storms: 4, Winter Storms: 4, Landslides: 3, Winds: 2, Earthquake: 1, Heavy Rain: 1, Hurricane: 1, Snow: 1, Tornado: 1, Volcanic Eruption: 1, Other: 1 (Note: some incidents may be assigned to more than one category).

Hospitals and medical centers in Camas:
- CHRISTOPHER HOME,THE (2045 NW SIXTH AVE)
- EAGLE REHABILITATION AT CAMAS (640 NORTHEAST EVERETT STREET)
Other hospitals and medical centers near Camas:
- VILLAGE MANOR (Nursing Home, about 4 miles away; WOOD VILLAGE, OR)
- WATERFORD AT FAIRWAY VILLAGE (Home Health Center, about 5 miles away; VANCOUVER, WA)
- LEGACY MOUNT HOOD MEDICAL CENTER Acute Care Hospitals (about 5 miles away; GRESHAM, OR)
- MARQUIS CARE AT CENTENNIAL (Nursing Home, about 6 miles away; PORTLAND, OR)
- CASCADE PARK CARE CENTER (Nursing Home, about 6 miles away; VANCOUVER, WA)
- GOOD SAMARITAN SOCIETY - FAIRLAWN VILLAGE (Nursing Home, about 7 miles away; GRESHAM, OR)
- ADVENTIST HEALTH HOME HEALTH (Home Health Center, about 7 miles away; PORTLAND, OR)
Airports and heliports located in Camas:
- Grove Field Airport (1W1) (Runways: 1, Itinerant Ops: 2,500, Local Ops: 7,500)
- Sampson Heliport (6WA1)
Amtrak stations near Camas:
- 14 miles: PORTLAND (800 NW 6TH AVE.) . Services: ticket office, fully wheelchair accessible, enclosed waiting area, public restrooms, public payphones, full-service food facilities, paid short-term parking, paid long-term parking, call for car rental service, taxi stand, intercity bus service, public transit connection.
- 14 miles: VANCOUVER (FOOT OF W. 11TH ST.) . Services: ticket office, fully wheelchair accessible, enclosed waiting area, public restrooms, public payphones, vending machines, free short-term parking, free long-term parking, call for taxi service.
- 19 miles: OREGON CITY (1757 WASHINGTON ST.)
Colleges/universities with over 2000 students nearest to Camas:
- Mt Hood Community College (about 6 miles; Gresham, OR; Full-time enrollment: 11,847)
- Concordia University-Portland (about 12 miles; Portland, OR; FT enrollment: 3,996)
- Clark College (about 13 miles; Vancouver, WA; FT enrollment: 9,330)
- Portland State University (about 15 miles; Portland, OR; FT enrollment: 21,450)
- University of Portland (about 16 miles; Portland, OR; FT enrollment: 4,030)
- Lewis & Clark College (about 16 miles; Portland, OR; FT enrollment: 2,864)
- Portland Community College (about 19 miles; Portland, OR; FT enrollment: 23,600)
Public high schools in Camas:
- CAMAS HIGH SCHOOL (Location: 26900 SE 15TH ST, Grades: 9-12)
- HAYES FREEDOM HIGH SCHOOL (Location: 1919 NE IONE ST, Grades: 9-12)
- UNION HIGH SCHOOL (Location: 6201 NW FRIBERG-STRUNK ST, Grades: 9-12)
Public elementary/middle schools in Camas:
- LACAMAS HEIGHTS ELEMENTARY (Location: 4600 NE GARFIELD STREET, Grades: KG-5)
- DOROTHY FOX (Location: 2623 NW SIERRA ST, Grades: PK-5)
- HELEN BALLER ELEM (Location: 1954 NE GARFIELD STREET, Grades: KG-5)
- SKYRIDGE MIDDLE SCHOOL (Location: 5220 NW PARKER STREET, Grades: 6-8)
- PRUNE HILL ELEM (Location: 1601 NW TIDLAND ST, Grades: KG-5)
- LIBERTY MIDDLE SCHOOL (Location: 1612 NE GARFIELD ST, Grades: 6-8)
- GRASS VALLEY ELEMENTARY (Location: 3000 NE GRASS VALLEY DR, Grades: KG-5)
- WOODBURN ELEMENTARY (Location: 2400 NE WOODBURN DR, Grades: PK-5)
- ILLAHEE ELEMENTARY SCHOOL (Location: 19401 SE 1ST STREET, Grades: KG-5)
Private elementary/middle schools in Camas:
User-submitted facts and corrections:
- ILLAHEE ELEMENTARY SCHOOL (Students: 812; Location: 19401 SE 1ST STREET; Grades: KG - 05) This is an Evergreen School District school. Camas will soon have another middle school called Liberty that will house 6th 7th and 8th grade along with Skyrdige Middle school.
- Gresham is right across the Columbia river from Camas, but it is only 6 miles to get there if you swim because the closest bridge is at least six miles away.
Points of interest:
Notable locations in Camas: Lacamas Campground (A), Forest Home Park (B), Camas Meadows Golf Club (C), Parker Landing (D), Camas Fire Department Station 41 (E), Camas Fire Department Station 42 (F). Display/hide their locations on the map
Shopping Center: One Stop Shopping Center (1). Display/hide its location on the map
Churches in Camas include: Camas Church of the Nazarene (A), Camas Friends Church (B), Camas United Methodist Church (C), Christian Life Church (D), Faith Missionary Church (E), First United Pentecostal Church (F), Parkside Church (G), Saint Johns Presbyterian Church (H), The Church of Jesus Christ of Latter Day Saints Fairway Village Ward (I). Display/hide their locations on the map
Lakes and reservoirs: Dead Lake (A), Lacamas Lake (B), Crisman Reservoir (C), Haight Reservoir (D). Display/hide their locations on the map
Streams, rivers, and creeks: Lacamas Creek (A), Washougal River (B), Camas Slough (C). Display/hide their locations on the map
Park in Camas: Crown Park (1). Display/hide its location on the map
Hotels: Camas Hotel Inc (405 Northeast 4th Avenue) (1), Fairgate Inn Bed & Breakfast (2213 Northwest 23rd Avenue) (2). Display/hide their approximate locations on the map
Birthplace of: Jimmie Rodgers (pop singer).
Drinking water stations with addresses in Camas and their reported violations in the past:
CAMAS MUNICIPAL WATER SEWER SYSTEM (Population served: 27,111, Surface water):Past monitoring violations:
- 155 regular monitoring violations
Drinking water stations with addresses in Camas that have no violations reported:
- FERN PRAIRIE MARKET (Population served: 135, Primary Water Source Type: Groundwater)
| This city: | 2.9 people |
| Washington: | 2.5 people |
| This city: | 79.2% |
| Whole state: | 64.4% |
| This city: | 5.7% |
| Whole state: | 7.7% |
Likely homosexual households (counted as self-reported same-sex unmarried-partner households)
- Lesbian couples: 0.4% of all households
- Gay men: 0.3% of all households
16 people in other noninstitutional facilities in 2010
72 people in nursing homes in 2000
Banks with branches in Camas (2011 data):
- Riverview Community Bank: Camas Branch at 700 Ne 4th Avenue, branch established on 2000/09/01. Info updated 2011/07/21: Bank assets: $850.8 mil, Deposits: $736.4 mil, headquarters in Vancouver, WA, negative income in the last year, Commercial Lending Specialization, 17 total offices
- U.S. Bank National Association: Camas Branch at 430 N.E. Adams St, branch established on 1987/09/21. Info updated 2012/01/30: Bank assets: $330,470.8 mil, Deposits: $236,091.5 mil, headquarters in Cincinnati, OH, positive income, 3121 total offices, Holding Company: U.S. Bancorp
- JPMorgan Chase Bank, National Association: Fisher's Landing Branch at 16600 Southeast Mcgillivray #150, branch established on 1994/06/29. Info updated 2011/11/10: Bank assets: $1,811,678.0 mil, Deposits: $1,190,738.0 mil, headquarters in Columbus, OH, positive income, International Specialization, 5577 total offices, Holding Company: Jpmorgan Chase & Co.
- Bank of America, National Association: Camas Branch at 528 Ne 4th Ave, branch established on 1944/02/01. Info updated 2009/11/18: Bank assets: $1,451,969.3 mil, Deposits: $1,077,176.8 mil, headquarters in Charlotte, NC, positive income, 5782 total offices, Holding Company: Bank Of America Corporation
- Wells Fargo Bank, National Association: Lacamas Branch at 3252 N.E. Third Avenue, Suite 7, branch established on 1998/04/29. Info updated 2011/04/05: Bank assets: $1,161,490.0 mil, Deposits: $905,653.0 mil, headquarters in Sioux Falls, SD, positive income, 6395 total offices, Holding Company: Wells Fargo & Company
For population 15 years and over in Camas:
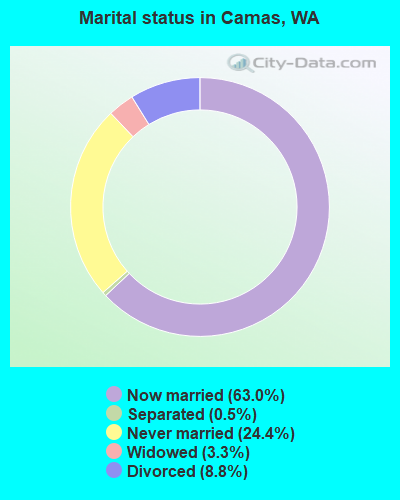
- Never married: 24.4%
- Now married: 63.0%
- Separated: 0.5%
- Widowed: 3.3%
- Divorced: 8.8%
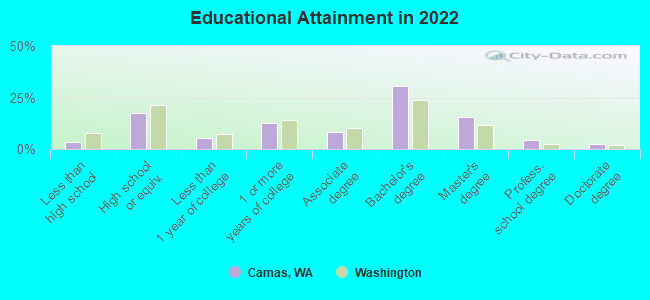
For population 25 years and over in Camas:
- High school or higher: 96.5%
- Bachelor's degree or higher: 52.5%
- Graduate or professional degree: 21.4%
- Unemployed: 4.2%
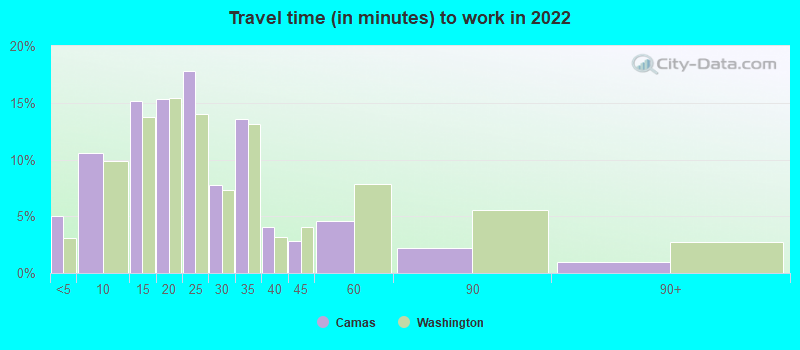
- Mean travel time to work (commute): 18.2 minutes
| Here: | 9.8 |
| Washington average: | 11.6 |
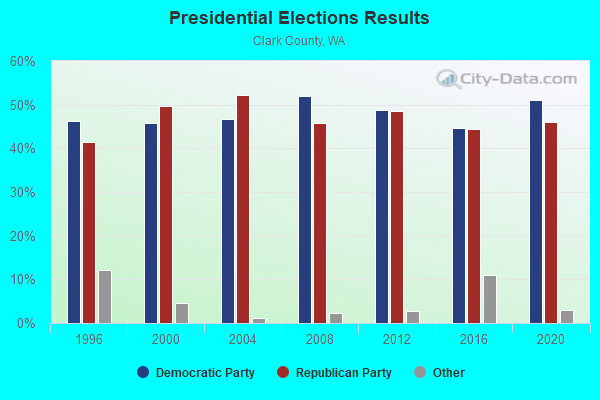
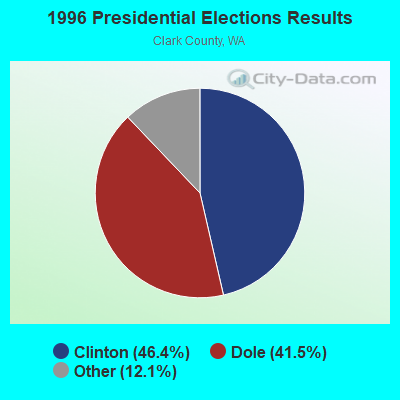
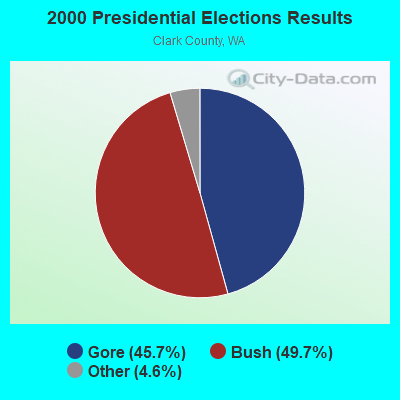
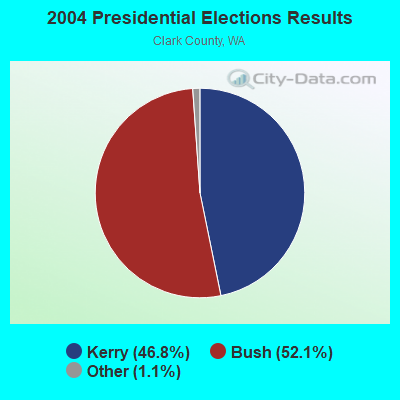
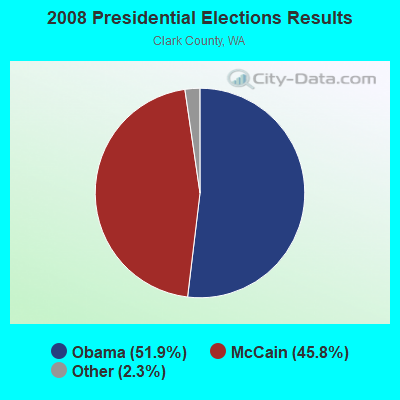
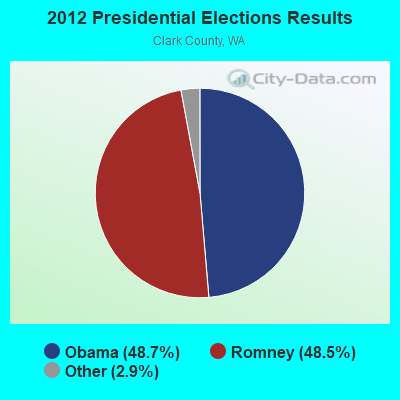
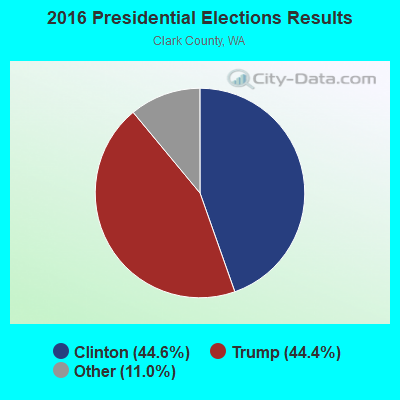
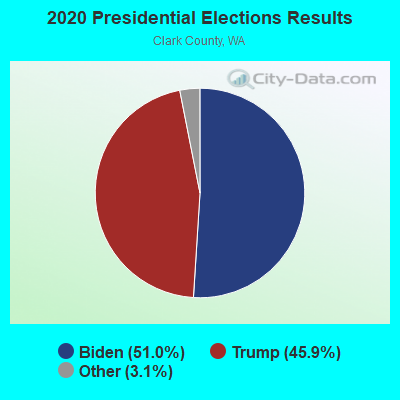
Graphs represent county-level data. Detailed 2008 Election Results
Neighborhoods in Camas:
(Camas, Washington Neighborhood Map)- Applewood Hills neighborhood
- Avery Manor neighborhood
- Awbrey Glen at Fishers Landing neighborhood
- Beech Street neighborhood
- Blakes Highland neighborhood
- Brady Ridge neighborhood
- Brady Woods neighborhood
- Camas Estates neighborhood
- Camas Meadows Corporate Center neighborhood
- Camas West neighborhood
- Caribou Acres neighborhood
- Carmacks neighborhood
- Carson Estates neighborhood
- Cascade Estates neighborhood
- Columbia Summit Estates neighborhood
- Columbia View Terrace neighborhood
- Comstock Estates neighborhood
- Country Ridge neighborhood
- Country View Estates neighborhood
- Crestview neighborhood
- Crown Pointe neighborhood
- Crown View Plaza neighborhood
- Deer Creek neighborhood
- Dove Hill neighborhood
- Drewfs Farm neighborhood
- Evergreen Acre Tracts neighborhood
- Fischers Creek neighborhood
- Forest Glenn neighborhood
- Forest Hills neighborhood
- Forest Home neighborhood
- Forest Home Estates neighborhood
- Forest Home Ridge neighborhood
- Forest Terrace neighborhood
- Forest Valley Park neighborhood
- Glen at Fishers Landing neighborhood
- Glenwood Heights neighborhood
- Glenwood Homestead neighborhood
- Grand Ridge neighborhood
- Grass Valley Estates neighborhood
- Greens at Deer Creek neighborhood
- Heritage Heights neighborhood
- Hidden Leaf neighborhood
- Hill Crest neighborhood
- Hill Top Heights neighborhood
- Hill View neighborhood
- Hillshire neighborhood
- Holly Hills neighborhood
- Holly Ridge neighborhood
- Hunter Ridge Estates neighborhood
- Hunters Ridge neighborhood
- James River neighborhood
- Karen Hills neighborhood
- Katies Hill neighborhood
- Knight Pointe at Prune Hill neighborhood
- Lacamas Cove Estates neighborhood
- Lacamas Estates neighborhood
- Lacamas Grove neighborhood
- Lacamas Heights neighborhood
- Lacamas Lake View Estates neighborhood
- Lacamas Meadows neighborhood
- Lacamas Pointe neighborhood
- Lacamas Ridge neighborhood
- Lacamas Shores neighborhood
- Lacamas Summit neighborhood
- Lacamas View neighborhood
- Lacamas Woods neighborhood
- Lake Heights neighborhood
- Lake Pointe neighborhood
- Lake Pointe West neighborhood
- Lakeridge North neighborhood
- Larkspur Estates neighborhood
- Leaptrott Estates neighborhood
- Livingston Estates neighborhood
- Livingston Terrace Estates neighborhood
- Logans Run neighborhood
- McIntosh Estates neighborhood
- Meadow Ridge neighborhood
- Mira Vista neighborhood
- Morning Meadows neighborhood
- Morning Meadows Estates neighborhood
- Morris Place neighborhood
- Myrtle neighborhood
- North Park neighborhood
- Norwood Terrace neighborhood
- Oak Park neighborhood
- Oak Park Homes neighborhood
- Oak Ridge Estates neighborhood
- Orchard Home neighborhood
- Overlook neighborhood
- Parker Estates neighborhood
- Peerywood neighborhood
- Pheasant Glen neighborhood
- Picket Fences neighborhood
- Prospect Place neighborhood
- Province Terrace neighborhood
- Prune Hill Estates neighborhood
- Prune Hill Park neighborhood
- Prunehill Village neighborhood
- Quail Crossing neighborhood
- Rainbow neighborhood
- Regency Place neighborhood
- Renaissance Summit neighborhood
- Rivers Edge neighborhood
- Rivers Walk neighborhood
- Rose Arbor neighborhood
- Scotts Meadow neighborhood
- Shilo Heights neighborhood
- Skyline Estates neighborhood
- Stone Ridge Estates neighborhood
- Stoneleaf neighborhood
- Summit Hill neighborhood
- Summit Oaks Estates neighborhood
- Summit at Columbia Vista neighborhood
- Sun Valley neighborhood
- Sundance neighborhood
- Sunningdale Gardens neighborhood
- Sunrise Summit neighborhood
- Sunrise Vista neighborhood
- Sunset Court neighborhood
- Sunset Terrace neighborhood
- Sweet Briar Estates neighborhood
- Terrace at Fishers Landing neighborhood
- The Grove neighborhood
- The Meadows neighborhood
- The Ridge neighborhood
- Thomas Estates neighborhood
- Three Rivers neighborhood
- Tidlands neighborhood
- Trista Estates neighborhood
- Two Creeks at Camas Meadows neighborhood
- Victoria Hills neighborhood
- View Point Terrace neighborhood
- View Ridge Estates neighborhood
- Village at Round Lake neighborhood
- Vista Del Rio neighborhood
- Waldorf Heights neighborhood
- Waterleaf neighborhood
- Wedgewood Place neighborhood
- Weir Park neighborhood
- West Highland neighborhood
- West Highland Annex neighborhood
- Westridge Place neighborhood
- Willow Creek neighborhood
- Winchester Hills neighborhood
- Winfield's View neighborhood
- Wolfes Acre Tracts neighborhood
- Wooded Ridge neighborhood
Religion statistics for Camas, WA (based on Clark County data)
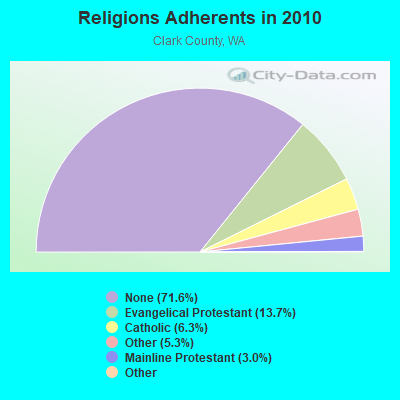
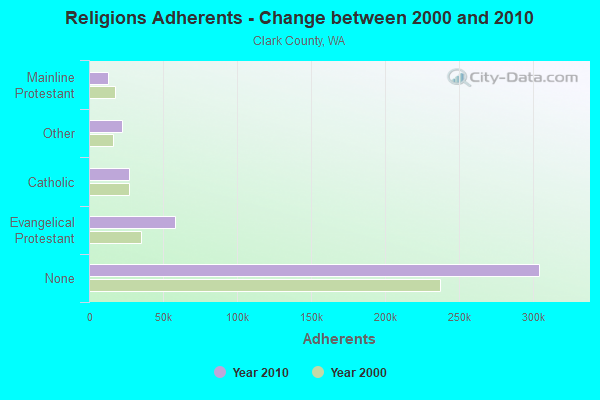
| Religion | Adherents | Congregations |
|---|---|---|
| Evangelical Protestant | 58,413 | 191 |
| Catholic | 26,886 | 9 |
| Other | 22,590 | 60 |
| Mainline Protestant | 12,633 | 37 |
| Black Protestant | 378 | 2 |
| Orthodox | 61 | 1 |
| None | 304,402 | - |
Food Environment Statistics:
| This county: | 1.10 / 10,000 pop. |
| Washington: | 2.06 / 10,000 pop. |
| This county: | 0.26 / 10,000 pop. |
| State: | 0.19 / 10,000 pop. |
| Clark County: | 0.94 / 10,000 pop. |
| Washington: | 1.18 / 10,000 pop. |
| This county: | 2.23 / 10,000 pop. |
| Washington: | 2.67 / 10,000 pop. |
| Clark County: | 5.74 / 10,000 pop. |
| Washington: | 8.26 / 10,000 pop. |
| This county: | 8.2% |
| Washington: | 7.7% |
| Clark County: | 27.6% |
| State: | 25.7% |
| Clark County: | 13.7% |
| Washington: | 13.9% |
Health and Nutrition:
| Camas: | 52.8% |
| State: | 49.9% |
| Camas: | 52.0% |
| Washington: | 47.2% |
| This city: | 28.3 |
| State: | 28.4 |
| This city: | 20.4% |
| Washington: | 20.9% |
| Camas: | 8.6% |
| Washington: | 10.5% |
| Here: | 6.9 |
| Washington: | 6.8 |
| Here: | 34.2% |
| Washington: | 32.8% |
| Camas: | 60.1% |
| Washington: | 56.8% |
| Camas: | 80.8% |
| Washington: | 79.4% |
More about Health and Nutrition of Camas, WA Residents
| Local government employment and payroll (March 2022) | |||||
| Function | Full-time employees | Monthly full-time payroll | Average yearly full-time wage | Part-time employees | Monthly part-time payroll |
|---|---|---|---|---|---|
| Firefighters | 67 | $762,553 | $136,577 | 0 | $0 |
| Police Protection - Officers | 28 | $257,848 | $110,506 | 0 | $0 |
| Other and Unallocable | 18 | $145,696 | $97,131 | 1 | $1,638 |
| Streets and Highways | 17 | $113,794 | $80,325 | 0 | $0 |
| Water Supply | 16 | $105,728 | $79,296 | 0 | $0 |
| Financial Administration | 16 | $110,254 | $82,691 | 0 | $0 |
| Local Libraries | 15 | $64,118 | $51,294 | 0 | $0 |
| Other Government Administration | 13 | $117,938 | $108,866 | 0 | $0 |
| Parks and Recreation | 9 | $72,313 | $96,417 | 4 | $5,010 |
| Sewerage | 9 | $71,202 | $94,936 | 0 | $0 |
| Fire - Other | 5 | $47,440 | $113,856 | 0 | $0 |
| Solid Waste Management | 4 | $39,208 | $117,624 | 0 | $0 |
| Police - Other | 4 | $39,102 | $117,306 | 1 | $2,962 |
| Housing and Community Development (Local) | 3 | $26,703 | $106,812 | 0 | $0 |
| Judicial and Legal | 2 | $10,741 | $64,446 | 1 | $2,144 |
| Correction | 0 | $0 | 2 | $7,374 | |
| Totals for Government | 226 | $1,984,638 | $105,379 | 9 | $19,128 |
Camas government finances - Expenditure in 2021 (per resident):
- Construction - Sewerage: $20,646,000 ($754.30)
Regular Highways: $10,130,000 ($370.10)
Parks and Recreation: $353,000 ($12.90)
General - Other: $53,000 ($1.94)
Local Fire Protection: $41,000 ($1.50)
- Current Operations - Local Fire Protection: $6,827,000 ($249.42)
Police Protection: $5,708,000 ($208.54)
Water Utilities: $4,733,000 ($172.92)
Health - Other: $4,160,000 ($151.99)
Sewerage: $3,948,000 ($144.24)
Solid Waste Management: $2,757,000 ($100.73)
Financial Administration: $2,264,000 ($82.72)
Regular Highways: $2,242,000 ($81.91)
General - Other: $2,016,000 ($73.65)
Central Staff Services: $1,661,000 ($60.68)
Parks and Recreation: $1,635,000 ($59.73)
Libraries: $1,617,000 ($59.08)
Protective Inspection and Regulation - Other: $764,000 ($27.91)
Judicial and Legal Services: $481,000 ($17.57)
General Public Buildings: $257,000 ($9.39)
Natural Resources - Other: $237,000 ($8.66)
Corrections - Other: $216,000 ($7.89)
Miscellaneous Commercial Activities - Other: $192,000 ($7.01)
- General - Interest on Debt: $2,984,000 ($109.02)
- Intergovernmental to Local - Other - Correctional Institutions: $90,000 ($3.29)
- Other Capital Outlay - Water Utilities: $5,859,000 ($214.06)
Sewerage: $3,933,000 ($143.69)
Libraries: $150,000 ($5.48)
Police Protection: $149,000 ($5.44)
Health - Other: $143,000 ($5.22)
Miscellaneous Commercial Activities - Other: $7,000 ($0.26)
- Total Salaries and Wages: $19,766,000 ($722.15)
- Water Utilities - Interest on Debt: $3,000 ($0.11)
Camas government finances - Revenue in 2021 (per resident):
- Charges - Sewerage: $10,007,000 ($365.61)
Other: $9,544,000 ($348.69)
Solid Waste Management: $2,938,000 ($107.34)
Miscellaneous Commercial Activities: $72,000 ($2.63)
Parks and Recreation: $8,000 ($0.29)
- Federal Intergovernmental - Health and Hospitals: $1,090,000 ($39.82)
- Local Intergovernmental - Other: $2,047,000 ($74.79)
- Miscellaneous - Interest Earnings: $1,122,000 ($40.99)
Fines and Forfeits: $161,000 ($5.88)
Rents: $149,000 ($5.44)
General Revenue - Other: $97,000 ($3.54)
Donations From Private Sources: $22,000 ($0.80)
Sale of Property: $5,000 ($0.18)
- Revenue - Water Utilities: $5,350,000 ($195.46)
- State Intergovernmental - Highways: $5,529,000 ($202.00)
Other: $824,000 ($30.10)
Health and Hospitals: $682,000 ($24.92)
General Local Government Support: $345,000 ($12.60)
- Tax - Property: $15,876,000 ($580.03)
Other License: $10,307,000 ($376.57)
General Sales and Gross Receipts: $5,447,000 ($199.01)
Documentary and Stock Transfer: $3,164,000 ($115.60)
Public Utilities Sales: $481,000 ($17.57)
Amusements Sales: $17,000 ($0.62)
Other Selective Sales: $16,000 ($0.58)
Occupation and Business License - Other: $12,000 ($0.44)
Camas government finances - Debt in 2021 (per resident):
- Long Term Debt - Outstanding Unspecified Public Purpose: $98,051,000 ($3582.30)
Beginning Outstanding - Unspecified Public Purpose: $81,335,000 ($2971.58)
Issue, Unspecified Public Purpose: $23,200,000 ($847.61)
Retired Unspecified Public Purpose: $6,485,000 ($236.93)
7.99% of this county's 2021 resident taxpayers lived in other counties in 2020 ($91,627 average adjusted gross income)
| Here: | 7.99% |
| Washington average: | 7.53% |
0.03% of residents moved from foreign countries ($212 average AGI)
Clark County: 0.03% Washington average: 0.05%
Top counties from which taxpayers relocated into this county between 2020 and 2021:
| from Multnomah County, OR | |
| from Washington County, OR | |
| from Clackamas County, OR |
6.69% of this county's 2020 resident taxpayers moved to other counties in 2021 ($81,466 average adjusted gross income)
| Here: | 6.69% |
| Washington average: | 7.40% |
0.01% of residents moved to foreign countries ($99 average AGI)
Clark County: 0.01% Washington average: 0.04%
Top counties to which taxpayers relocated from this county between 2020 and 2021:
| to Multnomah County, OR | |
| to Cowlitz County, WA | |
| to Washington County, OR |
| Businesses in Camas, WA | ||||
| Name | Count | Name | Count | |
|---|---|---|---|---|
| Curves | 1 | Nike | 1 | |
| Dairy Queen | 1 | Sears | 1 | |
| Domino's Pizza | 1 | Starbucks | 1 | |
| FedEx | 4 | T-Mobile | 1 | |
| Ford | 1 | Taco Bell | 1 | |
| H&R Block | 1 | U-Haul | 1 | |
| KFC | 1 | UPS | 2 | |
| Lane Furniture | 1 | Vons | 1 | |
| McDonald's | 1 | Walgreens | 1 | |
Strongest AM radio stations in Camas:
- KOTK (1080 AM; 50 kW; PORTLAND, OR; Owner: FISHER BROADCASTING - PORTLAND RADIO, L.L.C.)
- KPAM (860 AM; 50 kW; TROUTDALE, OR; Owner: PAMPLIN BROADCASTING-OREGON, INC.)
- KKAD (1550 AM; 50 kW; VANCOUVER, WA; Owner: PAMPLIN BROADCASTING-WASHINGTON, INC)
- KFXX (910 AM; 10 kW; VANCOUVER, WA; Owner: ENTERCOM PORTLAND LICENSE, LLC (DE))
- KPOJ (620 AM; 50 kW; PORTLAND, OR; Owner: CITICASTERS LICENSES, L.P.)
- KXL (750 AM; 50 kW; PORTLAND, OR; Owner: ROSE CITY RADIO CORPORATION)
- KEX (1190 AM; 50 kW; PORTLAND, OR; Owner: CITICASTERS LICENSES, L.P.)
- KKSN (1520 AM; 50 kW; OREGON CITY, OR; Owner: ENTERCOM PORTLAND LICENSE, LLC)
- KGUY (1010 AM; daytime; 4 kW; MILWAUKIE, OR; Owner: NORTHWEST RADIO BROADCASTING COMPANY)
- KDZR (1640 AM; 10 kW; LAKE OSWEGO, OR; Owner: ABC, INC.)
- KKGT (1150 AM; 5 kW; PORTLAND, OR; Owner: WESTERN BROADCASTING COMPANY)
- KKSL (1290 AM; 10 kW; LAKE OSWEGO, OR; Owner: ABC, INC.)
- KKPZ (1330 AM; 5 kW; PORTLAND, OR; Owner: KPHP RADIO, INC.)
Strongest FM radio stations in Camas:
- KINK (101.9 FM; PORTLAND, OR; Owner: INFINITY RADIO OPERATIONS INC.)
- KKCW (103.3 FM; BEAVERTON, OR; Owner: CITICASTERS LICENSES, L.P.)
- KRVO (105.9 FM; VANCOUVER, WA; Owner: CITICASTERS LICENSES, L.P.)
- KOPB-FM (91.5 FM; PORTLAND, OR; Owner: OREGON PUBLIC BROADCASTING)
- KPDQ-FM (93.7 FM; PORTLAND, OR; Owner: SALEM MEDIA OF OREGON, INC.)
- KKRZ (100.3 FM; PORTLAND, OR; Owner: CITICASTERS LICENSES, L.P.)
- KUFO-FM (101.1 FM; PORTLAND, OR; Owner: INFINITY RADIO OPERATIONS INC.)
- KMHD (89.1 FM; GRESHAM, OR; Owner: MT. HOOD COMMUNITY COLLEGE DISTRICT)
- KVMX (107.5 FM; BANKS, OR; Owner: INFINITY RADIO OPERATIONS INC.)
- KLTH (106.7 FM; LAKE OSWEGO, OR; Owner: INIFINITY RADIO OF PORTLAND INC.)
- KUPL-FM (98.7 FM; PORTLAND, OR; Owner: INFINITY RADIO OF PORTLAND INC.)
- KNRK (94.7 FM; CAMAS, WA; Owner: ENTERCOM PORTLAND LICENSE, LLC (DE))
- KBVM (88.3 FM; PORTLAND, OR; Owner: CATHOLIC BROADCASTING NORTHWEST, INC)
- KFIS (104.1 FM; SCAPPOOSE, OR; Owner: CARON BROADCASTING, INC.)
- KGON (92.3 FM; PORTLAND, OR; Owner: ENTERCOM PORTLAND LICENSE, LLC (DE))
- KKSN-FM (97.1 FM; PORTLAND, OR; Owner: ENTERCOM PORTLAND LICENSE, LLC (DE))
- KXJM (95.5 FM; PORTLAND, OR; Owner: ROSE CITY RADIO CORPORATION)
- KBOO (90.7 FM; PORTLAND, OR; Owner: THE KBOO FOUNDATION)
- KWJJ-FM (99.5 FM; PORTLAND, OR; Owner: FISHER BROADCASTING - PORTLAND RADIO, L.L.C.)
- KBPS-FM (89.9 FM; PORTLAND, OR; Owner: SCHOOL DISTRICT #1, MULTNOMAH COUNTY, OR)
TV broadcast stations around Camas:
- KATU (Channel 2; PORTLAND, OR; Owner: FISHER BROADCASTING - PORTLAND TV, L.L.C.)
- KPDX (Channel 49; VANCOUVER, WA; Owner: MEREDITH CORPORATION)
- KPTV (Channel 12; PORTLAND, OR; Owner: MEREDITH CORPORATION)
- KOIN (Channel 6; PORTLAND, OR; Owner: EMMIS TELEVISION LICENSE CORPORATION)
- KNMT (Channel 24; PORTLAND, OR; Owner: NATIONAL MINORITY T.V., INC.)
- K57IF (Channel 57; SALEM, OR; Owner: LaGRANDE BROADCASTING, INC.)
- KGW (Channel 8; PORTLAND, OR; Owner: KING BROADCASTING COMPANY)
- KOPB-TV (Channel 10; PORTLAND, OR; Owner: OREGON PUBLIC BROADCASTING)
- KPXG-LP (Channel 54; PORTLAND, OR; Owner: PAXSON COMMUNICATIONS LICENSE COMPANY, LLC)
- K14HN (Channel 14; VANCOUVER/CAMAS, WA; Owner: MEREDITH CORPORATION)
- KWBP-LP (Channel 4; PORTLAND, OR; Owner: TRIBUNE BROADCASTING HOLDINGS, INC.)
- KWBP (Channel 32; SALEM, OR; Owner: TRIBUNE BROADCAST HOLDINGS, INC.)
- K58CO (Channel 58; PORTLAND, OR; Owner: NORTHWEST CHRISTIAN BROADCASTING)
- K16CB (Channel 16; HAPPY VALLEY, OR; Owner: MEREDITH CORPORATION)
- KOXI-CA (Channel 19; CAMAS, WA; Owner: WATCHTV, INC.)
- KKEI-CA (Channel 56; PORTLAND, OR; Owner: WATCHTV, INC.)
- KORK-CA (Channel 35; PORTLAND, OR; Owner: WATCHTV, INC.)
- National Bridge Inventory (NBI) Statistics
- 23Number of bridges
- 358ft / 109mTotal length
- $73,687,000Total costs
- 219,662Total average daily traffic
- 14,391Total average daily truck traffic
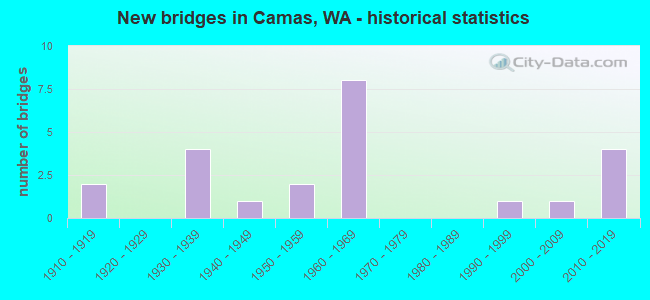
- New bridges - historical statistics
- 21910-1919
- 41930-1939
- 11940-1949
- 21950-1959
- 81960-1969
- 11990-1999
- 12000-2009
- 42010-2019
FCC Registered Antenna Towers: 87 (See the full list of FCC Registered Antenna Towers)
FCC Registered Private Land Mobile Towers: 5 (See the full list of FCC Registered Private Land Mobile Towers in Camas, WA)
FCC Registered Broadcast Land Mobile Towers: 23 (See the full list of FCC Registered Broadcast Land Mobile Towers)
FCC Registered Microwave Towers: 40 (See the full list of FCC Registered Microwave Towers in this town)
FCC Registered Paging Towers: 10 (See the full list of FCC Registered Paging Towers)
FCC Registered Maritime Coast & Aviation Ground Towers: 4 (See the full list of FCC Registered Maritime Coast & Aviation Ground Towers)
FCC Registered Amateur Radio Licenses: 292 (See the full list of FCC Registered Amateur Radio Licenses in Camas)
FAA Registered Aircraft: 64 (See the full list of FAA Registered Aircraft in Camas)
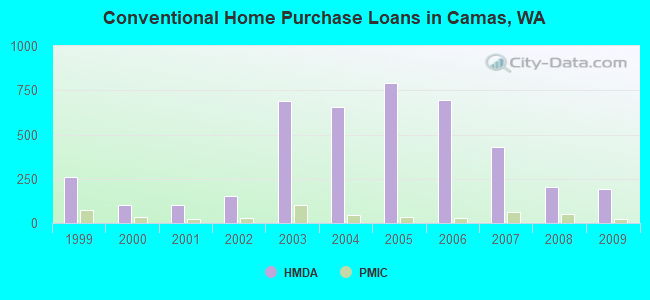
| Home Mortgage Disclosure Act Aggregated Statistics For Year 2009 (Based on 4 partial tracts) | ||||||||||||
| A) FHA, FSA/RHS & VA Home Purchase Loans | B) Conventional Home Purchase Loans | C) Refinancings | D) Home Improvement Loans | F) Non-occupant Loans on < 5 Family Dwellings (A B C & D) | G) Loans On Manufactured Home Dwelling (A B C & D) | |||||||
|---|---|---|---|---|---|---|---|---|---|---|---|---|
| Number | Average Value | Number | Average Value | Number | Average Value | Number | Average Value | Number | Average Value | Number | Average Value | |
| LOANS ORIGINATED | 98 | $226,990 | 190 | $267,998 | 713 | $244,245 | 18 | $122,662 | 42 | $177,839 | 0 | $0 |
| APPLICATIONS APPROVED, NOT ACCEPTED | 9 | $196,243 | 19 | $367,532 | 91 | $261,574 | 2 | $110,565 | 5 | $184,318 | 0 | $0 |
| APPLICATIONS DENIED | 19 | $244,987 | 31 | $317,982 | 186 | $277,200 | 5 | $140,670 | 13 | $192,308 | 1 | $23,910 |
| APPLICATIONS WITHDRAWN | 16 | $222,634 | 25 | $267,254 | 141 | $269,606 | 3 | $119,473 | 15 | $182,693 | 0 | $0 |
| FILES CLOSED FOR INCOMPLETENESS | 4 | $211,708 | 8 | $360,910 | 45 | $278,960 | 2 | $267,120 | 3 | $254,493 | 0 | $0 |
Detailed HMDA statistics for the following Tracts: 0406.06 , 0413.24, 0414.00, 0415.00
| Private Mortgage Insurance Companies Aggregated Statistics For Year 2009 (Based on 4 partial tracts) | ||||||
| A) Conventional Home Purchase Loans | B) Refinancings | C) Non-occupant Loans on < 5 Family Dwellings (A & B) | ||||
|---|---|---|---|---|---|---|
| Number | Average Value | Number | Average Value | Number | Average Value | |
| LOANS ORIGINATED | 24 | $247,323 | 15 | $249,895 | 1 | $122,240 |
| APPLICATIONS APPROVED, NOT ACCEPTED | 5 | $315,024 | 4 | $272,182 | 0 | $0 |
| APPLICATIONS DENIED | 5 | $293,844 | 6 | $356,627 | 0 | $0 |
| APPLICATIONS WITHDRAWN | 1 | $158,460 | 0 | $0 | 0 | $0 |
| FILES CLOSED FOR INCOMPLETENESS | 0 | $0 | 0 | $0 | 0 | $0 |
Detailed PMIC statistics for the following Tracts: 0406.06 , 0413.24, 0414.00, 0415.00
2002 - 2018 National Fire Incident Reporting System (NFIRS) incidents
- Fire incident types reported to NFIRS in Camas, WA
- 49240.8%Structure Fires
- 47839.6%Outside Fires
- 17114.2%Mobile Property/Vehicle Fires
- 655.4%Other
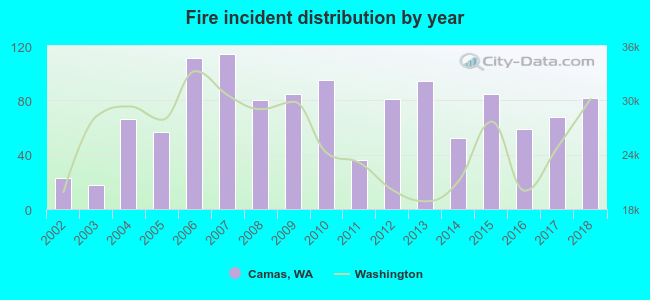 According to the data from the years 2002 - 2018 the average number of fire incidents per year is 71. The highest number of reported fire incidents - 114 took place in 2007, and the least - 18 in 2003. The data has a rising trend.
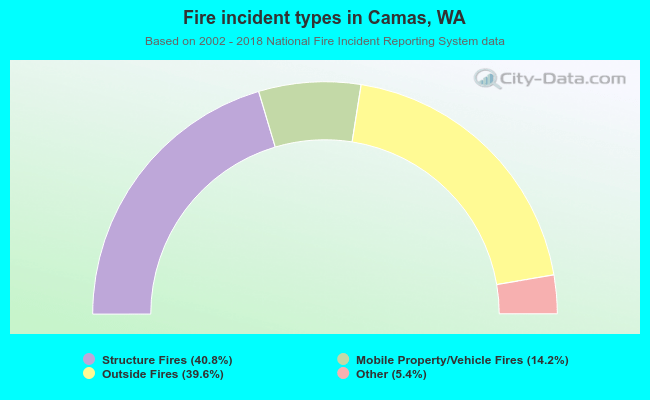 When looking into fire subcategories, the most reports belonged to: Structure Fires (40.8%), and Outside Fires (39.6%).
| Most common first names in Camas, WA among deceased individuals | ||
| Name | Count | Lived (average) |
|---|---|---|
| William | 76 | 76.4 years |
| John | 75 | 73.7 years |
| Robert | 62 | 72.9 years |
| Mary | 58 | 79.7 years |
| James | 57 | 71.7 years |
| George | 43 | 78.0 years |
| Charles | 42 | 76.6 years |
| Margaret | 41 | 81.8 years |
| Donald | 31 | 72.7 years |
| Ruth | 27 | 80.3 years |
| Most common last names in Camas, WA among deceased individuals | ||
| Last name | Count | Lived (average) |
|---|---|---|
| Smith | 27 | 78.3 years |
| Johnson | 23 | 77.2 years |
| Brown | 23 | 76.1 years |
| Wilson | 17 | 74.8 years |
| Anderson | 16 | 78.9 years |
| Miller | 15 | 75.9 years |
| Jones | 14 | 79.5 years |
| Williams | 13 | 77.5 years |
| Thompson | 12 | 75.1 years |
| Morgan | 12 | 71.7 years |
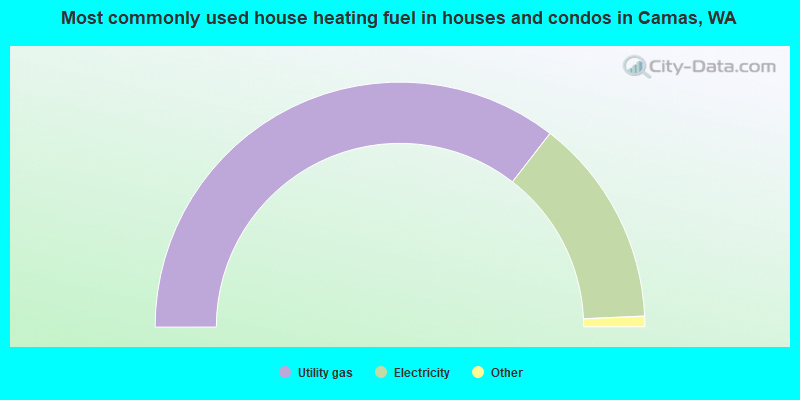
- 71.0%Utility gas
- 27.6%Electricity
- 0.7%Fuel oil, kerosene, etc.
- 0.6%Bottled, tank, or LP gas
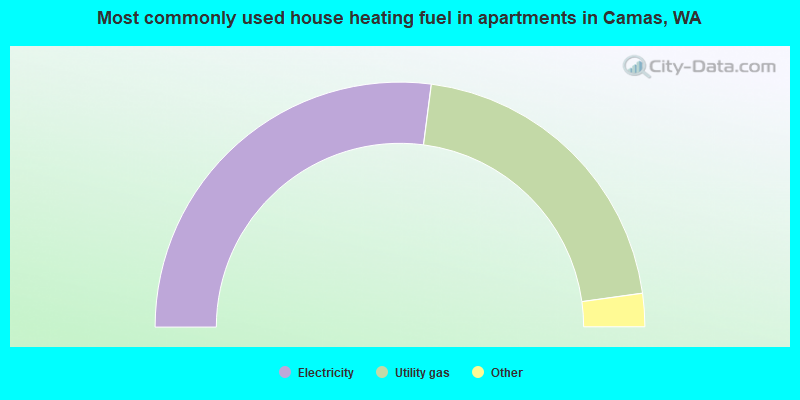
- 54.1%Electricity
- 41.5%Utility gas
- 2.0%Wood
- 1.5%Bottled, tank, or LP gas
- 1.0%Fuel oil, kerosene, etc.
Camas compared to Washington state average:
- Unemployed percentage significantly below state average.
- Median age above state average.
- Foreign-born population percentage above state average.
- Renting percentage below state average.
- Length of stay since moving in significantly above state average.
- Number of rooms per house above state average.
- House age below state average.
- Percentage of population with a bachelor's degree or higher above state average.

|
|
Total of 1307 patent applications in 2008-2024.