Evergreen, Colorado Submit your own pictures of this place and show them to the world
OSM Map
General Map
Google Map
MSN Map
OSM Map
General Map
Google Map
MSN Map
OSM Map
General Map
Google Map
MSN Map
OSM Map
General Map
Google Map
MSN Map
Please wait while loading the map...
Population in 2010: 9,038. Population change since 2000: -1.9%Males: 4,368 Females: 4,670
March 2022 cost of living index in Evergreen: 109.6 (more than average, U.S. average is 100) Percentage of residents living in poverty in 2022: 4.1%for White Non-Hispanic residents , 12.1% for Black residents , 0.5% for Hispanic or Latino residents , 75.0% for American Indian residents , 0.9% for two or more races residents )
Profiles of local businesses
Business Search - 14 Million verified businesses
Data:
Median household income ($)
Median household income (% change since 2000)
Household income diversity
Ratio of average income to average house value (%)
Ratio of average income to average rent
Median household income ($) - White
Median household income ($) - Black or African American
Median household income ($) - Asian
Median household income ($) - Hispanic or Latino
Median household income ($) - American Indian and Alaska Native
Median household income ($) - Multirace
Median household income ($) - Other Race
Median household income for houses/condos with a mortgage ($)
Median household income for apartments without a mortgage ($)
Races - White alone (%)
Races - White alone (% change since 2000)
Races - Black alone (%)
Races - Black alone (% change since 2000)
Races - American Indian alone (%)
Races - American Indian alone (% change since 2000)
Races - Asian alone (%)
Races - Asian alone (% change since 2000)
Races - Hispanic (%)
Races - Hispanic (% change since 2000)
Races - Native Hawaiian and Other Pacific Islander alone (%)
Races - Native Hawaiian and Other Pacific Islander alone (% change since 2000)
Races - Two or more races (%)
Races - Two or more races (% change since 2000)
Races - Other race alone (%)
Races - Other race alone (% change since 2000)
Racial diversity
Unemployment (%)
Unemployment (% change since 2000)
Unemployment (%) - White
Unemployment (%) - Black or African American
Unemployment (%) - Asian
Unemployment (%) - Hispanic or Latino
Unemployment (%) - American Indian and Alaska Native
Unemployment (%) - Multirace
Unemployment (%) - Other Race
Population density (people per square mile)
Population - Males (%)
Population - Females (%)
Population - Males (%) - White
Population - Males (%) - Black or African American
Population - Males (%) - Asian
Population - Males (%) - Hispanic or Latino
Population - Males (%) - American Indian and Alaska Native
Population - Males (%) - Multirace
Population - Males (%) - Other Race
Population - Females (%) - White
Population - Females (%) - Black or African American
Population - Females (%) - Asian
Population - Females (%) - Hispanic or Latino
Population - Females (%) - American Indian and Alaska Native
Population - Females (%) - Multirace
Population - Females (%) - Other Race
Coronavirus confirmed cases (Apr 27, 2024)
Deaths caused by coronavirus (Apr 27, 2024)
Coronavirus confirmed cases (per 100k population) (Apr 27, 2024)
Deaths caused by coronavirus (per 100k population) (Apr 27, 2024)
Daily increase in number of cases (Apr 27, 2024)
Weekly increase in number of cases (Apr 27, 2024)
Cases doubled (in days) (Apr 27, 2024)
Hospitalized patients (Apr 18, 2022)
Negative test results (Apr 18, 2022)
Total test results (Apr 18, 2022)
COVID Vaccine doses distributed (per 100k population) (Sep 19, 2023)
COVID Vaccine doses administered (per 100k population) (Sep 19, 2023)
COVID Vaccine doses distributed (Sep 19, 2023)
COVID Vaccine doses administered (Sep 19, 2023)
Likely homosexual households (%)
Likely homosexual households (% change since 2000)
Likely homosexual households - Lesbian couples (%)
Likely homosexual households - Lesbian couples (% change since 2000)
Likely homosexual households - Gay men (%)
Likely homosexual households - Gay men (% change since 2000)
Cost of living index
Median gross rent ($)
Median contract rent ($)
Median monthly housing costs ($)
Median house or condo value ($)
Median house or condo value ($ change since 2000)
Mean house or condo value by units in structure - 1, detached ($)
Mean house or condo value by units in structure - 1, attached ($)
Mean house or condo value by units in structure - 2 ($)
Mean house or condo value by units in structure by units in structure - 3 or 4 ($)
Mean house or condo value by units in structure - 5 or more ($)
Mean house or condo value by units in structure - Boat, RV, van, etc. ($)
Mean house or condo value by units in structure - Mobile home ($)
Median house or condo value ($) - White
Median house or condo value ($) - Black or African American
Median house or condo value ($) - Asian
Median house or condo value ($) - Hispanic or Latino
Median house or condo value ($) - American Indian and Alaska Native
Median house or condo value ($) - Multirace
Median house or condo value ($) - Other Race
Median resident age
Resident age diversity
Median resident age - Males
Median resident age - Females
Median resident age - White
Median resident age - Black or African American
Median resident age - Asian
Median resident age - Hispanic or Latino
Median resident age - American Indian and Alaska Native
Median resident age - Multirace
Median resident age - Other Race
Median resident age - Males - White
Median resident age - Males - Black or African American
Median resident age - Males - Asian
Median resident age - Males - Hispanic or Latino
Median resident age - Males - American Indian and Alaska Native
Median resident age - Males - Multirace
Median resident age - Males - Other Race
Median resident age - Females - White
Median resident age - Females - Black or African American
Median resident age - Females - Asian
Median resident age - Females - Hispanic or Latino
Median resident age - Females - American Indian and Alaska Native
Median resident age - Females - Multirace
Median resident age - Females - Other Race
Commute - mean travel time to work (minutes)
Travel time to work - Less than 5 minutes (%)
Travel time to work - Less than 5 minutes (% change since 2000)
Travel time to work - 5 to 9 minutes (%)
Travel time to work - 5 to 9 minutes (% change since 2000)
Travel time to work - 10 to 19 minutes (%)
Travel time to work - 10 to 19 minutes (% change since 2000)
Travel time to work - 20 to 29 minutes (%)
Travel time to work - 20 to 29 minutes (% change since 2000)
Travel time to work - 30 to 39 minutes (%)
Travel time to work - 30 to 39 minutes (% change since 2000)
Travel time to work - 40 to 59 minutes (%)
Travel time to work - 40 to 59 minutes (% change since 2000)
Travel time to work - 60 to 89 minutes (%)
Travel time to work - 60 to 89 minutes (% change since 2000)
Travel time to work - 90 or more minutes (%)
Travel time to work - 90 or more minutes (% change since 2000)
Marital status - Never married (%)
Marital status - Now married (%)
Marital status - Separated (%)
Marital status - Widowed (%)
Marital status - Divorced (%)
Median family income ($)
Median family income (% change since 2000)
Median non-family income ($)
Median non-family income (% change since 2000)
Median per capita income ($)
Median per capita income (% change since 2000)
Median family income ($) - White
Median family income ($) - Black or African American
Median family income ($) - Asian
Median family income ($) - Hispanic or Latino
Median family income ($) - American Indian and Alaska Native
Median family income ($) - Multirace
Median family income ($) - Other Race
Median year house/condo built
Median year apartment built
Year house built - Built 2005 or later (%)
Year house built - Built 2000 to 2004 (%)
Year house built - Built 1990 to 1999 (%)
Year house built - Built 1980 to 1989 (%)
Year house built - Built 1970 to 1979 (%)
Year house built - Built 1960 to 1969 (%)
Year house built - Built 1950 to 1959 (%)
Year house built - Built 1940 to 1949 (%)
Year house built - Built 1939 or earlier (%)
Average household size
Household density (households per square mile)
Average household size - White
Average household size - Black or African American
Average household size - Asian
Average household size - Hispanic or Latino
Average household size - American Indian and Alaska Native
Average household size - Multirace
Average household size - Other Race
Occupied housing units (%)
Vacant housing units (%)
Owner occupied housing units (%)
Renter occupied housing units (%)
Vacancy status - For rent (%)
Vacancy status - For sale only (%)
Vacancy status - Rented or sold, not occupied (%)
Vacancy status - For seasonal, recreational, or occasional use (%)
Vacancy status - For migrant workers (%)
Vacancy status - Other vacant (%)
Residents with income below the poverty level (%)
Residents with income below 50% of the poverty level (%)
Children below poverty level (%)
Poor families by family type - Married-couple family (%)
Poor families by family type - Male, no wife present (%)
Poor families by family type - Female, no husband present (%)
Poverty status for native-born residents (%)
Poverty status for foreign-born residents (%)
Poverty among high school graduates not in families (%)
Poverty among people who did not graduate high school not in families (%)
Residents with income below the poverty level (%) - White
Residents with income below the poverty level (%) - Black or African American
Residents with income below the poverty level (%) - Asian
Residents with income below the poverty level (%) - Hispanic or Latino
Residents with income below the poverty level (%) - American Indian and Alaska Native
Residents with income below the poverty level (%) - Multirace
Residents with income below the poverty level (%) - Other Race
Air pollution - Air Quality Index (AQI)
Air pollution - CO
Air pollution - NO2
Air pollution - SO2
Air pollution - Ozone
Air pollution - PM10
Air pollution - PM25
Air pollution - Pb
Crime - Murders per 100,000 population
Crime - Rapes per 100,000 population
Crime - Robberies per 100,000 population
Crime - Assaults per 100,000 population
Crime - Burglaries per 100,000 population
Crime - Thefts per 100,000 population
Crime - Auto thefts per 100,000 population
Crime - Arson per 100,000 population
Crime - City-data.com crime index
Crime - Violent crime index
Crime - Property crime index
Crime - Murders per 100,000 population (5 year average)
Crime - Rapes per 100,000 population (5 year average)
Crime - Robberies per 100,000 population (5 year average)
Crime - Assaults per 100,000 population (5 year average)
Crime - Burglaries per 100,000 population (5 year average)
Crime - Thefts per 100,000 population (5 year average)
Crime - Auto thefts per 100,000 population (5 year average)
Crime - Arson per 100,000 population (5 year average)
Crime - City-data.com crime index (5 year average)
Crime - Violent crime index (5 year average)
Crime - Property crime index (5 year average)
1996 Presidential Elections Results (%) - Democratic Party (Clinton)
1996 Presidential Elections Results (%) - Republican Party (Dole)
1996 Presidential Elections Results (%) - Other
2000 Presidential Elections Results (%) - Democratic Party (Gore)
2000 Presidential Elections Results (%) - Republican Party (Bush)
2000 Presidential Elections Results (%) - Other
2004 Presidential Elections Results (%) - Democratic Party (Kerry)
2004 Presidential Elections Results (%) - Republican Party (Bush)
2004 Presidential Elections Results (%) - Other
2008 Presidential Elections Results (%) - Democratic Party (Obama)
2008 Presidential Elections Results (%) - Republican Party (McCain)
2008 Presidential Elections Results (%) - Other
2012 Presidential Elections Results (%) - Democratic Party (Obama)
2012 Presidential Elections Results (%) - Republican Party (Romney)
2012 Presidential Elections Results (%) - Other
2016 Presidential Elections Results (%) - Democratic Party (Clinton)
2016 Presidential Elections Results (%) - Republican Party (Trump)
2016 Presidential Elections Results (%) - Other
2020 Presidential Elections Results (%) - Democratic Party (Biden)
2020 Presidential Elections Results (%) - Republican Party (Trump)
2020 Presidential Elections Results (%) - Other
Ancestries Reported - Arab (%)
Ancestries Reported - Czech (%)
Ancestries Reported - Danish (%)
Ancestries Reported - Dutch (%)
Ancestries Reported - English (%)
Ancestries Reported - French (%)
Ancestries Reported - French Canadian (%)
Ancestries Reported - German (%)
Ancestries Reported - Greek (%)
Ancestries Reported - Hungarian (%)
Ancestries Reported - Irish (%)
Ancestries Reported - Italian (%)
Ancestries Reported - Lithuanian (%)
Ancestries Reported - Norwegian (%)
Ancestries Reported - Polish (%)
Ancestries Reported - Portuguese (%)
Ancestries Reported - Russian (%)
Ancestries Reported - Scotch-Irish (%)
Ancestries Reported - Scottish (%)
Ancestries Reported - Slovak (%)
Ancestries Reported - Subsaharan African (%)
Ancestries Reported - Swedish (%)
Ancestries Reported - Swiss (%)
Ancestries Reported - Ukrainian (%)
Ancestries Reported - United States (%)
Ancestries Reported - Welsh (%)
Ancestries Reported - West Indian (%)
Ancestries Reported - Other (%)
Educational Attainment - No schooling completed (%)
Educational Attainment - Less than high school (%)
Educational Attainment - High school or equivalent (%)
Educational Attainment - Less than 1 year of college (%)
Educational Attainment - 1 or more years of college (%)
Educational Attainment - Associate degree (%)
Educational Attainment - Bachelor's degree (%)
Educational Attainment - Master's degree (%)
Educational Attainment - Professional school degree (%)
Educational Attainment - Doctorate degree (%)
School Enrollment - Nursery, preschool (%)
School Enrollment - Kindergarten (%)
School Enrollment - Grade 1 to 4 (%)
School Enrollment - Grade 5 to 8 (%)
School Enrollment - Grade 9 to 12 (%)
School Enrollment - College undergrad (%)
School Enrollment - Graduate or professional (%)
School Enrollment - Not enrolled in school (%)
School enrollment - Public schools (%)
School enrollment - Private schools (%)
School enrollment - Not enrolled (%)
Median number of rooms in houses and condos
Median number of rooms in apartments
Housing units lacking complete plumbing facilities (%)
Housing units lacking complete kitchen facilities (%)
Density of houses
Urban houses (%)
Rural houses (%)
Households with people 60 years and over (%)
Households with people 65 years and over (%)
Households with people 75 years and over (%)
Households with one or more nonrelatives (%)
Households with no nonrelatives (%)
Population in households (%)
Family households (%)
Nonfamily households (%)
Population in families (%)
Family households with own children (%)
Median number of bedrooms in owner occupied houses
Mean number of bedrooms in owner occupied houses
Median number of bedrooms in renter occupied houses
Mean number of bedrooms in renter occupied houses
Median number of vehichles in owner occupied houses
Mean number of vehichles in owner occupied houses
Median number of vehichles in renter occupied houses
Mean number of vehichles in renter occupied houses
Mortgage status - with mortgage (%)
Mortgage status - with second mortgage (%)
Mortgage status - with home equity loan (%)
Mortgage status - with both second mortgage and home equity loan (%)
Mortgage status - without a mortgage (%)
Average family size
Average family size - White
Average family size - Black or African American
Average family size - Asian
Average family size - Hispanic or Latino
Average family size - American Indian and Alaska Native
Average family size - Multirace
Average family size - Other Race
Geographical mobility - Same house 1 year ago (%)
Geographical mobility - Moved within same county (%)
Geographical mobility - Moved from different county within same state (%)
Geographical mobility - Moved from different state (%)
Geographical mobility - Moved from abroad (%)
Place of birth - Born in state of residence (%)
Place of birth - Born in other state (%)
Place of birth - Native, outside of US (%)
Place of birth - Foreign born (%)
Housing units in structures - 1, detached (%)
Housing units in structures - 1, attached (%)
Housing units in structures - 2 (%)
Housing units in structures - 3 or 4 (%)
Housing units in structures - 5 to 9 (%)
Housing units in structures - 10 to 19 (%)
Housing units in structures - 20 to 49 (%)
Housing units in structures - 50 or more (%)
Housing units in structures - Mobile home (%)
Housing units in structures - Boat, RV, van, etc. (%)
House/condo owner moved in on average (years ago)
Renter moved in on average (years ago)
Year householder moved into unit - Moved in 1999 to March 2000 (%)
Year householder moved into unit - Moved in 1995 to 1998 (%)
Year householder moved into unit - Moved in 1990 to 1994 (%)
Year householder moved into unit - Moved in 1980 to 1989 (%)
Year householder moved into unit - Moved in 1970 to 1979 (%)
Year householder moved into unit - Moved in 1969 or earlier (%)
Means of transportation to work - Drove car alone (%)
Means of transportation to work - Carpooled (%)
Means of transportation to work - Public transportation (%)
Means of transportation to work - Bus or trolley bus (%)
Means of transportation to work - Streetcar or trolley car (%)
Means of transportation to work - Subway or elevated (%)
Means of transportation to work - Railroad (%)
Means of transportation to work - Ferryboat (%)
Means of transportation to work - Taxicab (%)
Means of transportation to work - Motorcycle (%)
Means of transportation to work - Bicycle (%)
Means of transportation to work - Walked (%)
Means of transportation to work - Other means (%)
Working at home (%)
Industry diversity
Most Common Industries - Agriculture, forestry, fishing and hunting, and mining (%)
Most Common Industries - Agriculture, forestry, fishing and hunting (%)
Most Common Industries - Mining, quarrying, and oil and gas extraction (%)
Most Common Industries - Construction (%)
Most Common Industries - Manufacturing (%)
Most Common Industries - Wholesale trade (%)
Most Common Industries - Retail trade (%)
Most Common Industries - Transportation and warehousing, and utilities (%)
Most Common Industries - Transportation and warehousing (%)
Most Common Industries - Utilities (%)
Most Common Industries - Information (%)
Most Common Industries - Finance and insurance, and real estate and rental and leasing (%)
Most Common Industries - Finance and insurance (%)
Most Common Industries - Real estate and rental and leasing (%)
Most Common Industries - Professional, scientific, and management, and administrative and waste management services (%)
Most Common Industries - Professional, scientific, and technical services (%)
Most Common Industries - Management of companies and enterprises (%)
Most Common Industries - Administrative and support and waste management services (%)
Most Common Industries - Educational services, and health care and social assistance (%)
Most Common Industries - Educational services (%)
Most Common Industries - Health care and social assistance (%)
Most Common Industries - Arts, entertainment, and recreation, and accommodation and food services (%)
Most Common Industries - Arts, entertainment, and recreation (%)
Most Common Industries - Accommodation and food services (%)
Most Common Industries - Other services, except public administration (%)
Most Common Industries - Public administration (%)
Occupation diversity
Most Common Occupations - Management, business, science, and arts occupations (%)
Most Common Occupations - Management, business, and financial occupations (%)
Most Common Occupations - Management occupations (%)
Most Common Occupations - Business and financial operations occupations (%)
Most Common Occupations - Computer, engineering, and science occupations (%)
Most Common Occupations - Computer and mathematical occupations (%)
Most Common Occupations - Architecture and engineering occupations (%)
Most Common Occupations - Life, physical, and social science occupations (%)
Most Common Occupations - Education, legal, community service, arts, and media occupations (%)
Most Common Occupations - Community and social service occupations (%)
Most Common Occupations - Legal occupations (%)
Most Common Occupations - Education, training, and library occupations (%)
Most Common Occupations - Arts, design, entertainment, sports, and media occupations (%)
Most Common Occupations - Healthcare practitioners and technical occupations (%)
Most Common Occupations - Health diagnosing and treating practitioners and other technical occupations (%)
Most Common Occupations - Health technologists and technicians (%)
Most Common Occupations - Service occupations (%)
Most Common Occupations - Healthcare support occupations (%)
Most Common Occupations - Protective service occupations (%)
Most Common Occupations - Fire fighting and prevention, and other protective service workers including supervisors (%)
Most Common Occupations - Law enforcement workers including supervisors (%)
Most Common Occupations - Food preparation and serving related occupations (%)
Most Common Occupations - Building and grounds cleaning and maintenance occupations (%)
Most Common Occupations - Personal care and service occupations (%)
Most Common Occupations - Sales and office occupations (%)
Most Common Occupations - Sales and related occupations (%)
Most Common Occupations - Office and administrative support occupations (%)
Most Common Occupations - Natural resources, construction, and maintenance occupations (%)
Most Common Occupations - Farming, fishing, and forestry occupations (%)
Most Common Occupations - Construction and extraction occupations (%)
Most Common Occupations - Installation, maintenance, and repair occupations (%)
Most Common Occupations - Production, transportation, and material moving occupations (%)
Most Common Occupations - Production occupations (%)
Most Common Occupations - Transportation occupations (%)
Most Common Occupations - Material moving occupations (%)
People in Group quarters - Institutionalized population (%)
People in Group quarters - Correctional institutions (%)
People in Group quarters - Federal prisons and detention centers (%)
People in Group quarters - Halfway houses (%)
People in Group quarters - Local jails and other confinement facilities (including police lockups) (%)
People in Group quarters - Military disciplinary barracks (%)
People in Group quarters - State prisons (%)
People in Group quarters - Other types of correctional institutions (%)
People in Group quarters - Nursing homes (%)
People in Group quarters - Hospitals/wards, hospices, and schools for the handicapped (%)
People in Group quarters - Hospitals/wards and hospices for chronically ill (%)
People in Group quarters - Hospices or homes for chronically ill (%)
People in Group quarters - Military hospitals or wards for chronically ill (%)
People in Group quarters - Other hospitals or wards for chronically ill (%)
People in Group quarters - Hospitals or wards for drug/alcohol abuse (%)
People in Group quarters - Mental (Psychiatric) hospitals or wards (%)
People in Group quarters - Schools, hospitals, or wards for the mentally retarded (%)
People in Group quarters - Schools, hospitals, or wards for the physically handicapped (%)
People in Group quarters - Institutions for the deaf (%)
People in Group quarters - Institutions for the blind (%)
People in Group quarters - Orthopedic wards and institutions for the physically handicapped (%)
People in Group quarters - Wards in general hospitals for patients who have no usual home elsewhere (%)
People in Group quarters - Wards in military hospitals for patients who have no usual home elsewhere (%)
People in Group quarters - Juvenile institutions (%)
People in Group quarters - Long-term care (%)
People in Group quarters - Homes for abused, dependent, and neglected children (%)
People in Group quarters - Residential treatment centers for emotionally disturbed children (%)
People in Group quarters - Training schools for juvenile delinquents (%)
People in Group quarters - Short-term care, detention or diagnostic centers for delinquent children (%)
People in Group quarters - Type of juvenile institution unknown (%)
People in Group quarters - Noninstitutionalized population (%)
People in Group quarters - College dormitories (includes college quarters off campus) (%)
People in Group quarters - Military quarters (%)
People in Group quarters - On base (%)
People in Group quarters - Barracks, unaccompanied personnel housing (UPH), (Enlisted/Officer), ;and similar group living quarters for military personnel (%)
People in Group quarters - Transient quarters for temporary residents (%)
People in Group quarters - Military ships (%)
People in Group quarters - Group homes (%)
People in Group quarters - Homes or halfway houses for drug/alcohol abuse (%)
People in Group quarters - Homes for the mentally ill (%)
People in Group quarters - Homes for the mentally retarded (%)
People in Group quarters - Homes for the physically handicapped (%)
People in Group quarters - Other group homes (%)
People in Group quarters - Religious group quarters (%)
People in Group quarters - Dormitories (%)
People in Group quarters - Agriculture workers' dormitories on farms (%)
People in Group quarters - Job Corps and vocational training facilities (%)
People in Group quarters - Other workers' dormitories (%)
People in Group quarters - Crews of maritime vessels (%)
People in Group quarters - Other nonhousehold living situations (%)
People in Group quarters - Other noninstitutional group quarters (%)
Residents speaking English at home (%)
Residents speaking English at home - Born in the United States (%)
Residents speaking English at home - Native, born elsewhere (%)
Residents speaking English at home - Foreign born (%)
Residents speaking Spanish at home (%)
Residents speaking Spanish at home - Born in the United States (%)
Residents speaking Spanish at home - Native, born elsewhere (%)
Residents speaking Spanish at home - Foreign born (%)
Residents speaking other language at home (%)
Residents speaking other language at home - Born in the United States (%)
Residents speaking other language at home - Native, born elsewhere (%)
Residents speaking other language at home - Foreign born (%)
Class of Workers - Employee of private company (%)
Class of Workers - Self-employed in own incorporated business (%)
Class of Workers - Private not-for-profit wage and salary workers (%)
Class of Workers - Local government workers (%)
Class of Workers - State government workers (%)
Class of Workers - Federal government workers (%)
Class of Workers - Self-employed workers in own not incorporated business and Unpaid family workers (%)
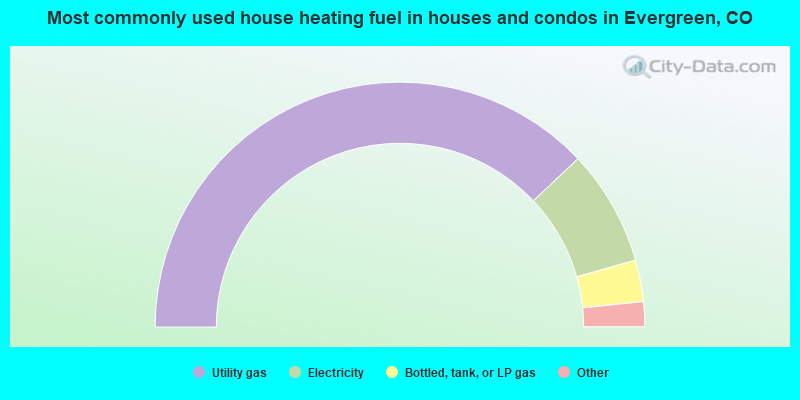
House heating fuel used in houses and condos - Utility gas (%)
House heating fuel used in houses and condos - Bottled, tank, or LP gas (%)
House heating fuel used in houses and condos - Electricity (%)
House heating fuel used in houses and condos - Fuel oil, kerosene, etc. (%)
House heating fuel used in houses and condos - Coal or coke (%)
House heating fuel used in houses and condos - Wood (%)
House heating fuel used in houses and condos - Solar energy (%)
House heating fuel used in houses and condos - Other fuel (%)
House heating fuel used in houses and condos - No fuel used (%)
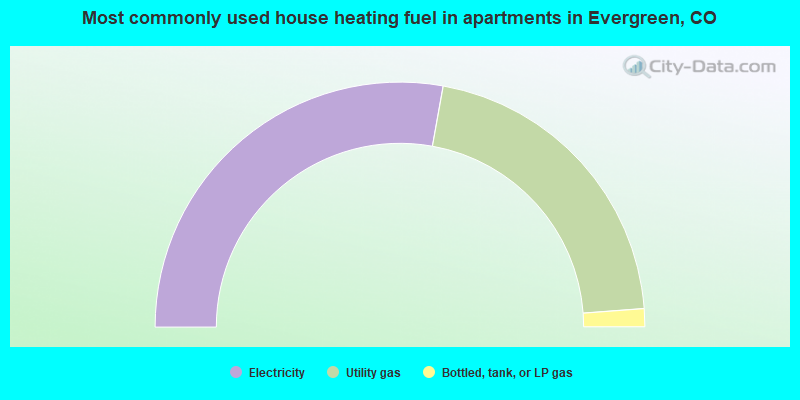
House heating fuel used in apartments - Utility gas (%)
House heating fuel used in apartments - Bottled, tank, or LP gas (%)
House heating fuel used in apartments - Electricity (%)
House heating fuel used in apartments - Fuel oil, kerosene, etc. (%)
House heating fuel used in apartments - Coal or coke (%)
House heating fuel used in apartments - Wood (%)
House heating fuel used in apartments - Solar energy (%)
House heating fuel used in apartments - Other fuel (%)
House heating fuel used in apartments - No fuel used (%)
Armed forces status - In Armed Forces (%)
Armed forces status - Civilian (%)
Armed forces status - Civilian - Veteran (%)
Armed forces status - Civilian - Nonveteran (%)
Fatal accidents locations in years 2005-2021
Fatal accidents locations in 2005
Fatal accidents locations in 2006
Fatal accidents locations in 2007
Fatal accidents locations in 2008
Fatal accidents locations in 2009
Fatal accidents locations in 2010
Fatal accidents locations in 2011
Fatal accidents locations in 2012
Fatal accidents locations in 2013
Fatal accidents locations in 2014
Fatal accidents locations in 2015
Fatal accidents locations in 2016
Fatal accidents locations in 2017
Fatal accidents locations in 2018
Fatal accidents locations in 2019
Fatal accidents locations in 2020
Fatal accidents locations in 2021
Alcohol use - People drinking some alcohol every month (%)
Alcohol use - People not drinking at all (%)
Alcohol use - Average days/month drinking alcohol
Alcohol use - Average drinks/week
Alcohol use - Average days/year people drink much
Audiometry - Average condition of hearing (%)
Audiometry - People that can hear a whisper from across a quiet room (%)
Audiometry - People that can hear normal voice from across a quiet room (%)
Audiometry - Ears ringing, roaring, buzzing (%)
Audiometry - Had a job exposure to loud noise (%)
Audiometry - Had off-work exposure to loud noise (%)
Blood Pressure & Cholesterol - Has high blood pressure (%)
Blood Pressure & Cholesterol - Checking blood pressure at home (%)
Blood Pressure & Cholesterol - Frequently checking blood cholesterol (%)
Blood Pressure & Cholesterol - Has high cholesterol level (%)
Consumer Behavior - Money monthly spent on food at supermarket/grocery store
Consumer Behavior - Money monthly spent on food at other stores
Consumer Behavior - Money monthly spent on eating out
Consumer Behavior - Money monthly spent on carryout/delivered foods
Consumer Behavior - Income spent on food at supermarket/grocery store (%)
Consumer Behavior - Income spent on food at other stores (%)
Consumer Behavior - Income spent on eating out (%)
Consumer Behavior - Income spent on carryout/delivered foods (%)
Current Health Status - General health condition (%)
Current Health Status - Blood donors (%)
Current Health Status - Has blood ever tested for HIV virus (%)
Current Health Status - Left-handed people (%)
Dermatology - People using sunscreen (%)
Diabetes - Diabetics (%)
Diabetes - Had a blood test for high blood sugar (%)
Diabetes - People taking insulin (%)
Diet Behavior & Nutrition - Diet health (%)
Diet Behavior & Nutrition - Milk product consumption (# of products/month)
Diet Behavior & Nutrition - Meals not home prepared (#/week)
Diet Behavior & Nutrition - Meals from fast food or pizza place (#/week)
Diet Behavior & Nutrition - Ready-to-eat foods (#/month)
Diet Behavior & Nutrition - Frozen meals/pizza (#/month)
Drug Use - People that ever used marijuana or hashish (%)
Drug Use - Ever used hard drugs (%)
Drug Use - Ever used any form of cocaine (%)
Drug Use - Ever used heroin (%)
Drug Use - Ever used methamphetamine (%)
Health Insurance - People covered by health insurance (%)
Kidney Conditions-Urology - Avg. # of times urinating at night
Medical Conditions - People with asthma (%)
Medical Conditions - People with anemia (%)
Medical Conditions - People with psoriasis (%)
Medical Conditions - People with overweight (%)
Medical Conditions - Elderly people having difficulties in thinking or remembering (%)
Medical Conditions - People who ever received blood transfusion (%)
Medical Conditions - People having trouble seeing even with glass/contacts (%)
Medical Conditions - People with arthritis (%)
Medical Conditions - People with gout (%)
Medical Conditions - People with congestive heart failure (%)
Medical Conditions - People with coronary heart disease (%)
Medical Conditions - People with angina pectoris (%)
Medical Conditions - People who ever had heart attack (%)
Medical Conditions - People who ever had stroke (%)
Medical Conditions - People with emphysema (%)
Medical Conditions - People with thyroid problem (%)
Medical Conditions - People with chronic bronchitis (%)
Medical Conditions - People with any liver condition (%)
Medical Conditions - People who ever had cancer or malignancy (%)
Mental Health - People who have little interest in doing things (%)
Mental Health - People feeling down, depressed, or hopeless (%)
Mental Health - People who have trouble sleeping or sleeping too much (%)
Mental Health - People feeling tired or having little energy (%)
Mental Health - People with poor appetite or overeating (%)
Mental Health - People feeling bad about themself (%)
Mental Health - People who have trouble concentrating on things (%)
Mental Health - People moving or speaking slowly or too fast (%)
Mental Health - People having thoughts they would be better off dead (%)
Oral Health - Average years since last visit a dentist
Oral Health - People embarrassed because of mouth (%)
Oral Health - People with gum disease (%)
Oral Health - General health of teeth and gums (%)
Oral Health - Average days a week using dental floss/device
Oral Health - Average days a week using mouthwash for dental problem
Oral Health - Average number of teeth
Pesticide Use - Households using pesticides to control insects (%)
Pesticide Use - Households using pesticides to kill weeds (%)
Physical Activity - People doing vigorous-intensity work activities (%)
Physical Activity - People doing moderate-intensity work activities (%)
Physical Activity - People walking or bicycling (%)
Physical Activity - People doing vigorous-intensity recreational activities (%)
Physical Activity - People doing moderate-intensity recreational activities (%)
Physical Activity - Average hours a day doing sedentary activities
Physical Activity - Average hours a day watching TV or videos
Physical Activity - Average hours a day using computer
Physical Functioning - People having limitations keeping them from working (%)
Physical Functioning - People limited in amount of work they can do (%)
Physical Functioning - People that need special equipment to walk (%)
Physical Functioning - People experiencing confusion/memory problems (%)
Physical Functioning - People requiring special healthcare equipment (%)
Prescription Medications - Average number of prescription medicines taking
Preventive Aspirin Use - Adults 40+ taking low-dose aspirin (%)
Reproductive Health - Vaginal deliveries (%)
Reproductive Health - Cesarean deliveries (%)
Reproductive Health - Deliveries resulted in a live birth (%)
Reproductive Health - Pregnancies resulted in a delivery (%)
Reproductive Health - Women breastfeeding newborns (%)
Reproductive Health - Women that had a hysterectomy (%)
Reproductive Health - Women that had both ovaries removed (%)
Reproductive Health - Women that have ever taken birth control pills (%)
Reproductive Health - Women taking birth control pills (%)
Reproductive Health - Women that have ever used Depo-Provera or injectables (%)
Reproductive Health - Women that have ever used female hormones (%)
Sexual Behavior - People 18+ that ever had sex (vaginal, anal, or oral) (%)
Sexual Behavior - Males 18+ that ever had vaginal sex with a woman (%)
Sexual Behavior - Males 18+ that ever performed oral sex on a woman (%)
Sexual Behavior - Males 18+ that ever had anal sex with a woman (%)
Sexual Behavior - Males 18+ that ever had any sex with a man (%)
Sexual Behavior - Females 18+ that ever had vaginal sex with a man (%)
Sexual Behavior - Females 18+ that ever performed oral sex on a man (%)
Sexual Behavior - Females 18+ that ever had anal sex with a man (%)
Sexual Behavior - Females 18+ that ever had any kind of sex with a woman (%)
Sexual Behavior - Average age people first had sex
Sexual Behavior - Average number of female sex partners in lifetime (males 18+)
Sexual Behavior - Average number of female vaginal sex partners in lifetime (males 18+)
Sexual Behavior - Average age people first performed oral sex on a woman (18+)
Sexual Behavior - Average number of woman performed oral sex on in lifetime (18+)
Sexual Behavior - Average number of male sex partners in lifetime (males 18+)
Sexual Behavior - Average number of male anal sex partners in lifetime (males 18+)
Sexual Behavior - Average age people first performed oral sex on a man (18+)
Sexual Behavior - Average number of male oral sex partners in lifetime (18+)
Sexual Behavior - People using protection when performing oral sex (%)
Sexual Behavior - Average number of times people have vaginal or anal sex a year
Sexual Behavior - People having sex without condom (%)
Sexual Behavior - Average number of male sex partners in lifetime (females 18+)
Sexual Behavior - Average number of male vaginal sex partners in lifetime (females 18+)
Sexual Behavior - Average number of female sex partners in lifetime (females 18+)
Sexual Behavior - Circumcised males 18+ (%)
Sleep Disorders - Average hours sleeping at night
Sleep Disorders - People that has trouble sleeping (%)
Smoking-Cigarette Use - People smoking cigarettes (%)
Taste & Smell - People 40+ having problems with smell (%)
Taste & Smell - People 40+ having problems with taste (%)
Taste & Smell - People 40+ that ever had wisdom teeth removed (%)
Taste & Smell - People 40+ that ever had tonsils teeth removed (%)
Taste & Smell - People 40+ that ever had a loss of consciousness because of a head injury (%)
Taste & Smell - People 40+ that ever had a broken nose or other serious injury to face or skull (%)
Taste & Smell - People 40+ that ever had two or more sinus infections (%)
Weight - Average height (inches)
Weight - Average weight (pounds)
Weight - Average BMI
Weight - People that are obese (%)
Weight - People that ever were obese (%)
Weight - People trying to lose weight (%)
7,808 87.7% White alone 567 6.4% Hispanic 290 3.3% Two or more races 82 0.9% Black alone 79 0.9% Asian alone 3 0.03% American Indian alone
According to our research of Colorado and other state lists, there were 18 registered sex offenders living in Evergreen, Colorado as of April 27, 2024 . The ratio of all residents to sex offenders in Evergreen is 488 to 1.The ratio of registered sex offenders to all residents in this city is near the state average.
Latest news from Evergreen, CO collected exclusively by city-data.com from local newspapers, TV, and radio stations
Ancestries: English (16.0%), German (13.0%), Irish (7.3%), Italian (5.5%), Swedish (5.0%), European (4.8%).
Current Local Time:
Land area: 11.6 square miles.
Population density: 780 people per square mile (low).
357 residents are foreign born (1.4% Europe , 0.7% North America , 0.6% Asia , 0.6% Africa ).
This place:
4.0%Colorado:
9.5%
Median real estate property taxes paid for housing units with mortgages in 2022: $3,415 (0.4%)Median real estate property taxes paid for housing units with no mortgage in 2022: $3,437 (0.4%)
Nearest city with pop. 50,000+: Lakewood, CO
Nearest city with pop. 200,000+: Northeast Jefferson, CO (14.3 miles
Nearest city with pop. 1,000,000+: Phoenix, AZ
Nearest cities:
Latitude: 39.64 N, Longitude: 105.34 W
Daytime population change due to commuting: +202 (+2.3%)Workers who live and work in this place: 2,346 (48.2%)
Evergreen tourist attractions:
Unemployment in December 2023:
Most common industries in Evergreen, CO (%)
Both Males Females
Professional, scientific, technical services (16.0%)
Health care (8.6%)
Educational services (7.7%)
Construction (7.1%)
Finance & insurance (6.3%)
Public administration (4.7%)
Arts, entertainment, recreation (4.1%)
Professional, scientific, technical services (16.6%)
Construction (10.8%)
Public administration (6.3%)
Educational services (5.6%)
Health care (4.4%)
Finance & insurance (4.4%)
Accommodation & food services (4.1%)
Professional, scientific, technical services (15.2%)
Health care (13.8%)
Educational services (10.4%)
Finance & insurance (8.9%)
Arts, entertainment, recreation (4.4%)
Administrative & support & waste management services (4.2%)
Accommodation & food services (3.9%)
Most common occupations in Evergreen, CO (%)
Both Males Females
Other management occupations, except farmers and farm managers (8.2%)
Sales representatives, services, wholesale and manufacturing (6.4%)
Computer specialists (5.4%)
Top executives (4.1%)
Advertising, marketing, promotions, public relations, and sales managers (3.5%)
Retail sales workers, except cashiers (3.2%)
Other sales and related occupations, including supervisors (3.2%)
Other management occupations, except farmers and farm managers (9.5%)
Computer specialists (7.6%)
Sales representatives, services, wholesale and manufacturing (6.4%)
Top executives (6.0%)
Electrical equipment mechanics and other installation, maintenance, and repair workers, including supervisors (3.9%)
Advertising, marketing, promotions, public relations, and sales managers (3.8%)
Building and grounds cleaning and maintenance occupations (3.6%)
Other management occupations, except farmers and farm managers (6.7%)
Sales representatives, services, wholesale and manufacturing (6.5%)
Preschool, kindergarten, elementary, and middle school teachers (5.6%)
Art and design workers (4.4%)
Secretaries and administrative assistants (4.1%)
Accountants and auditors (3.9%)
Registered nurses (3.8%)
Tornado activity:
Evergreen-area historical tornado activity is slightly above Colorado state average. It is 5% smaller than the overall U.S. average.
On 6/15/1988, a category F3 (max. wind speeds 158-206 mph) tornado 22.5 miles away from the Evergreen place center injured 7 people and caused between $5,000,000 and $50,000,000 in damages.
On 5/18/1975, a category F3 tornado 34.1 miles away from the place center .
Earthquake activity:
Evergreen-area historical earthquake activity is significantly above Colorado state average. It is 757% greater than the overall U.S. average. On 8/18/1959 at 06:37:13, a magnitude 7.7 (7.7 UK, Class: Major, Intensity: VIII - XII) earthquake occurred 436.4 miles away from Evergreen center, causing $26,000,000 total damage On 10/18/1984 at 15:30:23, a magnitude 5.5 (5.4 MB, 5.1 MS, 5.5 ML, Class: Moderate, Intensity: VI - VII) earthquake occurred 191.0 miles away from the city center On 10/28/1983 at 14:06:06, a magnitude 7.3 (6.2 MB, 7.3 MS, 7.0 MW) earthquake occurred 532.9 miles away from Evergreen center, causing 2 deaths ( 2 shaking deaths) and 3 injuries, causing $15,000,000 total damage On 8/23/2011 at 05:46:18, a magnitude 5.3 (5.3 MW, Depth: 2.5 mi) earthquake occurred 181.5 miles away from the city center On 3/28/1975 at 02:31:05, a magnitude 6.2 (6.1 MB, 6.0 MS, 6.2 ML, Class: Strong, Intensity: VII - IX) earthquake occurred 407.9 miles away from Evergreen center On 8/10/2005 at 22:08:22, a magnitude 5.0 (5.0 MW, Depth: 3.1 mi) earthquake occurred 188.2 miles away from the city center Magnitude types: body-wave magnitude (MB), local magnitude (ML), surface-wave magnitude (MS), moment magnitude (MW) Natural disasters: The number of natural disasters in Jefferson County (12) is smaller than the US average (15).Major Disasters (Presidential) Declared: 4Emergencies Declared: 4Fires: 4, Floods: 4, Storms: 3, Landslides: 2, Mudslides: 2, Snows: 2, Heavy Rain: 1, Hurricane: 1, Snowstorm: 1, Other: 1 (Note: some incidents may be assigned to more than one category). Hospitals and medical centers in Evergreen: MT EVANS HOME HEALTH CARE INC (3081 BERGEN PEAK DRIVE)
LIFE CARE CENTER OF EVERGREEN (2987 BERGEN PEAK DRIVE)
Other hospitals and medical centers near Evergreen: BEAR CREEK CARE AND REHABILITATION CENTER (Nursing Home, about 8 miles away; MORRISON, CO)
ATLAS HOME HEALTH (Home Health Center, about 11 miles away; GOLDEN, CO)
CAREMERIDIAN LLC (Nursing Home, about 11 miles away; LITTLETON, CO)
EMERITUS AT GREEN MOUNTAIN LONG TERM CARE COMMUNIT (Nursing Home, about 12 miles away; LAKEWOOD, CO)
KIDNEY CENTER OF BEAR CREEK (ARA) (Dialysis Facility, about 12 miles away; LAKEWOOD, CO)
CENTURA HEALTH-ST ANTHONY HOSPITAL (about 13 miles away; LAKEWOOD, CO)
ORTHOCOLORADO HOSPITAL AT ST ANTHONY MED CAMPUS (about 13 miles away; LAKEWOOD, CO)
Amtrak station near Evergreen: 20 miles: DENVER (1701 WYNKOOP ST.) Services: ticket office, fully wheelchair accessible, enclosed waiting area, public restrooms, public payphones, full-service food facilities and snack bar, paid short-term parking, paid long-term parking, call for car rental service, taxi stand, public transit connection.
Colleges/universities with over 2000 students nearest to Evergreen:
Colorado School of Mines (about 10 miles; Golden, CO ; Full-time enrollment: 5,507)
Red Rocks Community College (about 12 miles; Lakewood, CO ; FT enrollment: 6,185)
Colorado Christian University (about 14 miles; Lakewood, CO ; FT enrollment: 2,959)
Arapahoe Community College (about 18 miles; Littleton, CO ; FT enrollment: 6,619)
Community College of Denver (about 20 miles; Denver, CO ; FT enrollment: 7,329)
Metropolitan State University of Denver (about 20 miles; Denver, CO ; FT enrollment: 17,242)
Regis University (about 20 miles; Denver, CO ; FT enrollment: 6,975)
Public high schools in Evergreen:
Public elementary/middle schools in Evergreen: EVERGREEN MIDDLE SCHOOL Students: 664, Location: 2059 HIWAN DRIVE, Grades: 6-8)WILMOT ELEMENTARY SCHOOL Students: 482, Location: 5124 SOUTH HATCH DRIVE, Grades: PK-5)BERGEN MEADOW PRIMARY SCHOOL Students: 376, Location: 1892 BERGEN PARKWAY, Grades: PK-2)MARSHDALE ELEMENTARY SCHOOL Students: 370, Location: 26663 NORTH TURKEY CREEK ROAD, Grades: KG-5)ROCKY MOUNTAIN ACADEMY OF EVERGREEN Students: 356, Location: 2959 ROYALE ELK WAY, Grades: PK-8, Charter school )BERGEN VALLEY INTERMEDIATE SCHOOL Students: 319, Location: 1422 SUGARBUSH DRIVE, Grades: 3-5)KING-MURPHY ELEMENTARY SCHOOL Students: 213, Location: 425 CIRCLE K ROAD, Grades: PK-6)CLEAR CREEK MIDDLE SCHOOL Students: 136, Location: 185 BEAVER BROOK CANYON ROAD, Grades: 7-8)Private elementary/middle schools in Evergreen: MONTESSORI SCHOOL OF EVERGREEN Students: 273, Location: 6979 HIGHWAY 73, Grades: PK-8)
EVERGREEN COUNTRY DAY SCHOOL Students: 196, Location: 1093 SWEDE GULCH RD, Grades: PK-8)
See full list of schools located in Evergreen User-submitted facts and corrections:
Additional school should also include Evergreen School of Music - a private music school teaching lessons in all the major instruments from piano, guitar, sax, drums, voice etc. Info available on their website at http://www.vergreenschoolofmusic.com
Notable locations in Evergreen: (A) , Evergreen Golf Course (B) , Jefferson County Sheriff's Office Mountain Precinct (C) , Hiwan Homestead Museum (D) , Evergreen Fire / Rescue Station 2 (E) , Evergreen Fire / Rescue Station 1 (F) . Display/hide their locations on the map
Churches in Evergreen include: (A) , Church of the Hills (B) , Church of the Transfiguration (C) , First Baptist Church (D) , First Church of Christ Scientist (E) , Lutheran Church of the Cross (F) . Display/hide their locations on the map
Cemetery: (1) . Display/hide its location on the map
Reservoirs: (A) , Hiwan Number 6 Reservoir (B) , Evergreen Lake (C) . Display/hide their locations on the map
Creeks: (A) , Buffalo Creek (B) , Cub Creek (C) , Bergen Creek (D) . Display/hide their locations on the map
Park in Evergreen: (1) . Display/hide its location on the map
Tourist attractions:
Hotels:
Birthplace of: Staci Greason - Actor.
Jefferson County has a predicted average indoor radon screening level greater than 4 pCi/L (pico curies per liter) - Highest Potential Drinking water stations with addresses in Evergreen and their reported violations in the past:
EVERGREEN MD (Population served: 13,500, Surface water):
Past monitoring violations:
One minor monitoring violation
Population served: 994, Groundwater):
Past monitoring violations:
One routine major monitoring violation
Population served: 780, Surface water):
Past monitoring violations:
Follow-up Or Routine LCR Tap M/R - In JUL-01-2009, Contaminant: Lead and Copper Rule. Follow-up actions: St Public Notif requested (JUL-24-2009), St Violation/Reminder Notice (JUL-24-2009), St Compliance achieved (JUL-29-2009)
Monitoring, Turbidity (Enhanced SWTR) - In JUN-2009, Contaminant: IESWTR. Follow-up actions: St Public Notif requested (JUL-30-2009), St Violation/Reminder Notice (JUL-30-2009), St Compliance achieved (DEC-31-2009)
Follow-up Or Routine LCR Tap M/R - In OCT-01-2004, Contaminant: Lead and Copper Rule. Follow-up actions: St Public Notif requested (APR-19-2005), St Violation/Reminder Notice (APR-19-2005), St Public Notif received (JUN-03-2005), St Compliance achieved (AUG-26-2008)
3 routine major monitoring violations
2 regular monitoring violations
Population served: 400, Groundwater):
Past monitoring violations:
Monitoring and Reporting (DBP) - Between JUL-2006 and SEP-2006, Contaminant: Chlorine. Follow-up actions: St Violation/Reminder Notice (DEC-18-2006), St Compliance achieved (JAN-30-2007)
Monitoring and Reporting (DBP) - Between JAN-2005 and DEC-2005, Contaminant: Total Haloacetic Acids (HAA5). Follow-up actions: St Public Notif requested (MAR-28-2006), St Violation/Reminder Notice (MAR-28-2006), St Compliance achieved (OCT-30-2006)
Monitoring and Reporting (DBP) - Between JAN-2005 and DEC-2005, Contaminant: TTHM. Follow-up actions: St Public Notif requested (MAR-28-2006), St Violation/Reminder Notice (MAR-28-2006), St Compliance achieved (OCT-30-2006)
2 routine major monitoring violations
31 regular monitoring violations
Population served: 26, Surface water):
Past monitoring violations:
Monitoring and Reporting (DBP) - Between JUL-2009 and SEP-2009, Contaminant: Chlorine. Follow-up actions: St Public Notif requested (SEP-11-2009), St Violation/Reminder Notice (SEP-11-2009), St Compliance achieved (FEB-01-2010)
5 routine major monitoring violations
3 minor monitoring violations
Average household size: This place:
2.5 peopleColorado:
2.5 people
Percentage of family households: This place:
73.1%Whole state:
63.9%
Percentage of households with unmarried partners: This place:
4.0%Whole state:
6.5%
Likely homosexual households (counted as self-reported same-sex unmarried-partner households)
Lesbian couples: 0.3% of all households Gay men: 0.2% of all households
25 people in mental (psychiatric) hospitals or wards in 2000people in other noninstitutional group quarters in 2000
Banks with branches in Evergreen (2011 data):
Evergreen National Bank: at 28145 Colorado Highway 74, branch established on 1981/04/15; Bergen Park Branch at 1198 Bergen Parkway, branch established on 1999/12/13. Info updated 2010/09/28: Bank assets: $99.8 mil, Deposits: $89.9 mil, local headquarters , positive income , 4 total offices , Holding Company: Evergreen Bancorporation
FirstBank: Evergreen Branch at 30770 Stagecoach Boulevard, branch established on 1997/03/17; El Rancho Branch at 29240 Us Hwy 40 & El Rancho Exit, branch established on 2008/12/23. Info updated 2011/12/05: Bank assets: $11,597.1 mil, Deposits: $10,530.4 mil, headquarters in Lakewood, CO, positive income , Mortgage Lending Specialization, 130 total offices , Holding Company: Firstbank Holding Company
Bank of the West: Evergreen Branch at 3779 Evergreen Pkwy, branch established on 1974/12/02; Evergreen North at 953 Swede Gulch Road, branch established on 1987/06/30. Info updated 2009/11/16: Bank assets: $62,408.3 mil, Deposits: $43,995.2 mil, headquarters in San Francisco, CA, positive income , 647 total offices , Holding Company: Bnp Paribas
JPMorgan Chase Bank, National Association: Bergen Park Banking Center at 1254 Bergen Parkway, branch established on 2005/12/15. Info updated 2011/11/10: Bank assets: $1,811,678.0 mil, Deposits: $1,190,738.0 mil, headquarters in Columbus, OH, positive income , International Specialization, 5577 total offices , Holding Company: Jpmorgan Chase & Co.
U.S. Bank National Association: Evergreen Branch at 2922 Evergreen Parkway, branch established on 1960/03/01. Info updated 2012/01/30: Bank assets: $330,470.8 mil, Deposits: $236,091.5 mil, headquarters in Cincinnati, OH, positive income , 3121 total offices , Holding Company: U.S. Bancorp
Mutual of Omaha Bank: Bergen Park Branch at 1248 Bergen Pkwy, branch established on 1984/11/26. Info updated 2011/07/21: Bank assets: $5,553.2 mil, Deposits: $4,599.7 mil, headquarters in Omaha, NE, positive income , Commercial Lending Specialization, 45 total offices
For population 15 years and over in Evergreen:
Never married: 18.3%Now married: 62.8%Separated: 0.6%Widowed: 4.5%Divorced: 13.9% For population 25 years and over in Evergreen:
High school or higher: 98.0%Bachelor's degree or higher: 69.4%Graduate or professional degree: 27.9%Unemployed: 3.8%Mean travel time to work (commute): 18.7 minutes
Education Gini index (Inequality in education) Here:
7.6Colorado average:
11.1
Religion statistics for Evergreen, CO (based on Jefferson County data)
Religion Adherents Congregations Catholic 80,219 17 Evangelical Protestant 68,794 196 Mainline Protestant 22,716 57 Other 17,966 62 Orthodox 1,070 3 None 343,778 -
Source: Clifford Grammich, Kirk Hadaway, Richard Houseal, Dale E.Jones, Alexei Krindatch, Richie Stanley and Richard H.Taylor. 2012. 2010 U.S.Religion Census: Religious Congregations & Membership Study. Association of Statisticians of American Religious Bodies. Jones, Dale E., et al. 2002. Congregations and Membership in the United States 2000. Nashville, TN: Glenmary Research Center. Graphs represent county-level data
Food Environment Statistics: Number of grocery stores : 58Jefferson County :
1.10 / 10,000 pop.Colorado :
1.50 / 10,000 pop.
Number of supercenters and club stores : 5Jefferson County :
0.09 / 10,000 pop.State :
0.15 / 10,000 pop.
Number of convenience stores (no gas) : 18This county :
0.34 / 10,000 pop.Colorado :
0.45 / 10,000 pop.
Number of convenience stores (with gas) : 145Here :
2.75 / 10,000 pop.Colorado :
3.13 / 10,000 pop.
Number of full-service restaurants : 410Here :
7.76 / 10,000 pop.Colorado :
8.99 / 10,000 pop.
Adult diabetes rate : Jefferson County :
5.3%Colorado :
5.3%
Adult obesity rate : Jefferson County :
17.4%Colorado :
18.4%
Low-income preschool obesity rate : This county :
9.6%Colorado :
9.6%
Health and Nutrition: Healthy diet rate : Evergreen:
54.7%Colorado:
49.4%
Average overall health of teeth and gums : Evergreen:
54.6%Colorado:
47.8%
Average BMI : Evergreen:
28.4Colorado:
28.5
People feeling badly about themselves : Evergreen:
20.6%Colorado:
20.7%
People not drinking alcohol at all : Average hours sleeping at night : Overweight people : Evergreen:
36.4%State:
33.3%
General health condition : Average condition of hearing : Evergreen:
80.5%Colorado:
80.2%
More about Health and Nutrition of Evergreen, CO Residents
11.22% of this county's 2021 resident taxpayers lived in other counties in 2020 ($78,273 average adjusted gross income )
Here:
11.22%Colorado average:
11.28%
0.01% of residents moved from foreign countries ($77 average AGI )Jefferson County:
0.01%Colorado average:
0.05%
Top counties from which taxpayers relocated into this county between 2020 and 2021:
11.40% of this county's 2020 resident taxpayers moved to other counties in 2021 ($73,305 average adjusted gross income )
Here:
11.40%Colorado average:
11.05%
0.01% of residents moved to foreign countries ($82 average AGI )Jefferson County:
0.01%Colorado average:
0.03%
Top counties to which taxpayers relocated from this county between 2020 and 2021:
Businesses in Evergreen, CO
Name Count Name Count
AT&T 1 Qdoba Mexican Grill 1 Baskin-Robbins 1 Quality 1 Big O Tires 1 RadioShack 1 Cricket Wireless 1 Starbucks 2 Curves 1 T-Mobile 1 Decora Cabinetry 3 Taco Bell 1 Domino's Pizza 1 U-Haul 1 FedEx 8 UPS 7 Firestone Complete Auto Care 1 Vons 1 Goodwill 1 Walgreens 1 H&R Block 1 Walmart 1 Kroger 2 Wendy's 1 MasterBrand Cabinets 12
Strongest AM radio stations in Evergreen:
KKZN (760 AM; 50 kW; THORNTON, CO; Owner: JACOR BROADCASTING OF COLORADO, INC.)
KCUV (1510 AM; 25 kW; LITTLETON, CO; Owner: PEOPLE WIRELESS, INC.)
KOA (850 AM; 50 kW; DENVER, CO; Owner: JACOR BROADCASTING OF COLORADO, INC.)
KLTT (670 AM; 50 kW; COMMERCE CITY, CO; Owner: KLZ RADIO, INC.)
KMXA (1090 AM; 50 kW; AURORA, CO; Owner: ENTRAVISION HOLDINGS, LLC)
KADZ (1550 AM; 10 kW; ARVADA, CO; Owner: ABC, INC.)
KRKS (990 AM; 10 kW; DENVER, CO; Owner: SALEM MEDIA OF COLORADO, INC.)
KDDZ (1690 AM; 10 kW; ARVADA, CO; Owner: ABC, INC.)
KLMO (1060 AM; 30 kW; LONGMONT, CO; Owner: PILGRIM COMMUNICATIONS, INC.)
KCKK (1600 AM; 5 kW; LAKEWOOD, CO; Owner: JEFFERSON-PILOT COMMUNICATIONS COMPANY OF COLORADO)
KEZW (1430 AM; 10 kW; AURORA, CO; Owner: ENTERCOM DENVER LICENSE, LLC)
KLZ (560 AM; 5 kW; DENVER, CO; Owner: KLZ RADIO, INC.)
KBJD (1650 AM; 10 kW; DENVER, CO; Owner: SALEM MEDIA OF COLORADO, INC.)
Strongest FM radio stations in Evergreen:
KYGO-FM (98.5 FM; DENVER, CO; Owner: JEFFERSON-PILOT COMMUNICATIONS COMPANY OF COLORADO)
KXPK (96.5 FM; EVERGREEN, CO; Owner: ENTRAVISION HOLDINGS, LLC)
KBPI (106.7 FM; DENVER, CO; Owner: JACOR BROADCASTING OF COLORADO, INC.)
KALC (105.9 FM; DENVER, CO; Owner: ENTERCOM DENVER LICENSE, LLC)
KOSI (101.1 FM; DENVER, CO; Owner: ENTERCOM DENVER LICENSE, LLC)
KXKL-FM (105.1 FM; DENVER, CO; Owner: INFINITY RADIO OPERATIONS INC.)
KFMD (95.7 FM; DENVER, CO; Owner: CITICASTERS LICENSES, L.P.)
KRFX (103.5 FM; DENVER, CO; Owner: JACOR BROADCASTING OF COLORADO, INC.)
KIMN (100.3 FM; DENVER, CO; Owner: INFINITY RADIO OPERATIONS INC.)
KVOD (90.1 FM; DENVER, CO; Owner: PUBLIC BROADCASTING OF COLORADO, INC)
KLDV (91.1 FM; MORRISON, CO; Owner: EDUCATIONAL MEDIA FOUNDATION)
KUVO (89.3 FM; DENVER, CO; Owner: DENVER EDUCATIONAL BROADCASTING)
KQKS (107.5 FM; LAKEWOOD, CO; Owner: JEFFERSON-PILOT COMMUNICATIONS COMPANY OF COLORADO)
K209DE (89.7 FM; GOLDEN, CO; Owner: WAY-FM MEDIA GROUP, INC.)
KQMT (99.5 FM; DENVER, CO; Owner: ENTERCOM DENVER LICENSE, LLC)
KBCO-FM (97.3 FM; BOULDER, CO; Owner: CITICASTERS LICENSES, L.P.)
KRKS-FM (94.7 FM; LAFAYETTE, CO; Owner: SALEM MEDIA OF COLORADO, INC)
K300AE (107.9 FM; BRECKENRIDGE, CO; Owner: EDUCATIONAL MEDIA FOUNDATION)
K207CK (89.3 FM; BRECKENRIDGE, CO; Owner: SUMMIT PUBLIC RADIOSUMMIT FOUNDATION)
K202CV (88.3 FM; BRECKENRIDGE, CO; Owner: COMMUNITY RADIO FOR NORTHERN COLORADO)
TV broadcast stations around Evergreen:
KUSA-TV (Channel 9; DENVER, CO; Owner: MULTIMEDIA HOLDINGS CORPORATION)
KTVD (Channel 20; DENVER, CO; Owner: TWENVER BROADCAST, INC.)
KCNC-TV (Channel 4; DENVER, CO; Owner: CBS TELEVISION STATIONS INC.)
KMAS-LP (Channel 63; DENVER, CO; Owner: TELEMUNDO OF STEAMBOAT SPRINGS COLO. LIC. CORP.)
KWGN-TV (Channel 2; DENVER, CO; Owner: KWGN INC.)
KPXC-TV (Channel 59; DENVER, CO; Owner: PAXSON DENVER LICENSE, INC.)
KDVR (Channel 31; DENVER, CO; Owner: FOX TELEVISION STATIONS, INC.)
KMGH-TV (Channel 7; DENVER, CO; Owner: MCGRAW-HILL BROADCASTING COMPANY, INC.)
KRMA-TV (Channel 6; DENVER, CO; Owner: ROCKY MOUNTAIN PUBLIC BROADCASTING NETWORK, INC.)
KRMT (Channel 41; DENVER, CO; Owner: WORD OF GOD FELLOWSHIP, INC.)
K48FW (Channel 48; DENVER, CO; Owner: TRINITY BROADCASTING NETWORK)
KDVT-LP (Channel 36; DENVER, CO; Owner: ENTRAVISION HOLDINGS, LLC)
KCEC (Channel 50; DENVER, CO; Owner: ENTRAVISION HOLDINGS, LLC)
KDEO-LP (Channel 38; AURORA, CO; Owner: PETER B. VAN DE SANDE)
KDEN (Channel 25; LONGMONT, CO; Owner: LONGMONT CHANNEL 25, INC.)
KBDI-TV (Channel 12; BROOMFIELD, CO; Owner: FRONT RANGE EDUCATIONAL MEDIA CORP.)
K57BT (Channel 57; DENVER, CO; Owner: TRINITY BROADCASTING OF DENVER, INC.)
National Bridge Inventory (NBI) Statistics 21 Number of bridges197ft / 59.7m Total length $150,000 Total costs179,756 Total average daily traffic10,661 Total average daily truck traffic
New bridges - historical statistics
1 1930-1939 2 1950-1959 8 1970-1979 6 1990-1999 4 2000-2009
See full National Bridge Inventory statistics for Evergreen, CO
Home Mortgage Disclosure Act Aggregated Statistics For Year 2009(Based on 1 full and 4 partial tracts) A) FHA, FSA/RHS & VA B) Conventional C) Refinancings D) Home Improvement Loans F) Non-occupant Loans on Number Average Value Number Average Value Number Average Value Number Average Value Number Average Value
LOANS ORIGINATED 22 $240,289 69 $281,250 336 $291,331 9 $213,232 29 $264,853 APPLICATIONS APPROVED, NOT ACCEPTED 1 $333,030 9 $297,628 25 $299,987 2 $308,300 3 $233,317 APPLICATIONS DENIED 2 $251,415 8 $409,394 60 $372,239 6 $96,453 9 $324,546 APPLICATIONS WITHDRAWN 5 $264,202 10 $280,921 50 $304,806 2 $243,325 6 $275,010 FILES CLOSED FOR INCOMPLETENESS 1 $323,150 1 $155,570 14 $351,421 2 $158,900 1 $154,960
Aggregated Statistics For Year 2008(Based on 1 full and 4 partial tracts) A) FHA, FSA/RHS & VA B) Conventional C) Refinancings D) Home Improvement Loans F) Non-occupant Loans on Number Average Value Number Average Value Number Average Value Number Average Value Number Average Value
LOANS ORIGINATED 13 $248,188 82 $335,879 138 $292,904 19 $123,986 20 $265,714 APPLICATIONS APPROVED, NOT ACCEPTED 0 $0 10 $444,245 22 $330,094 4 $137,620 1 $225,210 APPLICATIONS DENIED 2 $278,835 14 $388,411 54 $334,266 7 $160,113 9 $212,058 APPLICATIONS WITHDRAWN 1 $195,250 11 $333,838 36 $325,083 3 $140,067 5 $269,246 FILES CLOSED FOR INCOMPLETENESS 0 $0 2 $325,305 6 $252,862 1 $36,660 0 $0
Aggregated Statistics For Year 2007(Based on 1 full and 4 partial tracts) A) FHA, FSA/RHS & VA B) Conventional C) Refinancings D) Home Improvement Loans F) Non-occupant Loans on Number Average Value Number Average Value Number Average Value Number Average Value Number Average Value
LOANS ORIGINATED 3 $218,270 143 $309,311 162 $279,195 20 $142,233 25 $234,162 APPLICATIONS APPROVED, NOT ACCEPTED 1 $158,000 24 $261,946 24 $324,665 5 $69,024 9 $175,242 APPLICATIONS DENIED 0 $0 21 $354,703 64 $340,599 13 $102,193 11 $236,368 APPLICATIONS WITHDRAWN 0 $0 11 $350,607 29 $443,324 1 $270,780 1 $174,480 FILES CLOSED FOR INCOMPLETENESS 0 $0 5 $440,104 12 $287,275 1 $56,620 1 $247,370
Aggregated Statistics For Year 2006(Based on 1 full and 4 partial tracts) A) FHA, FSA/RHS & VA B) Conventional C) Refinancings D) Home Improvement Loans F) Non-occupant Loans on G) Loans On Manufactured Number Average Value Number Average Value Number Average Value Number Average Value Number Average Value Number Average Value
LOANS ORIGINATED 6 $229,290 206 $271,942 195 $283,391 25 $188,246 49 $257,739 0 $0 APPLICATIONS APPROVED, NOT ACCEPTED 0 $0 26 $295,908 28 $331,880 4 $122,440 10 $198,244 0 $0 APPLICATIONS DENIED 0 $0 31 $264,216 91 $351,799 9 $71,897 12 $251,504 0 $0 APPLICATIONS WITHDRAWN 1 $265,000 39 $257,816 63 $324,058 2 $158,520 19 $215,936 1 $30,000 FILES CLOSED FOR INCOMPLETENESS 0 $0 6 $211,698 14 $347,831 1 $233,570 3 $207,183 0 $0
Aggregated Statistics For Year 2005(Based on 1 full and 4 partial tracts) A) FHA, FSA/RHS & VA B) Conventional C) Refinancings D) Home Improvement Loans F) Non-occupant Loans on Number Average Value Number Average Value Number Average Value Number Average Value Number Average Value
LOANS ORIGINATED 4 $224,225 210 $268,144 289 $268,644 25 $149,130 39 $212,171 APPLICATIONS APPROVED, NOT ACCEPTED 0 $0 26 $277,527 35 $299,398 4 $50,708 4 $191,112 APPLICATIONS DENIED 1 $106,340 39 $246,580 80 $352,602 10 $86,771 10 $242,441 APPLICATIONS WITHDRAWN 1 $220,770 25 $267,107 73 $269,560 6 $183,558 6 $276,563 FILES CLOSED FOR INCOMPLETENESS 0 $0 9 $173,627 14 $308,209 0 $0 1 $291,530
Aggregated Statistics For Year 2004(Based on 1 full and 4 partial tracts) A) FHA, FSA/RHS & VA B) Conventional C) Refinancings D) Home Improvement Loans F) Non-occupant Loans on G) Loans On Manufactured Number Average Value Number Average Value Number Average Value Number Average Value Number Average Value Number Average Value
LOANS ORIGINATED 10 $184,092 195 $285,187 295 $292,582 15 $83,973 48 $201,531 0 $0 APPLICATIONS APPROVED, NOT ACCEPTED 0 $0 17 $293,574 34 $261,671 4 $78,492 5 $167,896 0 $0 APPLICATIONS DENIED 2 $169,695 23 $268,045 88 $355,269 9 $107,537 11 $253,714 1 $72,160 APPLICATIONS WITHDRAWN 0 $0 26 $355,353 77 $270,861 0 $0 9 $299,310 0 $0 FILES CLOSED FOR INCOMPLETENESS 0 $0 4 $378,335 19 $279,611 1 $75,290 4 $240,320 0 $0
Aggregated Statistics For Year 2003(Based on 1 full and 4 partial tracts) A) FHA, FSA/RHS & VA B) Conventional C) Refinancings D) Home Improvement Loans F) Non-occupant Loans on Number Average Value Number Average Value Number Average Value Number Average Value Number Average Value
LOANS ORIGINATED 8 $192,138 158 $275,413 826 $245,060 11 $50,691 82 $187,970 APPLICATIONS APPROVED, NOT ACCEPTED 0 $0 21 $227,727 75 $245,376 3 $25,223 9 $183,980 APPLICATIONS DENIED 1 $215,000 14 $369,936 93 $281,867 7 $110,271 9 $241,513 APPLICATIONS WITHDRAWN 1 $197,620 16 $286,164 88 $298,934 3 $130,007 5 $181,152 FILES CLOSED FOR INCOMPLETENESS 0 $0 4 $324,482 19 $246,459 0 $0 0 $0
Aggregated Statistics For Year 2002(Based on 1 partial tract) A) FHA, FSA/RHS & VA B) Conventional C) Refinancings D) Home Improvement Loans F) Non-occupant Loans on Number Average Value Number Average Value Number Average Value Number Average Value Number Average Value
LOANS ORIGINATED 2 $123,395 17 $239,646 70 $213,361 2 $58,190 6 $160,003 APPLICATIONS APPROVED, NOT ACCEPTED 0 $0 1 $304,060 9 $188,191 0 $0 1 $104,650 APPLICATIONS DENIED 0 $0 2 $167,095 9 $304,316 2 $48,760 1 $442,980 APPLICATIONS WITHDRAWN 0 $0 2 $280,945 8 $242,276 0 $0 1 $251,620 FILES CLOSED FOR INCOMPLETENESS 0 $0 0 $0 3 $170,353 0 $0 0 $0
Aggregated Statistics For Year 2001(Based on 1 partial tract) A) FHA, FSA/RHS & VA B) Conventional C) Refinancings D) Home Improvement Loans F) Non-occupant Loans on Number Average Value Number Average Value Number Average Value Number Average Value Number Average Value
LOANS ORIGINATED 1 $298,080 21 $265,661 57 $216,265 5 $61,042 6 $151,417 APPLICATIONS APPROVED, NOT ACCEPTED 0 $0 2 $151,915 8 $189,491 1 $83,260 0 $0 APPLICATIONS DENIED 0 $0 1 $258,520 7 $208,511 1 $45,540 0 $0 APPLICATIONS WITHDRAWN 0 $0 2 $191,820 8 $271,371 1 $57,270 0 $0 FILES CLOSED FOR INCOMPLETENESS 0 $0 0 $0 0 $0 0 $0 0 $0
Aggregated Statistics For Year 2000(Based on 1 partial tract) A) FHA, FSA/RHS & VA B) Conventional C) Refinancings D) Home Improvement Loans F) Non-occupant Loans on Number Average Value Number Average Value Number Average Value Number Average Value Number Average Value
LOANS ORIGINATED 1 $244,720 18 $197,008 12 $193,219 4 $29,728 3 $130,103 APPLICATIONS APPROVED, NOT ACCEPTED 0 $0 2 $247,135 2 $103,270 2 $28,750 0 $0 APPLICATIONS DENIED 0 $0 3 $150,190 4 $204,010 2 $33,350 0 $0 APPLICATIONS WITHDRAWN 0 $0 2 $226,435 3 $244,490 0 $0 0 $0 FILES CLOSED FOR INCOMPLETENESS 0 $0 0 $0 0 $0 0 $0 0 $0
Aggregated Statistics For Year 1999(Based on 3 partial tracts) A) FHA, FSA/RHS & VA B) Conventional C) Refinancings D) Home Improvement Loans F) Non-occupant Loans on Number Average Value Number Average Value Number Average Value Number Average Value Number Average Value
LOANS ORIGINATED 7 $153,213 109 $235,909 145 $193,830 17 $37,932 12 $144,856 APPLICATIONS APPROVED, NOT ACCEPTED 0 $0 9 $214,378 20 $172,039 3 $41,430 2 $145,655 APPLICATIONS DENIED 0 $0 8 $247,060 33 $290,115 5 $31,976 4 $119,515 APPLICATIONS WITHDRAWN 1 $180,670 12 $219,348 22 $189,887 2 $94,900 1 $147,490 FILES CLOSED FOR INCOMPLETENESS 0 $0 2 $288,335 7 $244,473 1 $37,960 1 $135,030
Detailed HMDA statistics for the following Tracts:
0098.46
, 0098.47 , 0098.48 , 0120.26 , 0120.30
Private Mortgage Insurance Companies Aggregated Statistics For Year 2009(Based on 1 full and 4 partial tracts) A) Conventional B) Refinancings C) Non-occupant Loans on Number Average Value Number Average Value Number Average Value
LOANS ORIGINATED 4 $299,468 5 $259,088 1 $195,000 APPLICATIONS APPROVED, NOT ACCEPTED 2 $325,060 0 $0 0 $0 APPLICATIONS DENIED 1 $339,680 1 $316,000 0 $0 APPLICATIONS WITHDRAWN 0 $0 0 $0 0 $0 FILES CLOSED FOR INCOMPLETENESS 1 $221,000 0 $0 0 $0
Aggregated Statistics For Year 2008(Based on 1 full and 4 partial tracts) A) Conventional B) Refinancings C) Non-occupant Loans on Number Average Value Number Average Value Number Average Value
LOANS ORIGINATED 22 $285,824 9 $330,222 3 $260,910 APPLICATIONS APPROVED, NOT ACCEPTED 5 $242,344 2 $342,560 0 $0 APPLICATIONS DENIED 1 $467,770 0 $0 0 $0 APPLICATIONS WITHDRAWN 3 $170,683 0 $0 0 $0 FILES CLOSED FOR INCOMPLETENESS 1 $624,580 0 $0 0 $0
Aggregated Statistics For Year 2007(Based on 1 full and 4 partial tracts) A) Conventional B) Refinancings C) Non-occupant Loans on Number Average Value Number Average Value Number Average Value
LOANS ORIGINATED 16 $309,511 3 $288,923 1 $169,340 APPLICATIONS APPROVED, NOT ACCEPTED 0 $0 1 $254,880 0 $0 APPLICATIONS DENIED 0 $0 0 $0 0 $0 APPLICATIONS WITHDRAWN 1 $235,490 1 $199,040 0 $0 FILES CLOSED FOR INCOMPLETENESS 0 $0 0 $0 0 $0
Aggregated Statistics For Year 2006(Based on 1 full and 4 partial tracts) A) Conventional B) Refinancings C) Non-occupant Loans on Number Average Value Number Average Value Number Average Value
LOANS ORIGINATED 4 $207,450 5 $279,776 1 $116,240 APPLICATIONS APPROVED, NOT ACCEPTED 1 $280,590 3 $218,053 0 $0 APPLICATIONS DENIED 0 $0 0 $0 0 $0 APPLICATIONS WITHDRAWN 0 $0 1 $377,900 0 $0 FILES CLOSED FOR INCOMPLETENESS 0 $0 0 $0 0 $0
Aggregated Statistics For Year 2005(Based on 1 full and 4 partial tracts) A) Conventional B) Refinancings C) Non-occupant Loans on Number Average Value Number Average Value Number Average Value
LOANS ORIGINATED 6 $291,315 8 $312,038 1 $377,720 APPLICATIONS APPROVED, NOT ACCEPTED 2 $377,315 1 $289,600 0 $0 APPLICATIONS DENIED 0 $0 0 $0 0 $0 APPLICATIONS WITHDRAWN 7 $196,116 1 $310,770 0 $0 FILES CLOSED FOR INCOMPLETENESS 0 $0 0 $0 0 $0
Aggregated Statistics For Year 2004(Based on 1 full and 4 partial tracts) A) Conventional B) Refinancings C) Non-occupant Loans on Number Average Value Number Average Value Number Average Value
LOANS ORIGINATED 13 $243,346 7 $206,867 3 $208,397 APPLICATIONS APPROVED, NOT ACCEPTED 2 $220,600 1 $260,960 2 $153,125 APPLICATIONS DENIED 0 $0 0 $0 0 $0 APPLICATIONS WITHDRAWN 2 $311,840 1 $163,850 1 $123,680 FILES CLOSED FOR INCOMPLETENESS 0 $0 0 $0 0 $0
Aggregated Statistics For Year 2003(Based on 1 full and 4 partial tracts) A) Conventional B) Refinancings C) Non-occupant Loans on Number Average Value Number Average Value Number Average Value
LOANS ORIGINATED 15 $222,943 18 $230,234 2 $203,865 APPLICATIONS APPROVED, NOT ACCEPTED 3 $228,713 4 $324,862 0 $0 APPLICATIONS DENIED 0 $0 0 $0 0 $0 APPLICATIONS WITHDRAWN 0 $0 3 $191,900 0 $0 FILES CLOSED FOR INCOMPLETENESS 0 $0 0 $0 0 $0
Aggregated Statistics For Year 2002(Based on 1 partial tract) A) Conventional B) Refinancings Number Average Value Number Average Value
LOANS ORIGINATED 2 $295,205 3 $237,667 APPLICATIONS APPROVED, NOT ACCEPTED 0 $0 1 $310,500 APPLICATIONS DENIED 0 $0 0 $0 APPLICATIONS WITHDRAWN 0 $0 0 $0 FILES CLOSED FOR INCOMPLETENESS 0 $0 0 $0
Aggregated Statistics For Year 2001(Based on 1 partial tract) A) Conventional B) Refinancings Number Average Value Number Average Value
LOANS ORIGINATED 4 $240,868 1 $298,310 APPLICATIONS APPROVED, NOT ACCEPTED 0 $0 1 $167,210 APPLICATIONS DENIED 0 $0 0 $0 APPLICATIONS WITHDRAWN 0 $0 0 $0 FILES CLOSED FOR INCOMPLETENESS 0 $0 0 $0
Aggregated Statistics For Year 2000(Based on 1 partial tract) A) Conventional Number Average Value
LOANS ORIGINATED 3 $201,710 APPLICATIONS APPROVED, NOT ACCEPTED 2 $145,130 APPLICATIONS DENIED 0 $0 APPLICATIONS WITHDRAWN 0 $0 FILES CLOSED FOR INCOMPLETENESS 0 $0
Aggregated Statistics For Year 1999(Based on 3 partial tracts) A) Conventional B) Refinancings C) Non-occupant Loans on Number Average Value Number Average Value Number Average Value
LOANS ORIGINATED 22 $211,241 7 $200,230 1 $182,510 APPLICATIONS APPROVED, NOT ACCEPTED 2 $251,255 3 $189,507 0 $0 APPLICATIONS DENIED 0 $0 1 $160,670 0 $0 APPLICATIONS WITHDRAWN 1 $145,400 0 $0 0 $0 FILES CLOSED FOR INCOMPLETENESS 0 $0 0 $0 0 $0
Detailed PMIC statistics for the following Tracts:
0098.46
, 0098.47 , 0098.48 , 0120.26 , 0120.30
Most common first names in Evergreen, CO among deceased individuals Name Count Lived (average)
John 64 74.8 years William 58 71.7 years Mary 57 81.9 years Charles 39 74.4 years Helen 39 81.6 years James 39 72.8 years Margaret 37 81.2 years Robert 36 77.6 years George 32 73.9 years Dorothy 32 84.0 years
Most common last names in Evergreen, CO among deceased individuals Last name Count Lived (average)
Smith 17 80.5 years Anderson 13 76.9 years Nelson 12 83.8 years Johnson 12 76.8 years Davis 11 78.8 years Jones 10 78.7 years Thompson 10 77.8 years Clark 9 76.3 years Gibson 8 81.8 years Jackson 8 72.1 years
Evergreen compared to Colorado state average:
Median household income above state average. Unemployed percentage significantly below state average. Black race population percentage significantly below state average. Hispanic race population percentage significantly below state average. Median age above state average. Foreign-born population percentage significantly below state average. Renting percentage below state average. Number of rooms per house above state average. Percentage of population with a bachelor's degree or higher above state average.
#20 on the list of "Top 100 highest located cities (pop. 5,000+)"
#53 on the list of "Top 101 cities with the highest percentage of workers working at home, population 5,000+"
#61 on the list of "Top 101 cities with largest percentage of females in industries: construction (population 5,000+)"
#85 on the list of "Top 101 cities with largest percentage of females in occupations: management occupations (population 5,000+)"
#12 on the list of "Top 101 counties with the highest percentage of residents that exercised in the past month"
#19 on the list of "Top 101 counties with the largest increase in the number of deaths per 1000 residents 2000-2006 to 2007-2013 (pop. 50,000+)"
#22 on the list of "Top 101 counties with the best general health status score of residents (1-5), 3 years of data"
#45 on the list of "Top 101 counties with the lowest average weight of females"
#55 on the list of "Top 101 counties with the highest surface withdrawal of fresh water for public supply (pop. 50,000+)"
Top Patent Applicants
Wayne C. Boncyk (96)
William L. Thomas (49)
Brian O. Faircloth (41)
John D. Watson (22)
David S. Ginley (19)
Brian Field (17)
Thomas R. Lemmons (16)
Michael Gibson (16)
Joshua D. Taylor (14)
William T. Walker (14)
Total of 910 patent applications in 2008-2024.
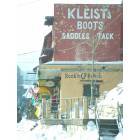
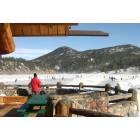
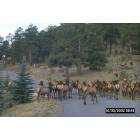
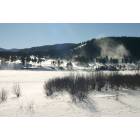
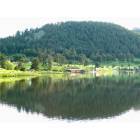
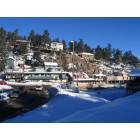
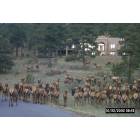

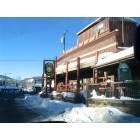
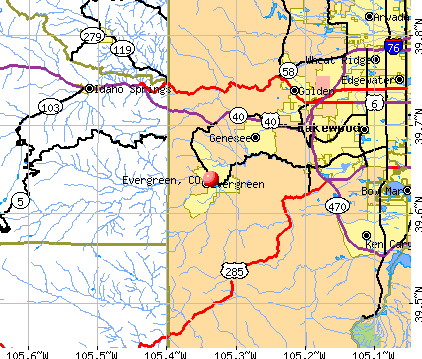


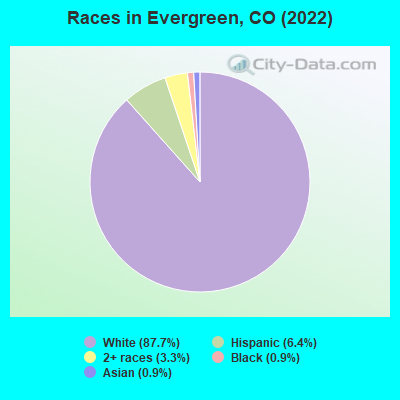
 Recent articles from our blog. Our writers, many of them Ph.D. graduates or candidates, create easy-to-read articles on a wide variety of topics.

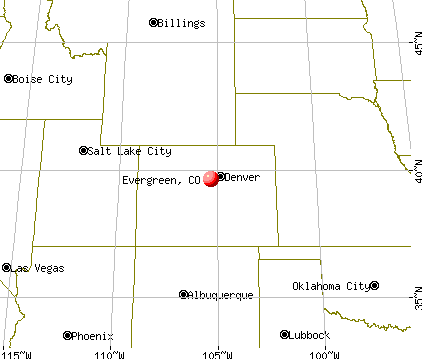
 (13.3 miles
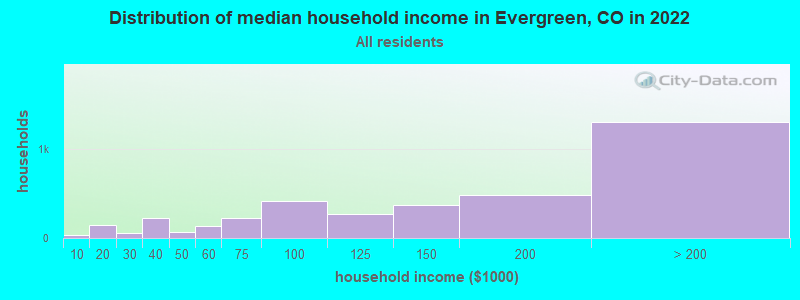
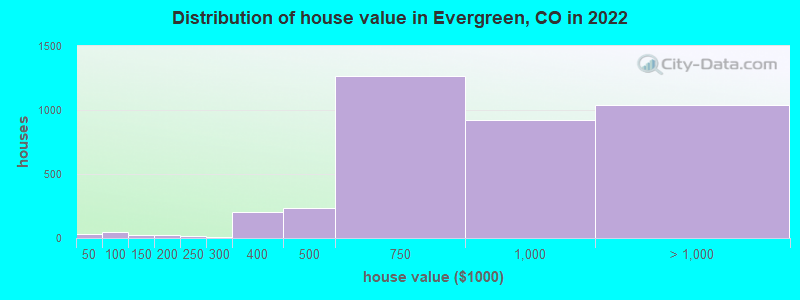
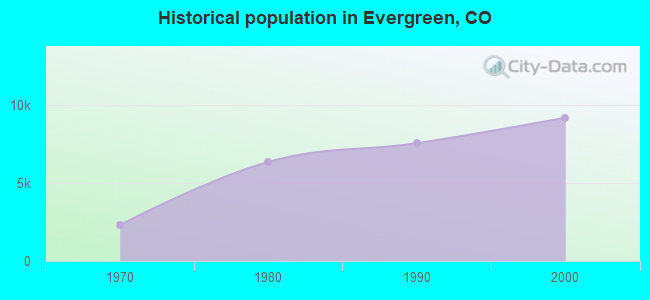
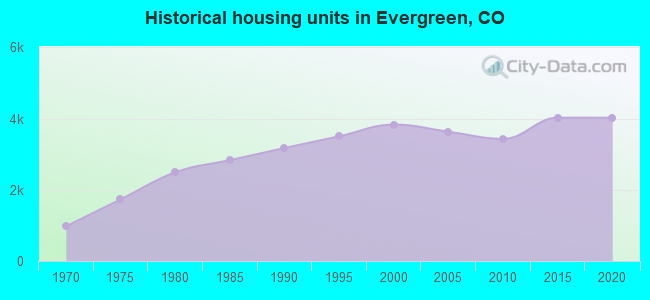
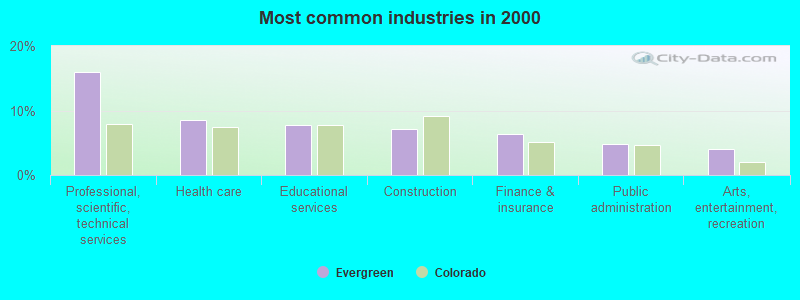
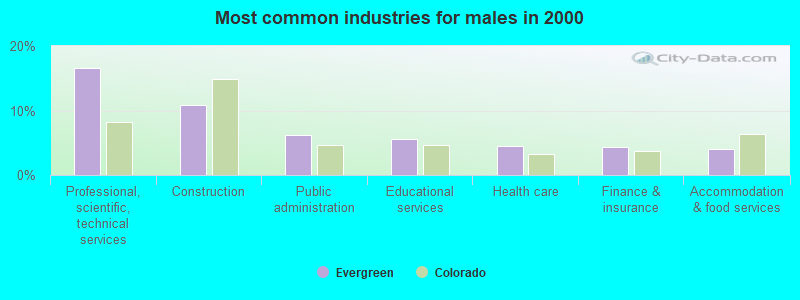
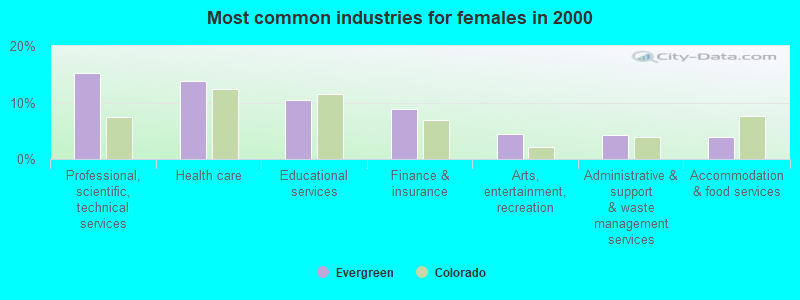
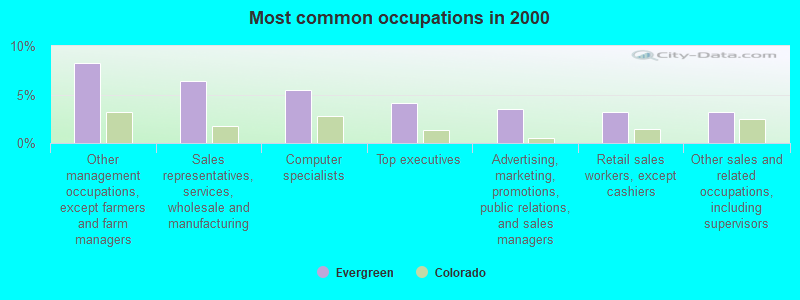
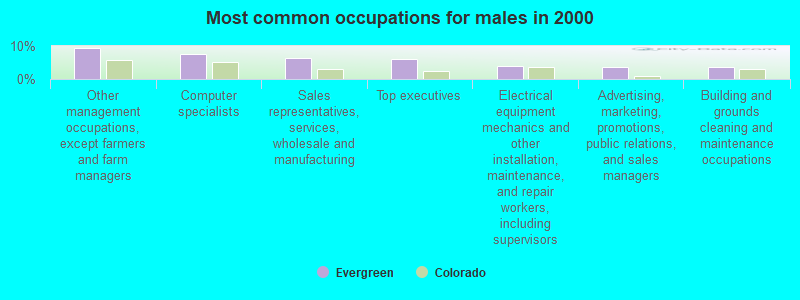
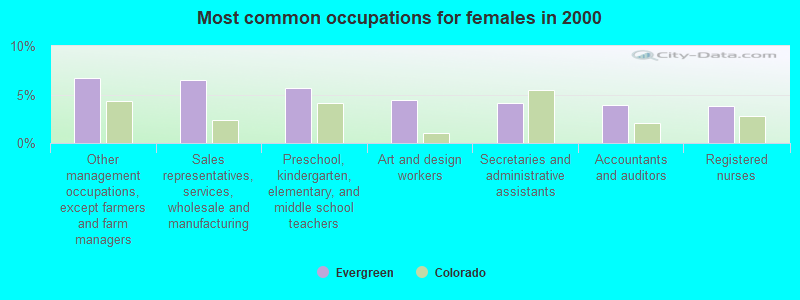


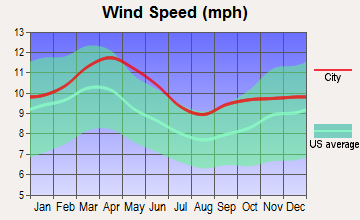
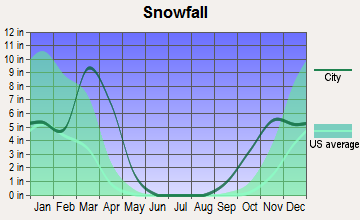
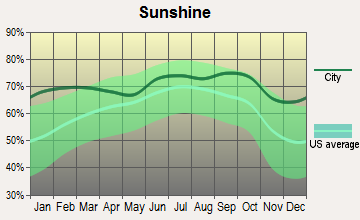
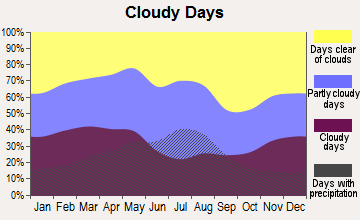
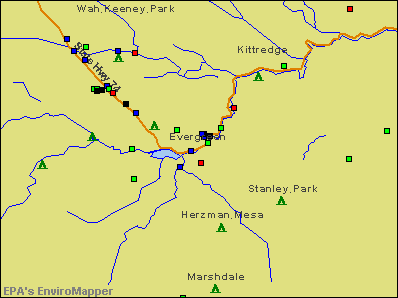

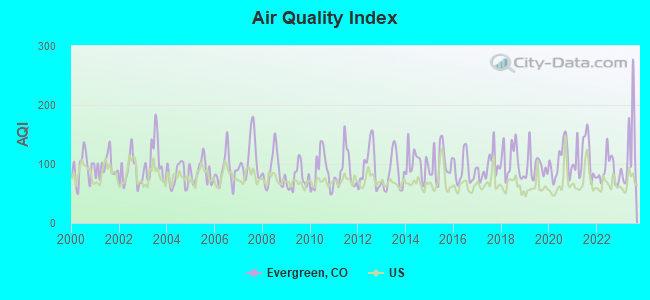
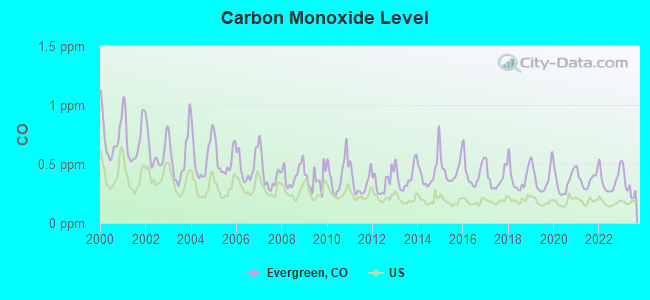
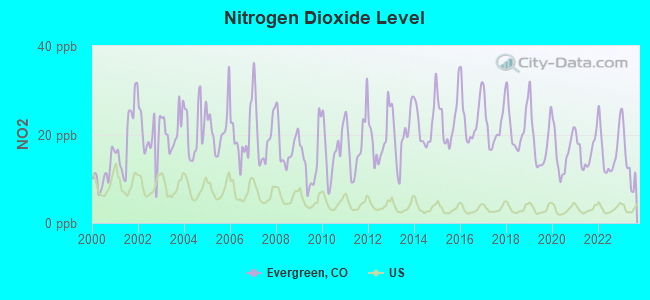
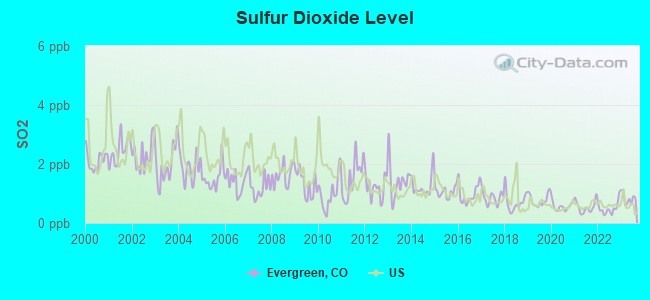
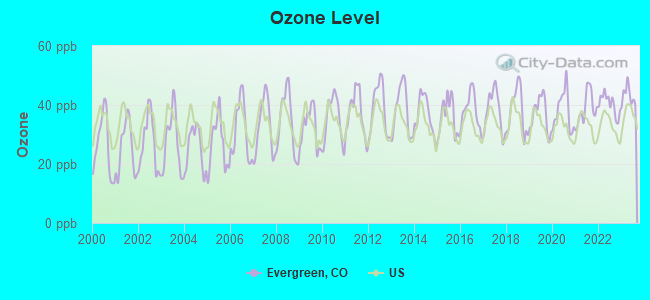
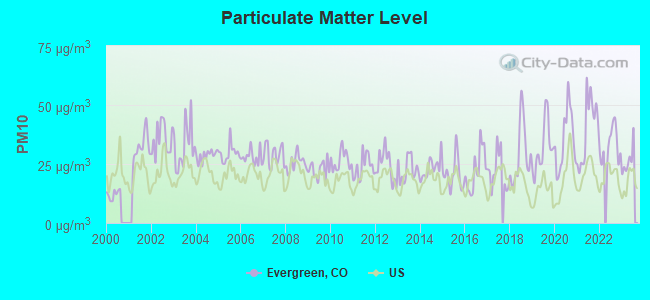
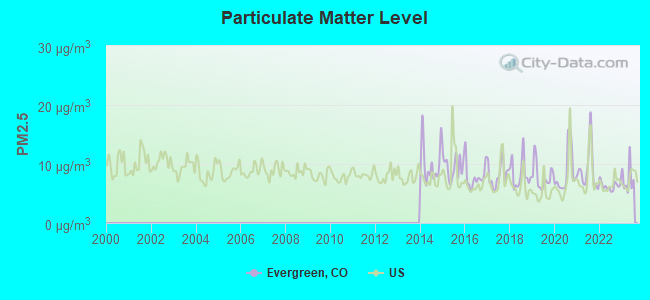
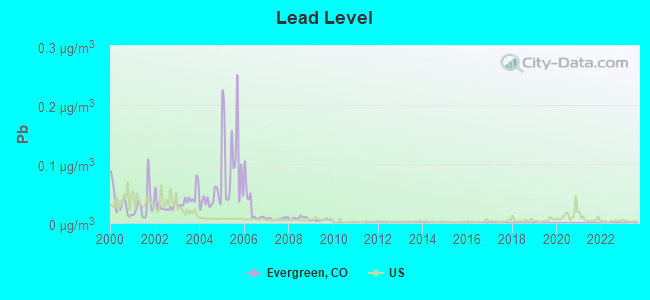

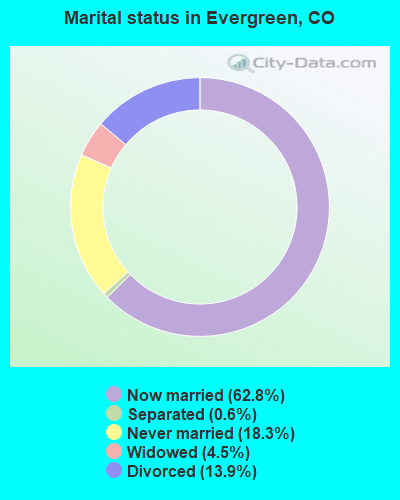
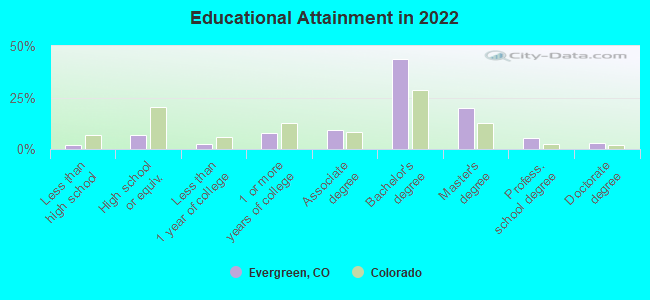
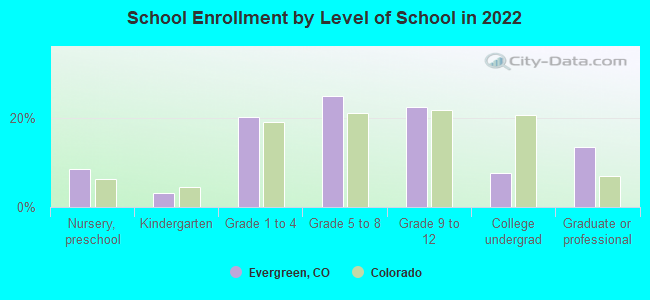
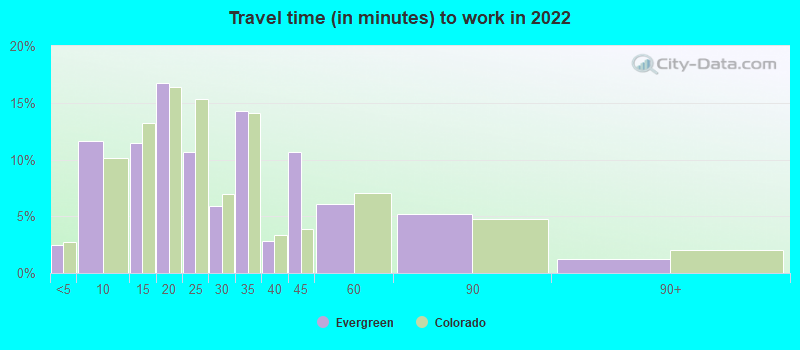
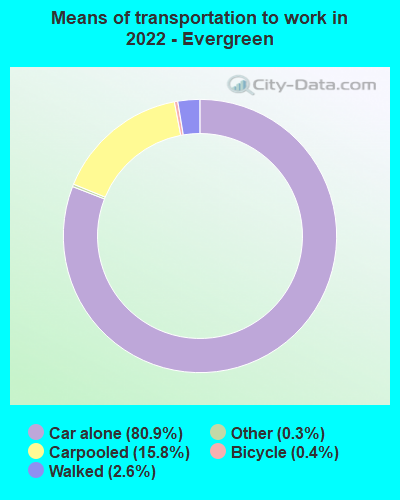
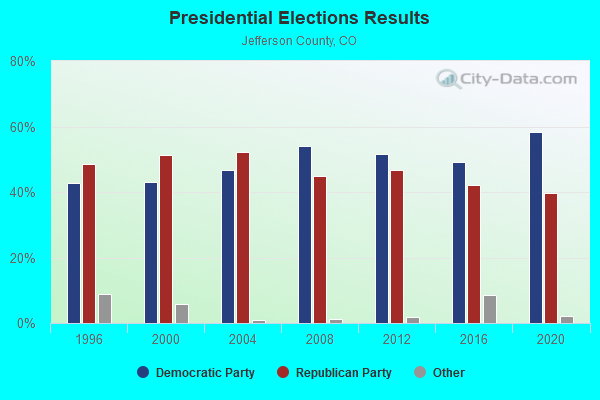
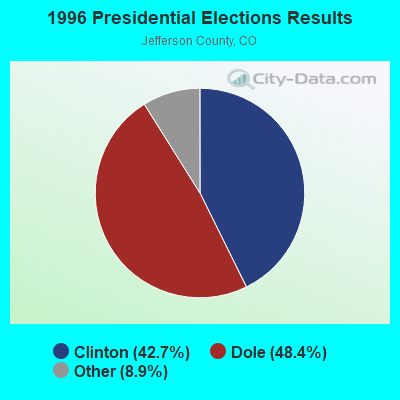

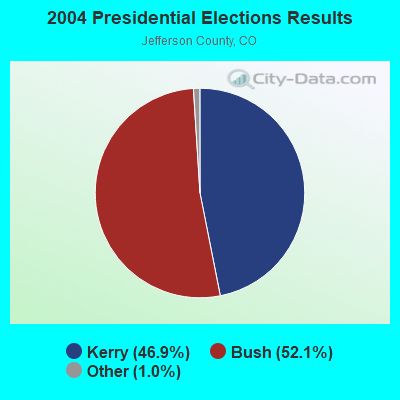
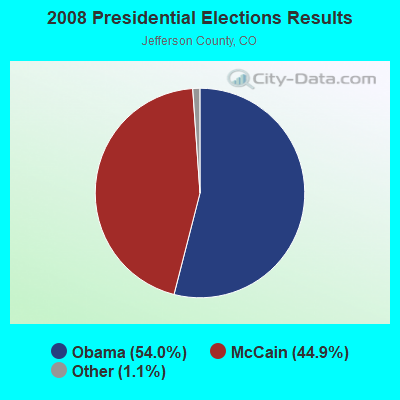
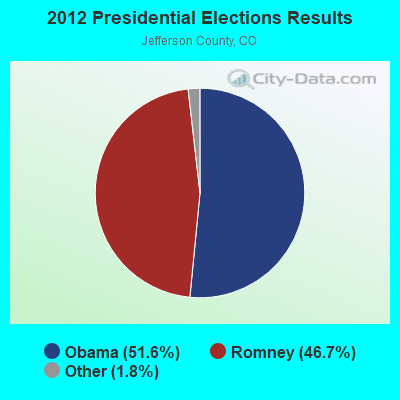
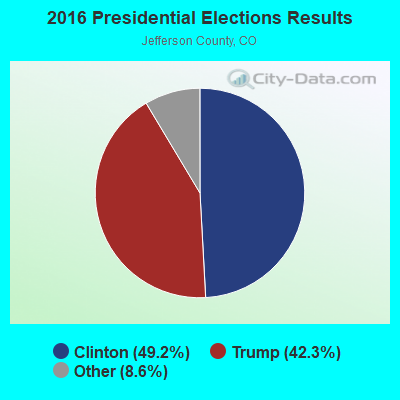

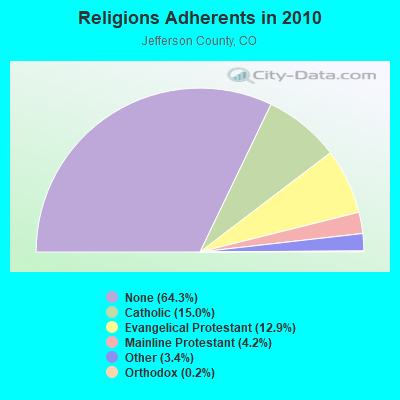
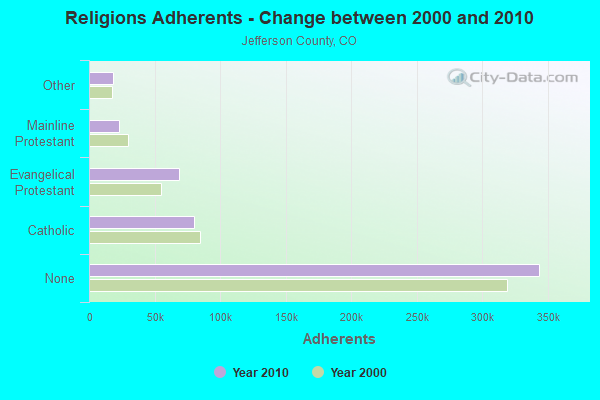
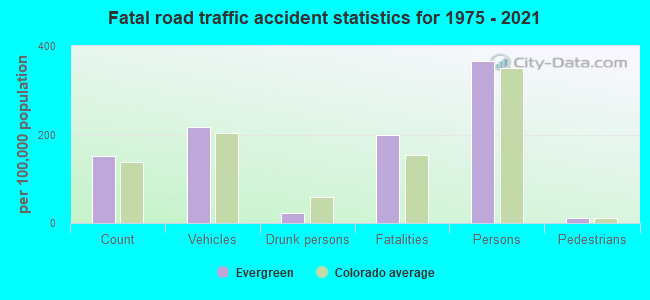
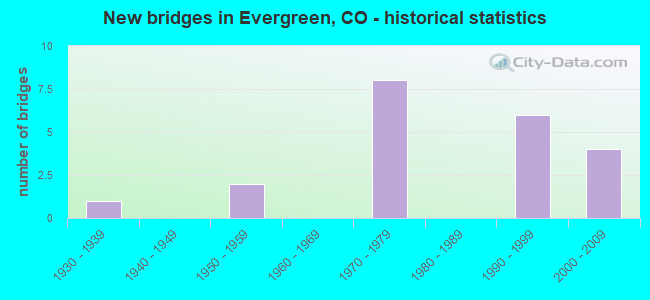
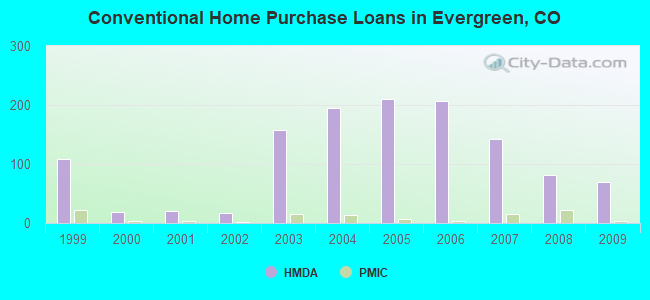
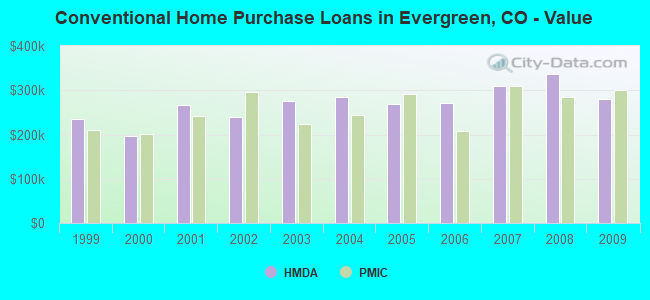
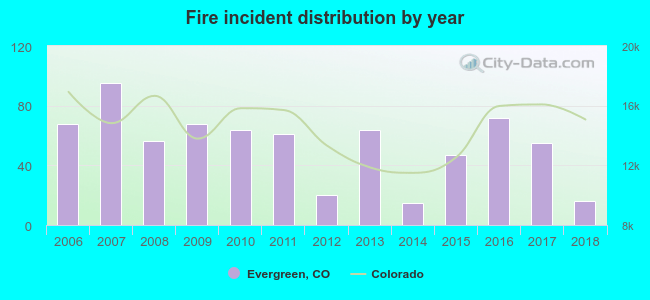 According to the data from the years 2006 - 2018 the average number of fire incidents per year is 54. The highest number of reported fires - 95 took place in 2007, and the least - 15 in 2014. The data has a dropping trend.
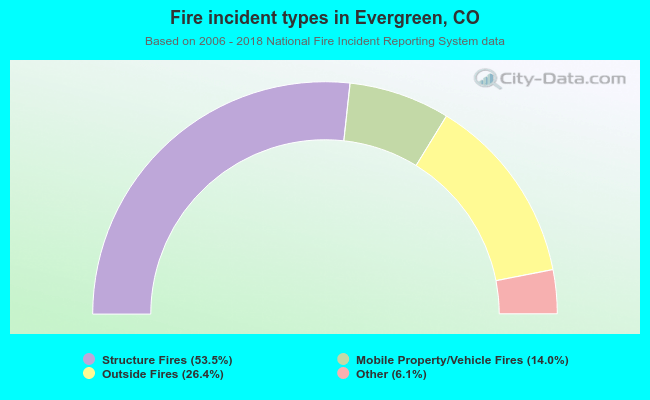 When looking into fire subcategories, the most incidents belonged to: Structure Fires (53.5%), and Outside Fires (26.4%).