Florence, Oregon Submit your own pictures of this city and show them to the world
OSM Map
General Map
Google Map
MSN Map
OSM Map
General Map
Google Map
MSN Map
OSM Map
General Map
Google Map
MSN Map
OSM Map
General Map
Google Map
MSN Map
Please wait while loading the map...
Population in 2022: 9,376 (100% urban, 0% rural). Population change since 2000: +29.1%Males: 4,133 Females: 5,243
March 2022 cost of living index in Florence: 98.7 (near average, U.S. average is 100) Percentage of residents living in poverty in 2022: 12.4%for White Non-Hispanic residents , 26.5% for Hispanic or Latino residents , 38.2% for other race residents , 28.3% for two or more races residents )
Profiles of local businesses
Business Search - 14 Million verified businesses
Data:
Median household income ($)
Median household income (% change since 2000)
Household income diversity
Ratio of average income to average house value (%)
Ratio of average income to average rent
Median household income ($) - White
Median household income ($) - Black or African American
Median household income ($) - Asian
Median household income ($) - Hispanic or Latino
Median household income ($) - American Indian and Alaska Native
Median household income ($) - Multirace
Median household income ($) - Other Race
Median household income for houses/condos with a mortgage ($)
Median household income for apartments without a mortgage ($)
Races - White alone (%)
Races - White alone (% change since 2000)
Races - Black alone (%)
Races - Black alone (% change since 2000)
Races - American Indian alone (%)
Races - American Indian alone (% change since 2000)
Races - Asian alone (%)
Races - Asian alone (% change since 2000)
Races - Hispanic (%)
Races - Hispanic (% change since 2000)
Races - Native Hawaiian and Other Pacific Islander alone (%)
Races - Native Hawaiian and Other Pacific Islander alone (% change since 2000)
Races - Two or more races (%)
Races - Two or more races (% change since 2000)
Races - Other race alone (%)
Races - Other race alone (% change since 2000)
Racial diversity
Unemployment (%)
Unemployment (% change since 2000)
Unemployment (%) - White
Unemployment (%) - Black or African American
Unemployment (%) - Asian
Unemployment (%) - Hispanic or Latino
Unemployment (%) - American Indian and Alaska Native
Unemployment (%) - Multirace
Unemployment (%) - Other Race
Population density (people per square mile)
Population - Males (%)
Population - Females (%)
Population - Males (%) - White
Population - Males (%) - Black or African American
Population - Males (%) - Asian
Population - Males (%) - Hispanic or Latino
Population - Males (%) - American Indian and Alaska Native
Population - Males (%) - Multirace
Population - Males (%) - Other Race
Population - Females (%) - White
Population - Females (%) - Black or African American
Population - Females (%) - Asian
Population - Females (%) - Hispanic or Latino
Population - Females (%) - American Indian and Alaska Native
Population - Females (%) - Multirace
Population - Females (%) - Other Race
Coronavirus confirmed cases (Apr 27, 2024)
Deaths caused by coronavirus (Apr 27, 2024)
Coronavirus confirmed cases (per 100k population) (Apr 27, 2024)
Deaths caused by coronavirus (per 100k population) (Apr 27, 2024)
Daily increase in number of cases (Apr 27, 2024)
Weekly increase in number of cases (Apr 27, 2024)
Cases doubled (in days) (Apr 27, 2024)
Hospitalized patients (Apr 18, 2022)
Negative test results (Apr 18, 2022)
Total test results (Apr 18, 2022)
COVID Vaccine doses distributed (per 100k population) (Sep 19, 2023)
COVID Vaccine doses administered (per 100k population) (Sep 19, 2023)
COVID Vaccine doses distributed (Sep 19, 2023)
COVID Vaccine doses administered (Sep 19, 2023)
Likely homosexual households (%)
Likely homosexual households (% change since 2000)
Likely homosexual households - Lesbian couples (%)
Likely homosexual households - Lesbian couples (% change since 2000)
Likely homosexual households - Gay men (%)
Likely homosexual households - Gay men (% change since 2000)
Cost of living index
Median gross rent ($)
Median contract rent ($)
Median monthly housing costs ($)
Median house or condo value ($)
Median house or condo value ($ change since 2000)
Mean house or condo value by units in structure - 1, detached ($)
Mean house or condo value by units in structure - 1, attached ($)
Mean house or condo value by units in structure - 2 ($)
Mean house or condo value by units in structure by units in structure - 3 or 4 ($)
Mean house or condo value by units in structure - 5 or more ($)
Mean house or condo value by units in structure - Boat, RV, van, etc. ($)
Mean house or condo value by units in structure - Mobile home ($)
Median house or condo value ($) - White
Median house or condo value ($) - Black or African American
Median house or condo value ($) - Asian
Median house or condo value ($) - Hispanic or Latino
Median house or condo value ($) - American Indian and Alaska Native
Median house or condo value ($) - Multirace
Median house or condo value ($) - Other Race
Median resident age
Resident age diversity
Median resident age - Males
Median resident age - Females
Median resident age - White
Median resident age - Black or African American
Median resident age - Asian
Median resident age - Hispanic or Latino
Median resident age - American Indian and Alaska Native
Median resident age - Multirace
Median resident age - Other Race
Median resident age - Males - White
Median resident age - Males - Black or African American
Median resident age - Males - Asian
Median resident age - Males - Hispanic or Latino
Median resident age - Males - American Indian and Alaska Native
Median resident age - Males - Multirace
Median resident age - Males - Other Race
Median resident age - Females - White
Median resident age - Females - Black or African American
Median resident age - Females - Asian
Median resident age - Females - Hispanic or Latino
Median resident age - Females - American Indian and Alaska Native
Median resident age - Females - Multirace
Median resident age - Females - Other Race
Commute - mean travel time to work (minutes)
Travel time to work - Less than 5 minutes (%)
Travel time to work - Less than 5 minutes (% change since 2000)
Travel time to work - 5 to 9 minutes (%)
Travel time to work - 5 to 9 minutes (% change since 2000)
Travel time to work - 10 to 19 minutes (%)
Travel time to work - 10 to 19 minutes (% change since 2000)
Travel time to work - 20 to 29 minutes (%)
Travel time to work - 20 to 29 minutes (% change since 2000)
Travel time to work - 30 to 39 minutes (%)
Travel time to work - 30 to 39 minutes (% change since 2000)
Travel time to work - 40 to 59 minutes (%)
Travel time to work - 40 to 59 minutes (% change since 2000)
Travel time to work - 60 to 89 minutes (%)
Travel time to work - 60 to 89 minutes (% change since 2000)
Travel time to work - 90 or more minutes (%)
Travel time to work - 90 or more minutes (% change since 2000)
Marital status - Never married (%)
Marital status - Now married (%)
Marital status - Separated (%)
Marital status - Widowed (%)
Marital status - Divorced (%)
Median family income ($)
Median family income (% change since 2000)
Median non-family income ($)
Median non-family income (% change since 2000)
Median per capita income ($)
Median per capita income (% change since 2000)
Median family income ($) - White
Median family income ($) - Black or African American
Median family income ($) - Asian
Median family income ($) - Hispanic or Latino
Median family income ($) - American Indian and Alaska Native
Median family income ($) - Multirace
Median family income ($) - Other Race
Median year house/condo built
Median year apartment built
Year house built - Built 2005 or later (%)
Year house built - Built 2000 to 2004 (%)
Year house built - Built 1990 to 1999 (%)
Year house built - Built 1980 to 1989 (%)
Year house built - Built 1970 to 1979 (%)
Year house built - Built 1960 to 1969 (%)
Year house built - Built 1950 to 1959 (%)
Year house built - Built 1940 to 1949 (%)
Year house built - Built 1939 or earlier (%)
Average household size
Household density (households per square mile)
Average household size - White
Average household size - Black or African American
Average household size - Asian
Average household size - Hispanic or Latino
Average household size - American Indian and Alaska Native
Average household size - Multirace
Average household size - Other Race
Occupied housing units (%)
Vacant housing units (%)
Owner occupied housing units (%)
Renter occupied housing units (%)
Vacancy status - For rent (%)
Vacancy status - For sale only (%)
Vacancy status - Rented or sold, not occupied (%)
Vacancy status - For seasonal, recreational, or occasional use (%)
Vacancy status - For migrant workers (%)
Vacancy status - Other vacant (%)
Residents with income below the poverty level (%)
Residents with income below 50% of the poverty level (%)
Children below poverty level (%)
Poor families by family type - Married-couple family (%)
Poor families by family type - Male, no wife present (%)
Poor families by family type - Female, no husband present (%)
Poverty status for native-born residents (%)
Poverty status for foreign-born residents (%)
Poverty among high school graduates not in families (%)
Poverty among people who did not graduate high school not in families (%)
Residents with income below the poverty level (%) - White
Residents with income below the poverty level (%) - Black or African American
Residents with income below the poverty level (%) - Asian
Residents with income below the poverty level (%) - Hispanic or Latino
Residents with income below the poverty level (%) - American Indian and Alaska Native
Residents with income below the poverty level (%) - Multirace
Residents with income below the poverty level (%) - Other Race
Air pollution - Air Quality Index (AQI)
Air pollution - CO
Air pollution - NO2
Air pollution - SO2
Air pollution - Ozone
Air pollution - PM10
Air pollution - PM25
Air pollution - Pb
Crime - Murders per 100,000 population
Crime - Rapes per 100,000 population
Crime - Robberies per 100,000 population
Crime - Assaults per 100,000 population
Crime - Burglaries per 100,000 population
Crime - Thefts per 100,000 population
Crime - Auto thefts per 100,000 population
Crime - Arson per 100,000 population
Crime - City-data.com crime index
Crime - Violent crime index
Crime - Property crime index
Crime - Murders per 100,000 population (5 year average)
Crime - Rapes per 100,000 population (5 year average)
Crime - Robberies per 100,000 population (5 year average)
Crime - Assaults per 100,000 population (5 year average)
Crime - Burglaries per 100,000 population (5 year average)
Crime - Thefts per 100,000 population (5 year average)
Crime - Auto thefts per 100,000 population (5 year average)
Crime - Arson per 100,000 population (5 year average)
Crime - City-data.com crime index (5 year average)
Crime - Violent crime index (5 year average)
Crime - Property crime index (5 year average)
1996 Presidential Elections Results (%) - Democratic Party (Clinton)
1996 Presidential Elections Results (%) - Republican Party (Dole)
1996 Presidential Elections Results (%) - Other
2000 Presidential Elections Results (%) - Democratic Party (Gore)
2000 Presidential Elections Results (%) - Republican Party (Bush)
2000 Presidential Elections Results (%) - Other
2004 Presidential Elections Results (%) - Democratic Party (Kerry)
2004 Presidential Elections Results (%) - Republican Party (Bush)
2004 Presidential Elections Results (%) - Other
2008 Presidential Elections Results (%) - Democratic Party (Obama)
2008 Presidential Elections Results (%) - Republican Party (McCain)
2008 Presidential Elections Results (%) - Other
2012 Presidential Elections Results (%) - Democratic Party (Obama)
2012 Presidential Elections Results (%) - Republican Party (Romney)
2012 Presidential Elections Results (%) - Other
2016 Presidential Elections Results (%) - Democratic Party (Clinton)
2016 Presidential Elections Results (%) - Republican Party (Trump)
2016 Presidential Elections Results (%) - Other
2020 Presidential Elections Results (%) - Democratic Party (Biden)
2020 Presidential Elections Results (%) - Republican Party (Trump)
2020 Presidential Elections Results (%) - Other
Ancestries Reported - Arab (%)
Ancestries Reported - Czech (%)
Ancestries Reported - Danish (%)
Ancestries Reported - Dutch (%)
Ancestries Reported - English (%)
Ancestries Reported - French (%)
Ancestries Reported - French Canadian (%)
Ancestries Reported - German (%)
Ancestries Reported - Greek (%)
Ancestries Reported - Hungarian (%)
Ancestries Reported - Irish (%)
Ancestries Reported - Italian (%)
Ancestries Reported - Lithuanian (%)
Ancestries Reported - Norwegian (%)
Ancestries Reported - Polish (%)
Ancestries Reported - Portuguese (%)
Ancestries Reported - Russian (%)
Ancestries Reported - Scotch-Irish (%)
Ancestries Reported - Scottish (%)
Ancestries Reported - Slovak (%)
Ancestries Reported - Subsaharan African (%)
Ancestries Reported - Swedish (%)
Ancestries Reported - Swiss (%)
Ancestries Reported - Ukrainian (%)
Ancestries Reported - United States (%)
Ancestries Reported - Welsh (%)
Ancestries Reported - West Indian (%)
Ancestries Reported - Other (%)
Educational Attainment - No schooling completed (%)
Educational Attainment - Less than high school (%)
Educational Attainment - High school or equivalent (%)
Educational Attainment - Less than 1 year of college (%)
Educational Attainment - 1 or more years of college (%)
Educational Attainment - Associate degree (%)
Educational Attainment - Bachelor's degree (%)
Educational Attainment - Master's degree (%)
Educational Attainment - Professional school degree (%)
Educational Attainment - Doctorate degree (%)
School Enrollment - Nursery, preschool (%)
School Enrollment - Kindergarten (%)
School Enrollment - Grade 1 to 4 (%)
School Enrollment - Grade 5 to 8 (%)
School Enrollment - Grade 9 to 12 (%)
School Enrollment - College undergrad (%)
School Enrollment - Graduate or professional (%)
School Enrollment - Not enrolled in school (%)
School enrollment - Public schools (%)
School enrollment - Private schools (%)
School enrollment - Not enrolled (%)
Median number of rooms in houses and condos
Median number of rooms in apartments
Housing units lacking complete plumbing facilities (%)
Housing units lacking complete kitchen facilities (%)
Density of houses
Urban houses (%)
Rural houses (%)
Households with people 60 years and over (%)
Households with people 65 years and over (%)
Households with people 75 years and over (%)
Households with one or more nonrelatives (%)
Households with no nonrelatives (%)
Population in households (%)
Family households (%)
Nonfamily households (%)
Population in families (%)
Family households with own children (%)
Median number of bedrooms in owner occupied houses
Mean number of bedrooms in owner occupied houses
Median number of bedrooms in renter occupied houses
Mean number of bedrooms in renter occupied houses
Median number of vehichles in owner occupied houses
Mean number of vehichles in owner occupied houses
Median number of vehichles in renter occupied houses
Mean number of vehichles in renter occupied houses
Mortgage status - with mortgage (%)
Mortgage status - with second mortgage (%)
Mortgage status - with home equity loan (%)
Mortgage status - with both second mortgage and home equity loan (%)
Mortgage status - without a mortgage (%)
Average family size
Average family size - White
Average family size - Black or African American
Average family size - Asian
Average family size - Hispanic or Latino
Average family size - American Indian and Alaska Native
Average family size - Multirace
Average family size - Other Race
Geographical mobility - Same house 1 year ago (%)
Geographical mobility - Moved within same county (%)
Geographical mobility - Moved from different county within same state (%)
Geographical mobility - Moved from different state (%)
Geographical mobility - Moved from abroad (%)
Place of birth - Born in state of residence (%)
Place of birth - Born in other state (%)
Place of birth - Native, outside of US (%)
Place of birth - Foreign born (%)
Housing units in structures - 1, detached (%)
Housing units in structures - 1, attached (%)
Housing units in structures - 2 (%)
Housing units in structures - 3 or 4 (%)
Housing units in structures - 5 to 9 (%)
Housing units in structures - 10 to 19 (%)
Housing units in structures - 20 to 49 (%)
Housing units in structures - 50 or more (%)
Housing units in structures - Mobile home (%)
Housing units in structures - Boat, RV, van, etc. (%)
House/condo owner moved in on average (years ago)
Renter moved in on average (years ago)
Year householder moved into unit - Moved in 1999 to March 2000 (%)
Year householder moved into unit - Moved in 1995 to 1998 (%)
Year householder moved into unit - Moved in 1990 to 1994 (%)
Year householder moved into unit - Moved in 1980 to 1989 (%)
Year householder moved into unit - Moved in 1970 to 1979 (%)
Year householder moved into unit - Moved in 1969 or earlier (%)
Means of transportation to work - Drove car alone (%)
Means of transportation to work - Carpooled (%)
Means of transportation to work - Public transportation (%)
Means of transportation to work - Bus or trolley bus (%)
Means of transportation to work - Streetcar or trolley car (%)
Means of transportation to work - Subway or elevated (%)
Means of transportation to work - Railroad (%)
Means of transportation to work - Ferryboat (%)
Means of transportation to work - Taxicab (%)
Means of transportation to work - Motorcycle (%)
Means of transportation to work - Bicycle (%)
Means of transportation to work - Walked (%)
Means of transportation to work - Other means (%)
Working at home (%)
Industry diversity
Most Common Industries - Agriculture, forestry, fishing and hunting, and mining (%)
Most Common Industries - Agriculture, forestry, fishing and hunting (%)
Most Common Industries - Mining, quarrying, and oil and gas extraction (%)
Most Common Industries - Construction (%)
Most Common Industries - Manufacturing (%)
Most Common Industries - Wholesale trade (%)
Most Common Industries - Retail trade (%)
Most Common Industries - Transportation and warehousing, and utilities (%)
Most Common Industries - Transportation and warehousing (%)
Most Common Industries - Utilities (%)
Most Common Industries - Information (%)
Most Common Industries - Finance and insurance, and real estate and rental and leasing (%)
Most Common Industries - Finance and insurance (%)
Most Common Industries - Real estate and rental and leasing (%)
Most Common Industries - Professional, scientific, and management, and administrative and waste management services (%)
Most Common Industries - Professional, scientific, and technical services (%)
Most Common Industries - Management of companies and enterprises (%)
Most Common Industries - Administrative and support and waste management services (%)
Most Common Industries - Educational services, and health care and social assistance (%)
Most Common Industries - Educational services (%)
Most Common Industries - Health care and social assistance (%)
Most Common Industries - Arts, entertainment, and recreation, and accommodation and food services (%)
Most Common Industries - Arts, entertainment, and recreation (%)
Most Common Industries - Accommodation and food services (%)
Most Common Industries - Other services, except public administration (%)
Most Common Industries - Public administration (%)
Occupation diversity
Most Common Occupations - Management, business, science, and arts occupations (%)
Most Common Occupations - Management, business, and financial occupations (%)
Most Common Occupations - Management occupations (%)
Most Common Occupations - Business and financial operations occupations (%)
Most Common Occupations - Computer, engineering, and science occupations (%)
Most Common Occupations - Computer and mathematical occupations (%)
Most Common Occupations - Architecture and engineering occupations (%)
Most Common Occupations - Life, physical, and social science occupations (%)
Most Common Occupations - Education, legal, community service, arts, and media occupations (%)
Most Common Occupations - Community and social service occupations (%)
Most Common Occupations - Legal occupations (%)
Most Common Occupations - Education, training, and library occupations (%)
Most Common Occupations - Arts, design, entertainment, sports, and media occupations (%)
Most Common Occupations - Healthcare practitioners and technical occupations (%)
Most Common Occupations - Health diagnosing and treating practitioners and other technical occupations (%)
Most Common Occupations - Health technologists and technicians (%)
Most Common Occupations - Service occupations (%)
Most Common Occupations - Healthcare support occupations (%)
Most Common Occupations - Protective service occupations (%)
Most Common Occupations - Fire fighting and prevention, and other protective service workers including supervisors (%)
Most Common Occupations - Law enforcement workers including supervisors (%)
Most Common Occupations - Food preparation and serving related occupations (%)
Most Common Occupations - Building and grounds cleaning and maintenance occupations (%)
Most Common Occupations - Personal care and service occupations (%)
Most Common Occupations - Sales and office occupations (%)
Most Common Occupations - Sales and related occupations (%)
Most Common Occupations - Office and administrative support occupations (%)
Most Common Occupations - Natural resources, construction, and maintenance occupations (%)
Most Common Occupations - Farming, fishing, and forestry occupations (%)
Most Common Occupations - Construction and extraction occupations (%)
Most Common Occupations - Installation, maintenance, and repair occupations (%)
Most Common Occupations - Production, transportation, and material moving occupations (%)
Most Common Occupations - Production occupations (%)
Most Common Occupations - Transportation occupations (%)
Most Common Occupations - Material moving occupations (%)
People in Group quarters - Institutionalized population (%)
People in Group quarters - Correctional institutions (%)
People in Group quarters - Federal prisons and detention centers (%)
People in Group quarters - Halfway houses (%)
People in Group quarters - Local jails and other confinement facilities (including police lockups) (%)
People in Group quarters - Military disciplinary barracks (%)
People in Group quarters - State prisons (%)
People in Group quarters - Other types of correctional institutions (%)
People in Group quarters - Nursing homes (%)
People in Group quarters - Hospitals/wards, hospices, and schools for the handicapped (%)
People in Group quarters - Hospitals/wards and hospices for chronically ill (%)
People in Group quarters - Hospices or homes for chronically ill (%)
People in Group quarters - Military hospitals or wards for chronically ill (%)
People in Group quarters - Other hospitals or wards for chronically ill (%)
People in Group quarters - Hospitals or wards for drug/alcohol abuse (%)
People in Group quarters - Mental (Psychiatric) hospitals or wards (%)
People in Group quarters - Schools, hospitals, or wards for the mentally retarded (%)
People in Group quarters - Schools, hospitals, or wards for the physically handicapped (%)
People in Group quarters - Institutions for the deaf (%)
People in Group quarters - Institutions for the blind (%)
People in Group quarters - Orthopedic wards and institutions for the physically handicapped (%)
People in Group quarters - Wards in general hospitals for patients who have no usual home elsewhere (%)
People in Group quarters - Wards in military hospitals for patients who have no usual home elsewhere (%)
People in Group quarters - Juvenile institutions (%)
People in Group quarters - Long-term care (%)
People in Group quarters - Homes for abused, dependent, and neglected children (%)
People in Group quarters - Residential treatment centers for emotionally disturbed children (%)
People in Group quarters - Training schools for juvenile delinquents (%)
People in Group quarters - Short-term care, detention or diagnostic centers for delinquent children (%)
People in Group quarters - Type of juvenile institution unknown (%)
People in Group quarters - Noninstitutionalized population (%)
People in Group quarters - College dormitories (includes college quarters off campus) (%)
People in Group quarters - Military quarters (%)
People in Group quarters - On base (%)
People in Group quarters - Barracks, unaccompanied personnel housing (UPH), (Enlisted/Officer), ;and similar group living quarters for military personnel (%)
People in Group quarters - Transient quarters for temporary residents (%)
People in Group quarters - Military ships (%)
People in Group quarters - Group homes (%)
People in Group quarters - Homes or halfway houses for drug/alcohol abuse (%)
People in Group quarters - Homes for the mentally ill (%)
People in Group quarters - Homes for the mentally retarded (%)
People in Group quarters - Homes for the physically handicapped (%)
People in Group quarters - Other group homes (%)
People in Group quarters - Religious group quarters (%)
People in Group quarters - Dormitories (%)
People in Group quarters - Agriculture workers' dormitories on farms (%)
People in Group quarters - Job Corps and vocational training facilities (%)
People in Group quarters - Other workers' dormitories (%)
People in Group quarters - Crews of maritime vessels (%)
People in Group quarters - Other nonhousehold living situations (%)
People in Group quarters - Other noninstitutional group quarters (%)
Residents speaking English at home (%)
Residents speaking English at home - Born in the United States (%)
Residents speaking English at home - Native, born elsewhere (%)
Residents speaking English at home - Foreign born (%)
Residents speaking Spanish at home (%)
Residents speaking Spanish at home - Born in the United States (%)
Residents speaking Spanish at home - Native, born elsewhere (%)
Residents speaking Spanish at home - Foreign born (%)
Residents speaking other language at home (%)
Residents speaking other language at home - Born in the United States (%)
Residents speaking other language at home - Native, born elsewhere (%)
Residents speaking other language at home - Foreign born (%)
Class of Workers - Employee of private company (%)
Class of Workers - Self-employed in own incorporated business (%)
Class of Workers - Private not-for-profit wage and salary workers (%)
Class of Workers - Local government workers (%)
Class of Workers - State government workers (%)
Class of Workers - Federal government workers (%)
Class of Workers - Self-employed workers in own not incorporated business and Unpaid family workers (%)
House heating fuel used in houses and condos - Utility gas (%)
House heating fuel used in houses and condos - Bottled, tank, or LP gas (%)
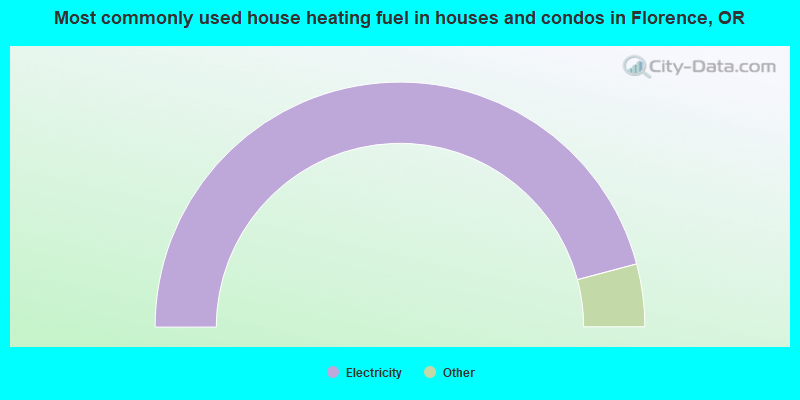
House heating fuel used in houses and condos - Electricity (%)
House heating fuel used in houses and condos - Fuel oil, kerosene, etc. (%)
House heating fuel used in houses and condos - Coal or coke (%)
House heating fuel used in houses and condos - Wood (%)
House heating fuel used in houses and condos - Solar energy (%)
House heating fuel used in houses and condos - Other fuel (%)
House heating fuel used in houses and condos - No fuel used (%)
House heating fuel used in apartments - Utility gas (%)
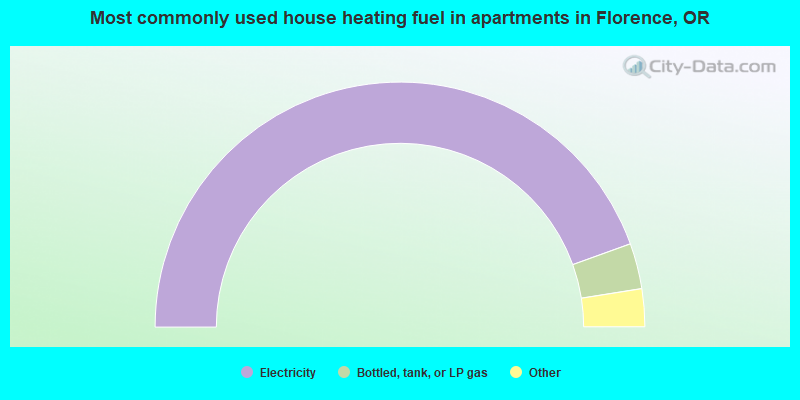
House heating fuel used in apartments - Bottled, tank, or LP gas (%)
House heating fuel used in apartments - Electricity (%)
House heating fuel used in apartments - Fuel oil, kerosene, etc. (%)
House heating fuel used in apartments - Coal or coke (%)
House heating fuel used in apartments - Wood (%)
House heating fuel used in apartments - Solar energy (%)
House heating fuel used in apartments - Other fuel (%)
House heating fuel used in apartments - No fuel used (%)
Armed forces status - In Armed Forces (%)
Armed forces status - Civilian (%)
Armed forces status - Civilian - Veteran (%)
Armed forces status - Civilian - Nonveteran (%)
Fatal accidents locations in years 2005-2021
Fatal accidents locations in 2005
Fatal accidents locations in 2006
Fatal accidents locations in 2007
Fatal accidents locations in 2008
Fatal accidents locations in 2009
Fatal accidents locations in 2010
Fatal accidents locations in 2011
Fatal accidents locations in 2012
Fatal accidents locations in 2013
Fatal accidents locations in 2014
Fatal accidents locations in 2015
Fatal accidents locations in 2016
Fatal accidents locations in 2017
Fatal accidents locations in 2018
Fatal accidents locations in 2019
Fatal accidents locations in 2020
Fatal accidents locations in 2021
Alcohol use - People drinking some alcohol every month (%)
Alcohol use - People not drinking at all (%)
Alcohol use - Average days/month drinking alcohol
Alcohol use - Average drinks/week
Alcohol use - Average days/year people drink much
Audiometry - Average condition of hearing (%)
Audiometry - People that can hear a whisper from across a quiet room (%)
Audiometry - People that can hear normal voice from across a quiet room (%)
Audiometry - Ears ringing, roaring, buzzing (%)
Audiometry - Had a job exposure to loud noise (%)
Audiometry - Had off-work exposure to loud noise (%)
Blood Pressure & Cholesterol - Has high blood pressure (%)
Blood Pressure & Cholesterol - Checking blood pressure at home (%)
Blood Pressure & Cholesterol - Frequently checking blood cholesterol (%)
Blood Pressure & Cholesterol - Has high cholesterol level (%)
Consumer Behavior - Money monthly spent on food at supermarket/grocery store
Consumer Behavior - Money monthly spent on food at other stores
Consumer Behavior - Money monthly spent on eating out
Consumer Behavior - Money monthly spent on carryout/delivered foods
Consumer Behavior - Income spent on food at supermarket/grocery store (%)
Consumer Behavior - Income spent on food at other stores (%)
Consumer Behavior - Income spent on eating out (%)
Consumer Behavior - Income spent on carryout/delivered foods (%)
Current Health Status - General health condition (%)
Current Health Status - Blood donors (%)
Current Health Status - Has blood ever tested for HIV virus (%)
Current Health Status - Left-handed people (%)
Dermatology - People using sunscreen (%)
Diabetes - Diabetics (%)
Diabetes - Had a blood test for high blood sugar (%)
Diabetes - People taking insulin (%)
Diet Behavior & Nutrition - Diet health (%)
Diet Behavior & Nutrition - Milk product consumption (# of products/month)
Diet Behavior & Nutrition - Meals not home prepared (#/week)
Diet Behavior & Nutrition - Meals from fast food or pizza place (#/week)
Diet Behavior & Nutrition - Ready-to-eat foods (#/month)
Diet Behavior & Nutrition - Frozen meals/pizza (#/month)
Drug Use - People that ever used marijuana or hashish (%)
Drug Use - Ever used hard drugs (%)
Drug Use - Ever used any form of cocaine (%)
Drug Use - Ever used heroin (%)
Drug Use - Ever used methamphetamine (%)
Health Insurance - People covered by health insurance (%)
Kidney Conditions-Urology - Avg. # of times urinating at night
Medical Conditions - People with asthma (%)
Medical Conditions - People with anemia (%)
Medical Conditions - People with psoriasis (%)
Medical Conditions - People with overweight (%)
Medical Conditions - Elderly people having difficulties in thinking or remembering (%)
Medical Conditions - People who ever received blood transfusion (%)
Medical Conditions - People having trouble seeing even with glass/contacts (%)
Medical Conditions - People with arthritis (%)
Medical Conditions - People with gout (%)
Medical Conditions - People with congestive heart failure (%)
Medical Conditions - People with coronary heart disease (%)
Medical Conditions - People with angina pectoris (%)
Medical Conditions - People who ever had heart attack (%)
Medical Conditions - People who ever had stroke (%)
Medical Conditions - People with emphysema (%)
Medical Conditions - People with thyroid problem (%)
Medical Conditions - People with chronic bronchitis (%)
Medical Conditions - People with any liver condition (%)
Medical Conditions - People who ever had cancer or malignancy (%)
Mental Health - People who have little interest in doing things (%)
Mental Health - People feeling down, depressed, or hopeless (%)
Mental Health - People who have trouble sleeping or sleeping too much (%)
Mental Health - People feeling tired or having little energy (%)
Mental Health - People with poor appetite or overeating (%)
Mental Health - People feeling bad about themself (%)
Mental Health - People who have trouble concentrating on things (%)
Mental Health - People moving or speaking slowly or too fast (%)
Mental Health - People having thoughts they would be better off dead (%)
Oral Health - Average years since last visit a dentist
Oral Health - People embarrassed because of mouth (%)
Oral Health - People with gum disease (%)
Oral Health - General health of teeth and gums (%)
Oral Health - Average days a week using dental floss/device
Oral Health - Average days a week using mouthwash for dental problem
Oral Health - Average number of teeth
Pesticide Use - Households using pesticides to control insects (%)
Pesticide Use - Households using pesticides to kill weeds (%)
Physical Activity - People doing vigorous-intensity work activities (%)
Physical Activity - People doing moderate-intensity work activities (%)
Physical Activity - People walking or bicycling (%)
Physical Activity - People doing vigorous-intensity recreational activities (%)
Physical Activity - People doing moderate-intensity recreational activities (%)
Physical Activity - Average hours a day doing sedentary activities
Physical Activity - Average hours a day watching TV or videos
Physical Activity - Average hours a day using computer
Physical Functioning - People having limitations keeping them from working (%)
Physical Functioning - People limited in amount of work they can do (%)
Physical Functioning - People that need special equipment to walk (%)
Physical Functioning - People experiencing confusion/memory problems (%)
Physical Functioning - People requiring special healthcare equipment (%)
Prescription Medications - Average number of prescription medicines taking
Preventive Aspirin Use - Adults 40+ taking low-dose aspirin (%)
Reproductive Health - Vaginal deliveries (%)
Reproductive Health - Cesarean deliveries (%)
Reproductive Health - Deliveries resulted in a live birth (%)
Reproductive Health - Pregnancies resulted in a delivery (%)
Reproductive Health - Women breastfeeding newborns (%)
Reproductive Health - Women that had a hysterectomy (%)
Reproductive Health - Women that had both ovaries removed (%)
Reproductive Health - Women that have ever taken birth control pills (%)
Reproductive Health - Women taking birth control pills (%)
Reproductive Health - Women that have ever used Depo-Provera or injectables (%)
Reproductive Health - Women that have ever used female hormones (%)
Sexual Behavior - People 18+ that ever had sex (vaginal, anal, or oral) (%)
Sexual Behavior - Males 18+ that ever had vaginal sex with a woman (%)
Sexual Behavior - Males 18+ that ever performed oral sex on a woman (%)
Sexual Behavior - Males 18+ that ever had anal sex with a woman (%)
Sexual Behavior - Males 18+ that ever had any sex with a man (%)
Sexual Behavior - Females 18+ that ever had vaginal sex with a man (%)
Sexual Behavior - Females 18+ that ever performed oral sex on a man (%)
Sexual Behavior - Females 18+ that ever had anal sex with a man (%)
Sexual Behavior - Females 18+ that ever had any kind of sex with a woman (%)
Sexual Behavior - Average age people first had sex
Sexual Behavior - Average number of female sex partners in lifetime (males 18+)
Sexual Behavior - Average number of female vaginal sex partners in lifetime (males 18+)
Sexual Behavior - Average age people first performed oral sex on a woman (18+)
Sexual Behavior - Average number of woman performed oral sex on in lifetime (18+)
Sexual Behavior - Average number of male sex partners in lifetime (males 18+)
Sexual Behavior - Average number of male anal sex partners in lifetime (males 18+)
Sexual Behavior - Average age people first performed oral sex on a man (18+)
Sexual Behavior - Average number of male oral sex partners in lifetime (18+)
Sexual Behavior - People using protection when performing oral sex (%)
Sexual Behavior - Average number of times people have vaginal or anal sex a year
Sexual Behavior - People having sex without condom (%)
Sexual Behavior - Average number of male sex partners in lifetime (females 18+)
Sexual Behavior - Average number of male vaginal sex partners in lifetime (females 18+)
Sexual Behavior - Average number of female sex partners in lifetime (females 18+)
Sexual Behavior - Circumcised males 18+ (%)
Sleep Disorders - Average hours sleeping at night
Sleep Disorders - People that has trouble sleeping (%)
Smoking-Cigarette Use - People smoking cigarettes (%)
Taste & Smell - People 40+ having problems with smell (%)
Taste & Smell - People 40+ having problems with taste (%)
Taste & Smell - People 40+ that ever had wisdom teeth removed (%)
Taste & Smell - People 40+ that ever had tonsils teeth removed (%)
Taste & Smell - People 40+ that ever had a loss of consciousness because of a head injury (%)
Taste & Smell - People 40+ that ever had a broken nose or other serious injury to face or skull (%)
Taste & Smell - People 40+ that ever had two or more sinus infections (%)
Weight - Average height (inches)
Weight - Average weight (pounds)
Weight - Average BMI
Weight - People that are obese (%)
Weight - People that ever were obese (%)
Weight - People trying to lose weight (%)
According to our research of Oregon and other state lists, there were 4 registered sex offenders living in Florence, Oregon as of April 26, 2024 . The ratio of all residents to sex offenders in Florence is 2,204 to 1.The ratio of registered sex offenders to all residents in this city is near the state average.
Officers per 1,000 residents here:
1.72Oregon average:
1.48
Latest news from Florence, OR collected exclusively by city-data.com from local newspapers, TV, and radio stations
Florence, OR City Guides: Ancestries: German (13.8%), American (12.7%), Irish (11.3%), English (11.2%), British (6.0%), Italian (4.3%).
Current Local Time:
Land area: 4.92 square miles.
Population density: 1,906 people per square mile (low).
845 residents are foreign born (3.4% Latin America , 2.1% Asia , 1.6% Europe , 1.2% Africa ).
This city:
9.0%Oregon:
9.8%
Median real estate property taxes paid for housing units with mortgages in 2022: $2,645 (0.7%)Median real estate property taxes paid for housing units with no mortgage in 2022: $2,292 (0.6%)
Nearest city with pop. 50,000+: Eugene, OR
Nearest city with pop. 200,000+: Northwest Clackamas, OR (121.9 miles
Nearest city with pop. 1,000,000+: Los Angeles, CA
Nearest cities:
Latitude: 43.98 N, Longitude: 124.10 W
Daytime population change due to commuting: +1,942 (+20.7%)Workers who live and work in this city: 2,361 (74.8%)
Florence tourist attractions:
Single-family new house construction building permits:
2022: 23 buildings , average cost: $338,5002021: 32 buildings , average cost: $277,0002020: 56 buildings , average cost: $216,5002019: 43 buildings , average cost: $221,7002018: 42 buildings , average cost: $215,7002017: 38 buildings , average cost: $221,1002016: 25 buildings , average cost: $205,2002015: 28 buildings , average cost: $194,3002014: 15 buildings , average cost: $223,0002013: 8 buildings , average cost: $202,5002012: 8 buildings , average cost: $238,2002011: 10 buildings , average cost: $213,0002010: 8 buildings , average cost: $233,2002009: 19 buildings , average cost: $175,6002008: 28 buildings , average cost: $189,2002007: 44 buildings , average cost: $184,5002006: 78 buildings , average cost: $188,1002005: 103 buildings , average cost: $157,2002004: 66 buildings , average cost: $169,4002003: 59 buildings , average cost: $165,2002002: 69 buildings , average cost: $150,5002001: 53 buildings , average cost: $141,8002000: 54 buildings , average cost: $145,1001999: 43 buildings , average cost: $127,7001998: 54 buildings , average cost: $122,2001997: 47 buildings , average cost: $123,700Unemployment in December 2023: Population change in the 1990s: +1,905 (+35.6%).
Most common occupations in Florence, OR (%)
Both Males Females
Building and grounds cleaning and maintenance occupations (5.6%)
Retail sales workers, except cashiers (5.3%)
Other food preparation and serving workers, including supervisors (4.3%)
Other management occupations, except farmers and farm managers (4.3%)
Waiters and waitresses (4.1%)
Health technologists and technicians (3.2%)
Supervisors and other personal care and service workers, except child care workers (3.2%)
Other management occupations, except farmers and farm managers (7.2%)
Driver/sales workers and truck drivers (5.4%)
Carpenters (4.7%)
Retail sales workers, except cashiers (4.5%)
Other food preparation and serving workers, including supervisors (4.2%)
Construction traders workers except carpenters, electricians, painters, plumbers, and construction laborers (4.2%)
Fishing, hunting, and forestry occupations (4.1%)
Building and grounds cleaning and maintenance occupations (7.2%)
Retail sales workers, except cashiers (6.0%)
Other office and administrative support workers, including supervisors (5.0%)
Secretaries and administrative assistants (5.0%)
Nursing, psychiatric, and home health aides (4.7%)
Other healthcare support occupations (4.7%)
Supervisors and other personal care and service workers, except child care workers (4.7%)
Air pollution and air quality trends(lower is better)
AQI PM2.5
Earthquake activity:
Florence-area historical earthquake activity is significantly above Oregon state average. It is 2184% greater than the overall U.S. average. On 1/31/1922 at 13:17:28, a magnitude 7.6 (7.6 UK, Class: Major, Intensity: VIII - XII) earthquake occurred 238.9 miles away from Florence center On 8/17/1991 at 22:17:14, a magnitude 7.1 (6.2 MB, 7.1 MS, 7.1 MW, 6.8 ML, Depth: 8.4 mi) earthquake occurred 172.0 miles away from Florence center On 11/8/1980 at 10:27:34, a magnitude 7.2 (6.2 MB, 7.2 MS, 7.2 MW, 7.0 ML) earthquake occurred 199.1 miles away from Florence center On 6/15/2005 at 02:50:54, a magnitude 7.2 (7.2 MW, Depth: 9.9 mi) earthquake occurred 208.6 miles away from Florence center On 6/15/2005 at 02:50:54, a magnitude 7.2 (6.1 MB, 7.1 MS, 7.2 MW, 7.1 MW) earthquake occurred 215.0 miles away from Florence center On 7/13/1991 at 02:50:14, a magnitude 6.9 (6.2 MB, 6.9 MS, 6.8 MW, 6.7 ML, Depth: 6.8 mi, Class: Strong, Intensity: VII - IX) earthquake occurred 149.0 miles away from the city center Magnitude types: body-wave magnitude (MB), local magnitude (ML), surface-wave magnitude (MS), moment magnitude (MW) Natural disasters: The number of natural disasters in Lane County (17) is near the US average (15).Major Disasters (Presidential) Declared: 13Emergencies Declared: 1Floods: 10, Winter Storms: 7, Storms: 6, Winds: 4, Landslides: 3, Mudslides: 3, Fire: 1, Heavy Rain: 1, Hurricane: 1, Snow: 1, Other: 1 (Note: some incidents may be assigned to more than one category). Hospitals and medical centers in Florence: PEACE HARBOR MEDICAL CENTER (Voluntary non-profit - Church, 400 9TH STREET) PEACE HARBOR HOME HEALTH SERVICES (310 NINTH STREET)
REGENCY FLORENCE (1951 E. 21ST STREET)
SIUSLAW CARE CENTER (1951 21 ST)
Amtrak station: FLORENCE (DOUBLE BARREL BREWERY SUPPLIES, HWY 101) - Bus Station
.
Services: public payphones.
Colleges/universities with over 2000 students nearest to Florence:
University of Oregon (about 52 miles; Eugene, OR ; Full-time enrollment: 23,329)
Lane Community College (about 54 miles; Eugene, OR ; FT enrollment: 6,373)
Oregon State University (about 58 miles; Corvallis, OR ; FT enrollment: 23,206)
Linn-Benton Community College (about 65 miles; Albany, OR ; FT enrollment: 4,511)
Western Oregon University (about 74 miles; Monmouth, OR ; FT enrollment: 5,131)
Willamette University (about 85 miles; Salem, OR ; FT enrollment: 2,551)
Chemeketa Community College (about 89 miles; Salem, OR ; FT enrollment: 10,746)
Public high schools in Florence:
Public elementary/middle schools in Florence:
See full list of schools located in Florence Library in Florence: SIUSLAW PUBLIC LIBRARY DISTRICT Operating income: $737,379; Location: 1460 9TH ST; 81,993 books ; 3,830 e-books ; 4,999 audio materials ; 5,340 video materials ; 7 local licensed databases ; 27 state licensed databases ; 1 other licensed databases ; 294 print serial subscriptions ; 1 electronic serial subscriptions )
User-submitted facts and corrections:
We no longer have a private school at Faith Fellowship Foursquare church. Sorry!
Notable locations in Florence: (A) , Florence Wastewater Treatment Facility (B) , Sandpines Golf Links (C) , Ocean Dunes Golf Links (D) , Florence City Dock and Ramp (E) , Bay Bridge Marina Boat Ramp (F) , Western Lane Ambulance District (G) , Siuslaw Valley Fire and Rescue Station 1 (H) , Siuslaw Valley Fire and Rescue Station 2 Old Town Station (I) , Siuslaw Pioneer Museum (J) , Florence Justice Center (K) , Florence Events Center (L) , Florence City Hall (M) , Central Coast Ranger District-Florence Office (N) , Florence Playhouse (O) , Florence Events Center (P) , Siuslaw Valley Fire and Rescue Station 7 Oak Street Station (Q) , Department of Motor Vehicles Florence (R) , Siuslaw Public Library Main Branch (S) , United States Coast Guard Station Siuslaw (T) . Display/hide their locations on the map
Church in Florence: (A) . Display/hide its location on the map
Cemetery: (1) . Display/hide its location on the map
Lake: (A) . Display/hide its location on the map
Creek: (A) . Display/hide its location on the map
Park in Florence: (1) . Display/hide its location on the map
Tourist attraction:
Hotels:
Court:
Birthplace of: Ben Voogd - College basketball player (LSU Tigers).
Lane County has a predicted average indoor radon screening level less than 2 pCi/L (pico curies per liter) - Low Potential Drinking water stations with addresses in Florence and their reported violations in the past:
FLORENCE, CITY OF (Population served: 8,426, Groundwater):
Past monitoring violations:
One minor monitoring violation
Population served: 1,800, Groundwater):
Past health violations:
MCL, Monthly (TCR) - In JAN-2008, Contaminant: Coliform. Follow-up actions: St Compliance achieved (FEB-27-2008)
Population served: 450, Surface water):
Past monitoring violations:
Monitoring, Turbidity (Enhanced SWTR) - In MAR-2014, Contaminant: IESWTR. Follow-up actions: St Compliance achieved (MAY-08-2014)
Monitoring of Treatment (SWTR-Filter) - In MAR-2014. Follow-up actions: St Compliance achieved (MAY-08-2014)
Monitoring of Treatment (SWTR-Filter) - In MAR-2014. Follow-up actions: St Compliance achieved (MAY-08-2014)
Monitoring of Treatment (SWTR-Filter) - In JUL-2013. Follow-up actions: St Compliance achieved (SEP-10-2013)
Monitoring, Turbidity (Enhanced SWTR) - In JUL-2013, Contaminant: IESWTR. Follow-up actions: St Compliance achieved (SEP-10-2013)
13 other older monitoring violations
Population served: 350, Surface water):
Past health violations:
MCL, Monthly (TCR) - In MAY-2010, Contaminant: Coliform. Follow-up actions: St Public Notif requested (2 times from JUN-14-2010 to JUN-14-2010), St Violation/Reminder Notice (JUN-21-2010), St Compliance achieved (2 times from JUL-28-2010 to JUL-28-2010)
Past monitoring violations:
Monitoring of Treatment (SWTR-Filter) - In MAR-2014. Follow-up actions: St Compliance achieved (MAY-08-2014)
Monitoring of Treatment (SWTR-Filter) - In MAR-2014. Follow-up actions: St Compliance achieved (MAY-08-2014)
Monitoring, Turbidity (Enhanced SWTR) - In MAR-2014, Contaminant: IESWTR. Follow-up actions: St Compliance achieved (MAY-08-2014)
Monitoring, Turbidity (Enhanced SWTR) - In MAY-2013, Contaminant: IESWTR. Follow-up actions: St Compliance achieved (JUL-09-2013)
Monitoring of Treatment (SWTR-Filter) - In MAY-2013. Follow-up actions: St Compliance achieved (JUL-09-2013)
2 minor monitoring violations
12 other older monitoring violations
Population served: 200, Groundwater):
Past health violations:
MCL, Acute (TCR) - In JUL-2011, Contaminant: Coliform. Follow-up actions: St Public Notif received (JUL-15-2011), St Public Notif requested (AUG-17-2011), St Violation/Reminder Notice (AUG-22-2011), St Compliance achieved (MAR-12-2013)
Past monitoring violations:
Monitoring, Repeat Major (TCR) - Between JAN-2014 and MAR-2014, Contaminant: Coliform (TCR). Follow-up actions: St Public Notif received (MAR-28-2014), St Public Notif requested (APR-14-2014)
Monitoring, Source Water (GWR) - In JUN-01-2011, Contaminant: E. COLI. Follow-up actions: St Compliance achieved (JUL-01-2011), St Violation/Reminder Notice (AUG-01-2011)
3 routine major monitoring violations
One minor monitoring violation
Population served: 75, Groundwater):
Past health violations:
MCL, Monthly (TCR) - Between APR-2007 and JUN-2007, Contaminant: Coliform. Follow-up actions: St Compliance achieved (AUG-06-2007)
Past monitoring violations:
Failure to Conduct Assessment Monitoring - Between JAN-2012 and DEC-2012, Contaminant: COLIPHAGE. Follow-up actions: St Violation/Reminder Notice (FEB-04-2013), St Compliance achieved (JUN-10-2013)
One routine major monitoring violation
One regular monitoring violation
Population served: 24, Groundwater):
Past monitoring violations:
Monitoring, Repeat Major (TCR) - In MAY-2010, Contaminant: Coliform (TCR). Follow-up actions: St Compliance achieved (APR-09-2010), St Public Notif requested (2 times from JUN-14-2010 to JUN-14-2010), St Violation/Reminder Notice (JUN-21-2010), St Public Notif received (AUG-25-2010)
One minor monitoring violation
Population served: 20, Groundwater):
Past health violations:
Treatment Technique (SWTR and GWR) - In DEC-2013, Contaminant: GROUNDWATER RULE. Follow-up actions: St Public Notif requested (JAN-27-2014), St Public Notif received (JAN-28-2014), St Compliance achieved (MAR-04-2014)
Past monitoring violations:
Monitoring of Treatment (SWTR-Unfilt/GWR) - In MAY-2014, Contaminant: GROUNDWATER RULE
Monitoring of Treatment (SWTR-Unfilt/GWR) - In JAN-2014, Contaminant: GROUNDWATER RULE. Follow-up actions: St Compliance achieved (MAR-04-2014)
Drinking water stations with addresses in Florence that have no violations reported:
HECETA WATER DISTRICT (Population served: 4,500, Primary Water Source Type: Surface water)
SEA LION CAVES (Population served: 350, Primary Water Source Type: Groundwater)
ST MARYS CATHOLIC CHURCH (Population served: 100, Primary Water Source Type: Groundwater)
WOAHINK LAKE RV PARK (Population served: 40, Primary Water Source Type: Groundwater)
OR YOUTH AUTHORITY - FLORENCE (Population served: 29, Primary Water Source Type: Groundwater)
Average household size: This city:
2.0 peopleOregon:
2.5 people
Percentage of family households: This city:
56.2%Whole state:
63.4%
Percentage of households with unmarried partners: This city:
7.1%Whole state:
8.0%
Likely homosexual households (counted as self-reported same-sex unmarried-partner households)
Lesbian couples: 0.5% of all households Gay men: 0.3% of all households
People in group quarters in Florence in 2010:
52 people in other noninstitutional facilities
38 people in nursing facilities/skilled-nursing facilities
19 people in group homes intended for adults
5 people in workers' group living quarters and job corps centers
3 people in emergency and transitional shelters (with sleeping facilities) for people experiencing homelessness
People in group quarters in Florence in 2000:
37 people in nursing homes
15 people in homes for the mentally retarded
4 people in other nonhousehold living situations
Banks with branches in Florence (2011 data):
Oregon Pacific Banking Company dba Oregon Pacific Bank: Safeway Branch, Oregon Pacific Banking Company Dba O, Mobile Branch. Info updated 2006/11/03: Bank assets: $174.0 mil, Deposits: $143.1 mil, local headquarters , positive income , Commercial Lending Specialization, 5 total offices , Holding Company: Oregon Pacific Bancorp
Sterling Savings Bank: Florence Branch at 430 Hwy 101, branch established on 1947/01/27. Info updated 2012/03/21: Bank assets: $9,207.8 mil, Deposits: $6,454.1 mil, headquarters in Spokane, WA, positive income , Commercial Lending Specialization, 192 total offices , Holding Company: Sterling Financial Corporation
Washington Federal: 620 Highway 101 Branch at 620 Highway 101, branch established on 1934/03/01. Info updated 2011/12/19: Bank assets: $13,653.0 mil, Deposits: $8,905.8 mil, headquarters in Seattle, WA, positive income , Mortgage Lending Specialization, 174 total offices
U.S. Bank National Association: Florence Branch at 2300 Highway 101 North, branch established on 1993/12/15. Info updated 2012/01/30: Bank assets: $330,470.8 mil, Deposits: $236,091.5 mil, headquarters in Cincinnati, OH, positive income , 3121 total offices , Holding Company: U.S. Bancorp
Siuslaw Bank: at 777 Highway 101, branch established on 1964/01/17. Info updated 2006/11/03: Bank assets: $318.0 mil, Deposits: $272.0 mil, local headquarters , positive income , Commercial Lending Specialization, 10 total offices , Holding Company: Siuslaw Financial Group, Inc.
For population 15 years and over in Florence:
Never married: 22.3%Now married: 47.0%Separated: 1.7%Widowed: 12.3%Divorced: 16.6% For population 25 years and over in Florence:
High school or higher: 89.7%Bachelor's degree or higher: 25.1%Graduate or professional degree: 9.4%Unemployed: 9.9%Mean travel time to work (commute): 9.8 minutes
Education Gini index (Inequality in education) Here:
10.6Oregon average:
11.6
Religion statistics for Florence, OR (based on Lane County data)
Religion Adherents Congregations Evangelical Protestant 34,051 216 Catholic 21,785 15 Other 19,303 72 Mainline Protestant 12,082 50 Black Protestant 295 2 Orthodox 240 2 None 263,959 -
Source: Clifford Grammich, Kirk Hadaway, Richard Houseal, Dale E.Jones, Alexei Krindatch, Richie Stanley and Richard H.Taylor. 2012. 2010 U.S.Religion Census: Religious Congregations & Membership Study. Association of Statisticians of American Religious Bodies. Jones, Dale E., et al. 2002. Congregations and Membership in the United States 2000. Nashville, TN: Glenmary Research Center. Graphs represent county-level data
Food Environment Statistics: Number of grocery stores : 67Lane County :
1.95 / 10,000 pop.State :
2.03 / 10,000 pop.
Number of supercenters and club stores : 15This county :
0.44 / 10,000 pop.Oregon :
0.33 / 10,000 pop.
Number of convenience stores (no gas) : 92This county :
2.68 / 10,000 pop.State :
2.01 / 10,000 pop.
Number of convenience stores (with gas) : 58Lane County :
1.69 / 10,000 pop.Oregon :
1.69 / 10,000 pop.
Number of full-service restaurants : 288This county :
8.40 / 10,000 pop.Oregon :
9.93 / 10,000 pop.
Adult diabetes rate : Lane County :
6.5%Oregon :
7.4%
Low-income preschool obesity rate : Lane County :
15.3%Oregon :
14.2%
Health and Nutrition: Healthy diet rate : Florence:
53.5%State:
49.6%
Average overall health of teeth and gums : Florence:
49.1%Oregon:
46.8%
People feeling badly about themselves : People not drinking alcohol at all : Florence:
11.0%State:
10.1%
Average hours sleeping at night : General health condition : Florence:
54.2%Oregon:
56.5%
Average condition of hearing : This city:
72.9%State:
78.7%
More about Health and Nutrition of Florence, OR Residents
Local government employment and payroll (March 2022)
Function
Full-time employees
Monthly full-time payroll
Average yearly full-time wage
Part-time employees
Monthly part-time payroll
Police Protection - Officers
16 $94,581 $70,936 0 $0 Other Government Administration
9 $61,774 $82,365 0 $0 Other and Unallocable
9 $46,907 $62,543 0 $0 Police - Other
8 $39,258 $58,887 0 $0 Sewerage
8 $45,489 $68,234 0 $0 Financial Administration
6 $31,459 $62,918 0 $0 Water Supply
5 $20,110 $48,264 0 $0 Parks and Recreation
3 $11,801 $47,204 0 $0 Judicial and Legal
2 $8,985 $53,910 0 $0 Correction
1 $5,387 $64,644 0 $0
Totals for Government
67 $365,751 $65,508 0 $0
Florence government finances - Expenditure in 2017 (per resident):
Construction - Sewerage: $2,138,000 ($228.03)
Air Transportation: $950,000 ($101.32)Water Utilities: $945,000 ($100.79)Police Protection: $495,000 ($52.79)Regular Highways: $384,000 ($40.96)Financial Administration: $201,000 ($21.44)Parks and Recreation: $68,000 ($7.25)Central Staff Services: $44,000 ($4.69)Current Operations - Police Protection: $2,802,000 ($298.85)
Central Staff Services: $1,420,000 ($151.45)Sewerage: $1,132,000 ($120.73)Water Utilities: $853,000 ($90.98)Parks and Recreation: $805,000 ($85.86)Financial Administration: $472,000 ($50.34)Regular Highways: $357,000 ($38.08)Judicial and Legal Services: $311,000 ($33.17)Air Transportation: $195,000 ($20.80)Protective Inspection and Regulation - Other: $123,000 ($13.12)Solid Waste Management: $63,000 ($6.72)Housing and Community Development: $16,000 ($1.71)General - Interest on Debt: $495,000 ($52.79)
Total Salaries and Wages: $3,401,000 ($362.73)
Water Utilities - Interest on Debt: $129,000 ($13.76)
Florence government finances - Revenue in 2017 (per resident):
Charges - Sewerage: $3,665,000 ($390.89)
Parks and Recreation: $354,000 ($37.76)Other: $239,000 ($25.49)Air Transportation: $136,000 ($14.51)Regular Highways: $109,000 ($11.63)Federal Intergovernmental - Air Transportation: $905,000 ($96.52)
Other: $85,000 ($9.07)Local Intergovernmental - Other: $297,000 ($31.68)
Highways: $11,000 ($1.17)General Local Government Support: $8,000 ($0.85)Miscellaneous - Fines and Forfeits: $363,000 ($38.72)
Rents: $189,000 ($20.16)Special Assessments: $88,000 ($9.39)Interest Earnings: $87,000 ($9.28)Donations From Private Sources: $59,000 ($6.29)General Revenue - Other: $42,000 ($4.48)Revenue - Water Utilities: $2,274,000 ($242.53)
State Intergovernmental - Highways: $588,000 ($62.71)
Water Utilities: $518,000 ($55.25)General Local Government Support: $186,000 ($19.84)Sewerage: $100,000 ($10.67)Other: $92,000 ($9.81)Tax - Property: $3,270,000 ($348.76)
Public Utilities Sales: $598,000 ($63.78)Other License: $520,000 ($55.46)Other Selective Sales: $298,000 ($31.78)Occupation and Business License - Other: $108,000 ($11.52)
Florence government finances - Debt in 2017 (per resident):
Long Term Debt - Beginning Outstanding - Unspecified Public Purpose: $21,327,000 ($2274.64)
Outstanding Unspecified Public Purpose: $19,379,000 ($2066.87)Retired Unspecified Public Purpose: $1,948,000 ($207.76)
Florence government finances - Cash and Securities in 2017 (per resident):
Other Funds - Cash and Securities: $7,390,000 ($788.18)
Sinking Funds - Cash and Securities: $373,000 ($39.78)
Businesses in Florence, OR
Name Count Name Count
7-Eleven 1 McDonald's 1 Best Western 1 Pizza Hut 1 Comfort Inn 1 Rite Aid 1 Dairy Queen 1 SAS Shoes 1 FedEx 3 Sears 1 Ford 1 Starbucks 1 GNC 1 Subway 2 H&R Block 1 Taco Bell 1 KFC 1 True Value 1 Kroger 2 U-Haul 1 La-Z-Boy 1 UPS 3 Lane Furniture 1 Vons 1 MasterBrand Cabinets 1
Strongest AM radio stations in Florence:
KCST (1250 AM; 1 kW; FLORENCE, OR; Owner: COAST BROADCASTING COMPANY)
KDUN (1030 AM; 50 kW; REEDSPORT, OR; Owner: PAMPLIN BROADCASTING-OREGON, INC.)
KPNW (1120 AM; 50 kW; EUGENE, OR; Owner: CAPSTAR TX LIMITED PARTNERSHIP)
KGRV (700 AM; 25 kW; WINSTON, OR; Owner: PACIFIC CASCADE COMMUNICATIONS CORP.)
KZTU (660 AM; 10 kW; JUNCTION CITY, OR; Owner: PAMPLIN BROADCASTING-OREGON, INC.)
KPOJ (620 AM; 50 kW; PORTLAND, OR; Owner: CITICASTERS LICENSES, L.P.)
KXL (750 AM; 50 kW; PORTLAND, OR; Owner: ROSE CITY RADIO CORPORATION)
KPAM (860 AM; 50 kW; TROUTDALE, OR; Owner: PAMPLIN BROADCASTING-OREGON, INC.)
KUGN (590 AM; 5 kW; EUGENE, OR; Owner: CUMULUS LICENSING CORP.)
KEX (1190 AM; 50 kW; PORTLAND, OR; Owner: CITICASTERS LICENSES, L.P.)
KOTK (1080 AM; 50 kW; PORTLAND, OR; Owner: FISHER BROADCASTING - PORTLAND RADIO, L.L.C.)
KWRO (630 AM; 5 kW; COQUILLE, OR; Owner: COQUILLE RIVER BROADCASTERS, INC.)
KKSN (1520 AM; 50 kW; OREGON CITY, OR; Owner: ENTERCOM PORTLAND LICENSE, LLC)
Strongest FM radio stations in Florence:
KWVZ (91.5 FM; FLORENCE, OR; Owner: OREGON STATE BOARD OF HIGHER ED.)
K218CR (91.5 FM; FLORENCE, OR; Owner: FAMILY STATIONS, INC.)
KLFO (88.1 FM; FLORENCE, OR; Owner: LANE COMMUNITY COLLEGE)
KCST-FM (106.9 FM; FLORENCE, OR; Owner: COAST BROADCASTING CO., INC.)
KDUK-FM (104.7 FM; FLORENCE, OR; Owner: CAPSTAR TX LIMITED PARTNERSHIP)
KFLY (101.5 FM; CORVALLIS, OR; Owner: CITICASTERS LICENSES, L.P.)
K224AQ (92.7 FM; FLORENCE, OR; Owner: FAMILY STATIONS, INC)
K207BX (89.3 FM; EUGENE, OR; Owner: PENSACOLA CHRISTIAN COLLEGE, INC.)
KLOV-FM (89.3 FM; WINCHESTER, OR; Owner: EDUCATIONAL MEDIA FOUNDATION)
K269DH (101.7 FM; FLORENCE, ETC., OR; Owner: CAPSTAR TX LIMITED PARTNERSHIP)
K261BF (100.1 FM; BLACK BUTTE, ETC., OR; Owner: FAMILY STATIONS, INC.)
K203BT (88.5 FM; EUGENE, OR; Owner: CALVARY CHAPEL OF TWIN FALLS, INC.)
K202BQ (88.3 FM; FLORENCE, ETC., OR; Owner: STATE OF OREGON, ET AL)
K276IH (103.1 FM; FLORENCE, OR; Owner: RAIDER COMMUNICATIONS, INC.)
K214CI (90.7 FM; EUGENE, OR; Owner: EDUCATIONAL MEDIA FOUNDATION)
K207DQ (89.3 FM; FLORENCE, OR; Owner: CALVARY CHAPEL OF TWIN FALLS, INC.)
K281AH (104.1 FM; FLORENCE, OR; Owner: RAIDER COMMUNICATIONS, INC.)
K205DM (88.9 FM; GLIDE, OR; Owner: CALVARY CHAPEL OF TWIN FALLS, INC.)
KAVJ (101.1 FM; SUTHERLIN, OR; Owner: BROOKE COMMUNICATIONS, INC.)
KLFR (89.1 FM; REEDSPORT, OR; Owner: LANE COMMUNITY COLLEGE)
TV broadcast stations around Florence:
K56DL (Channel 56; FLORENCE, OR; Owner: WEST LANE TRANSLATOR, INC.)
K58CW (Channel 58; FLORENCE, OR; Owner: WEST LANE TRANSLATOR, INC.)
K60DQ (Channel 60; FLORENCE, OR; Owner: WEST LANE TRANSLATOR, INC.)
K52DO (Channel 52; FLORENCE, OR; Owner: WEST LANE TRANSLATOR, INC.)
K54DG (Channel 54; FLORENCE, OR; Owner: OREGON PUBLIC BROADCASTING)
K48GC (Channel 62; FLORENCE, OR; Owner: THREE ANGELS BROADCASTING NETWORK)
National Bridge Inventory (NBI) Statistics 16 Number of bridges377ft / 115m Total length $11,324,000 Total costs41,226 Total average daily traffic5,771 Total average daily truck traffic
New bridges - historical statistics
3 1930-1939 4 1960-1969 1 1970-1979 6 1980-1989 1 1990-1999 1 2000-2009
See full National Bridge Inventory statistics for Florence, OR
Home Mortgage Disclosure Act Aggregated Statistics For Year 2009(Based on 1 partial tract) A) FHA, FSA/RHS & VA B) Conventional C) Refinancings D) Home Improvement Loans F) Non-occupant Loans on G) Loans On Manufactured Number Average Value Number Average Value Number Average Value Number Average Value Number Average Value Number Average Value
LOANS ORIGINATED 6 $216,577 9 $157,284 36 $185,426 2 $47,225 8 $174,012 8 $132,276 APPLICATIONS APPROVED, NOT ACCEPTED 0 $0 1 $157,620 5 $238,054 0 $0 0 $0 1 $97,460 APPLICATIONS DENIED 2 $126,940 3 $103,677 19 $171,804 1 $136,260 3 $150,700 6 $90,992 APPLICATIONS WITHDRAWN 1 $98,060 2 $87,535 9 $174,966 0 $0 2 $125,585 2 $146,790 FILES CLOSED FOR INCOMPLETENESS 0 $0 0 $0 1 $202,140 0 $0 0 $0 0 $0
Aggregated Statistics For Year 2008(Based on 1 partial tract) A) FHA, FSA/RHS & VA B) Conventional C) Refinancings D) Home Improvement Loans E) Loans on Dwellings For 5+ Families F) Non-occupant Loans on G) Loans On Manufactured Number Average Value Number Average Value Number Average Value Number Average Value Number Average Value Number Average Value Number Average Value
LOANS ORIGINATED 3 $209,257 15 $220,567 20 $159,920 2 $124,680 1 $2,487,010 10 $196,302 8 $135,661 APPLICATIONS APPROVED, NOT ACCEPTED 1 $146,790 3 $115,407 4 $214,998 0 $0 0 $0 1 $257,790 2 $79,110 APPLICATIONS DENIED 2 $132,350 4 $141,000 16 $187,154 2 $82,720 0 $0 4 $185,820 8 $125,396 APPLICATIONS WITHDRAWN 0 $0 5 $188,782 5 $162,010 1 $74,000 0 $0 3 $142,077 2 $73,245 FILES CLOSED FOR INCOMPLETENESS 0 $0 1 $135,360 1 $133,250 0 $0 0 $0 1 $186,500 1 $49,930
Aggregated Statistics For Year 2007(Based on 1 partial tract) A) FHA, FSA/RHS & VA B) Conventional C) Refinancings D) Home Improvement Loans E) Loans on Dwellings For 5+ Families F) Non-occupant Loans on G) Loans On Manufactured Number Average Value Number Average Value Number Average Value Number Average Value Number Average Value Number Average Value Number Average Value
LOANS ORIGINATED 1 $126,340 29 $186,206 33 $218,125 4 $63,545 1 $395,250 17 $238,694 13 $110,810 APPLICATIONS APPROVED, NOT ACCEPTED 0 $0 5 $186,856 5 $149,438 0 $0 0 $0 3 $139,773 3 $101,770 APPLICATIONS DENIED 2 $263,800 7 $173,476 13 $166,967 3 $68,883 0 $0 5 $127,900 8 $104,378 APPLICATIONS WITHDRAWN 0 $0 4 $166,118 9 $210,894 0 $0 0 $0 2 $226,500 2 $77,155 FILES CLOSED FOR INCOMPLETENESS 0 $0 1 $212,060 2 $75,050 0 $0 0 $0 1 $70,090 0 $0
Aggregated Statistics For Year 2006(Based on 1 partial tract) A) FHA, FSA/RHS & VA B) Conventional C) Refinancings D) Home Improvement Loans E) Loans on Dwellings For 5+ Families F) Non-occupant Loans on G) Loans On Manufactured Number Average Value Number Average Value Number Average Value Number Average Value Number Average Value Number Average Value Number Average Value
LOANS ORIGINATED 1 $200,030 41 $193,708 35 $180,566 5 $54,986 1 $389,840 23 $201,745 12 $116,535 APPLICATIONS APPROVED, NOT ACCEPTED 0 $0 7 $179,234 6 $165,390 1 $10,530 0 $0 5 $152,264 1 $186,500 APPLICATIONS DENIED 0 $0 6 $178,425 17 $162,591 2 $41,660 0 $0 5 $152,866 6 $98,212 APPLICATIONS WITHDRAWN 0 $0 4 $230,412 7 $183,446 1 $16,240 0 $0 2 $277,340 3 $110,393 FILES CLOSED FOR INCOMPLETENESS 0 $0 2 $155,515 2 $141,675 0 $0 0 $0 1 $240,340 1 $52,940
Aggregated Statistics For Year 2005(Based on 1 partial tract) A) FHA, FSA/RHS & VA B) Conventional C) Refinancings D) Home Improvement Loans E) Loans on Dwellings For 5+ Families F) Non-occupant Loans on G) Loans On Manufactured Number Average Value Number Average Value Number Average Value Number Average Value Number Average Value Number Average Value Number Average Value
LOANS ORIGINATED 1 $126,040 42 $179,485 39 $146,243 5 $107,988 1 $216,580 23 $185,554 20 $103,430 APPLICATIONS APPROVED, NOT ACCEPTED 0 $0 5 $170,312 6 $126,737 1 $120,920 0 $0 2 $181,535 1 $115,210 APPLICATIONS DENIED 1 $78,210 10 $174,644 17 $137,395 3 $50,033 0 $0 5 $177,232 9 $101,069 APPLICATIONS WITHDRAWN 1 $65,570 2 $178,525 11 $178,785 2 $168,900 0 $0 1 $105,880 2 $97,310 FILES CLOSED FOR INCOMPLETENESS 0 $0 1 $94,750 3 $152,407 1 $67,980 0 $0 1 $70,690 1 $142,880
Aggregated Statistics For Year 2004(Based on 1 partial tract) A) FHA, FSA/RHS & VA B) Conventional C) Refinancings D) Home Improvement Loans E) Loans on Dwellings For 5+ Families F) Non-occupant Loans on G) Loans On Manufactured Number Average Value Number Average Value Number Average Value Number Average Value Number Average Value Number Average Value Number Average Value
LOANS ORIGINATED 2 $126,940 52 $140,902 37 $118,296 4 $48,278 1 $292,980 28 $131,331 17 $91,479 APPLICATIONS APPROVED, NOT ACCEPTED 0 $0 5 $128,322 5 $83,622 1 $15,040 0 $0 2 $136,865 3 $59,157 APPLICATIONS DENIED 1 $68,280 10 $126,276 14 $111,597 2 $54,745 0 $0 5 $119,116 9 $87,933 APPLICATIONS WITHDRAWN 0 $0 6 $130,247 10 $112,138 1 $12,630 0 $0 3 $100,067 4 $94,752 FILES CLOSED FOR INCOMPLETENESS 0 $0 3 $147,693 5 $125,734 0 $0 0 $0 1 $245,450 1 $123,330
Aggregated Statistics For Year 2003(Based on 1 partial tract) A) FHA, FSA/RHS & VA B) Conventional C) Refinancings D) Home Improvement Loans F) Non-occupant Loans on Number Average Value Number Average Value Number Average Value Number Average Value Number Average Value
LOANS ORIGINATED 2 $75,200 46 $109,472 70 $109,375 3 $32,387 23 $112,970 APPLICATIONS APPROVED, NOT ACCEPTED 0 $0 7 $97,503 9 $116,710 1 $36,400 4 $122,125 APPLICATIONS DENIED 0 $0 5 $98,602 14 $90,756 2 $26,620 2 $79,260 APPLICATIONS WITHDRAWN 1 $44,820 5 $102,452 15 $108,809 0 $0 3 $131,050 FILES CLOSED FOR INCOMPLETENESS 1 $73,700 2 $105,280 3 $98,763 0 $0 2 $89,790
Aggregated Statistics For Year 2002(Based on 1 partial tract) A) FHA, FSA/RHS & VA B) Conventional C) Refinancings D) Home Improvement Loans F) Non-occupant Loans on Number Average Value Number Average Value Number Average Value Number Average Value Number Average Value
LOANS ORIGINATED 1 $58,360 38 $116,789 54 $105,909 2 $20,605 19 $125,845 APPLICATIONS APPROVED, NOT ACCEPTED 0 $0 3 $109,693 9 $96,156 0 $0 2 $128,740 APPLICATIONS DENIED 0 $0 4 $89,412 11 $79,931 1 $15,040 2 $86,030 APPLICATIONS WITHDRAWN 0 $0 3 $317,543 16 $96,350 0 $0 1 $212,060 FILES CLOSED FOR INCOMPLETENESS 0 $0 1 $88,130 1 $165,740 0 $0 0 $0
Aggregated Statistics For Year 2001(Based on 1 partial tract) A) FHA, FSA/RHS & VA B) Conventional C) Refinancings D) Home Improvement Loans F) Non-occupant Loans on Number Average Value Number Average Value Number Average Value Number Average Value Number Average Value
LOANS ORIGINATED 2 $108,590 35 $93,489 45 $96,838 3 $25,667 14 $106,655 APPLICATIONS APPROVED, NOT ACCEPTED 0 $0 4 $112,048 3 $76,503 1 $40,310 1 $154,910 APPLICATIONS DENIED 1 $74,300 2 $76,705 14 $93,484 2 $25,870 1 $98,360 APPLICATIONS WITHDRAWN 0 $0 4 $90,540 10 $106,363 1 $600 1 $106,180 FILES CLOSED FOR INCOMPLETENESS 0 $0 1 $49,030 2 $105,430 0 $0 0 $0
Aggregated Statistics For Year 2000(Based on 1 partial tract) A) FHA, FSA/RHS & VA B) Conventional C) Refinancings D) Home Improvement Loans E) Loans on Dwellings For 5+ Families F) Non-occupant Loans on Number Average Value Number Average Value Number Average Value Number Average Value Number Average Value Number Average Value
LOANS ORIGINATED 2 $66,175 32 $89,338 13 $78,092 2 $25,265 1 $1,335,550 10 $78,569 APPLICATIONS APPROVED, NOT ACCEPTED 0 $0 2 $85,125 2 $100,465 1 $21,360 0 $0 0 $0 APPLICATIONS DENIED 2 $55,950 9 $81,182 10 $101,881 1 $11,430 0 $0 2 $102,725 APPLICATIONS WITHDRAWN 0 $0 5 $94,632 5 $98,000 0 $0 0 $0 2 $49,630 FILES CLOSED FOR INCOMPLETENESS 0 $0 1 $74,600 3 $109,090 0 $0 0 $0 1 $46,920
Aggregated Statistics For Year 1999(Based on 1 partial tract) A) FHA, FSA/RHS & VA B) Conventional C) Refinancings D) Home Improvement Loans F) Non-occupant Loans on Number Average Value Number Average Value Number Average Value Number Average Value Number Average Value
LOANS ORIGINATED 2 $116,040 27 $87,402 27 $81,359 7 $31,450 11 $91,171 APPLICATIONS APPROVED, NOT ACCEPTED 0 $0 2 $112,310 6 $93,020 1 $7,460 2 $88,895 APPLICATIONS DENIED 0 $0 6 $80,690 9 $86,540 2 $18,195 2 $101,720 APPLICATIONS WITHDRAWN 0 $0 3 $91,080 7 $84,590 0 $0 2 $86,955 FILES CLOSED FOR INCOMPLETENESS 0 $0 0 $0 4 $103,360 0 $0 1 $50,110
Detailed HMDA statistics for the following Tracts:
0007.04
Private Mortgage Insurance Companies Aggregated Statistics For Year 2009(Based on 1 partial tract) A) Conventional Number Average Value
LOANS ORIGINATED 1 $190,410 APPLICATIONS APPROVED, NOT ACCEPTED 0 $0 APPLICATIONS DENIED 1 $218,380 APPLICATIONS WITHDRAWN 1 $137,470 FILES CLOSED FOR INCOMPLETENESS 0 $0
Aggregated Statistics For Year 2008(Based on 1 partial tract) A) Conventional B) Refinancings C) Non-occupant Loans on Number Average Value Number Average Value Number Average Value
LOANS ORIGINATED 2 $284,705 0 $0 1 $188,000 APPLICATIONS APPROVED, NOT ACCEPTED 2 $152,055 1 $118,520 0 $0 APPLICATIONS DENIED 0 $0 0 $0 0 $0 APPLICATIONS WITHDRAWN 0 $0 0 $0 0 $0 FILES CLOSED FOR INCOMPLETENESS 0 $0 0 $0 0 $0
Aggregated Statistics For Year 2007(Based on 1 partial tract) A) Conventional B) Refinancings C) Non-occupant Loans on D) Loans On Manufactured Number Average Value Number Average Value Number Average Value Number Average Value
LOANS ORIGINATED 6 $199,932 2 $213,720 2 $178,375 2 $115,660 APPLICATIONS APPROVED, NOT ACCEPTED 0 $0 0 $0 0 $0 0 $0 APPLICATIONS DENIED 0 $0 0 $0 0 $0 0 $0 APPLICATIONS WITHDRAWN 0 $0 0 $0 0 $0 0 $0 FILES CLOSED FOR INCOMPLETENESS 0 $0 0 $0 0 $0 0 $0
Aggregated Statistics For Year 2006(Based on 1 partial tract) A) Conventional B) Refinancings C) Non-occupant Loans on Number Average Value Number Average Value Number Average Value
LOANS ORIGINATED 2 $217,330 1 $223,190 1 $265,610 APPLICATIONS APPROVED, NOT ACCEPTED 1 $165,440 0 $0 0 $0 APPLICATIONS DENIED 0 $0 0 $0 0 $0 APPLICATIONS WITHDRAWN 0 $0 0 $0 0 $0 FILES CLOSED FOR INCOMPLETENESS 0 $0 0 $0 0 $0
Aggregated Statistics For Year 2005(Based on 1 partial tract) A) Conventional B) Refinancings C) Non-occupant Loans on D) Loans On Manufactured Number Average Value Number Average Value Number Average Value Number Average Value
LOANS ORIGINATED 4 $181,232 1 $109,190 2 $194,770 1 $93,850 APPLICATIONS APPROVED, NOT ACCEPTED 1 $114,300 1 $138,970 0 $0 1 $70,690 APPLICATIONS DENIED 0 $0 0 $0 0 $0 0 $0 APPLICATIONS WITHDRAWN 0 $0 0 $0 0 $0 0 $0 FILES CLOSED FOR INCOMPLETENESS 0 $0 0 $0 0 $0 0 $0
Aggregated Statistics For Year 2004(Based on 1 partial tract) A) Conventional B) Refinancings C) Non-occupant Loans on D) Loans On Manufactured Number Average Value Number Average Value Number Average Value Number Average Value
LOANS ORIGINATED 5 $162,072 3 $121,923 2 $132,655 1 $55,950 APPLICATIONS APPROVED, NOT ACCEPTED 1 $68,280 0 $0 0 $0 0 $0 APPLICATIONS DENIED 0 $0 0 $0 0 $0 0 $0 APPLICATIONS WITHDRAWN 0 $0 0 $0 0 $0 0 $0 FILES CLOSED FOR INCOMPLETENESS 0 $0 0 $0 0 $0 0 $0
Aggregated Statistics For Year 2003(Based on 1 partial tract) A) Conventional B) Refinancings C) Non-occupant Loans on Number Average Value Number Average Value Number Average Value
LOANS ORIGINATED 6 $109,140 5 $125,254 2 $136,565 APPLICATIONS APPROVED, NOT ACCEPTED 3 $104,077 2 $100,015 1 $112,800 APPLICATIONS DENIED 0 $0 0 $0 0 $0 APPLICATIONS WITHDRAWN 0 $0 1 $120,920 0 $0 FILES CLOSED FOR INCOMPLETENESS 0 $0 0 $0 0 $0
Aggregated Statistics For Year 2002(Based on 1 partial tract) A) Conventional B) Refinancings C) Non-occupant Loans on Number Average Value Number Average Value Number Average Value
LOANS ORIGINATED 6 $114,455 4 $109,190 3 $110,093 APPLICATIONS APPROVED, NOT ACCEPTED 1 $69,790 0 $0 0 $0 APPLICATIONS DENIED 0 $0 1 $65,270 0 $0 APPLICATIONS WITHDRAWN 1 $172,660 1 $73,090 0 $0 FILES CLOSED FOR INCOMPLETENESS 0 $0 0 $0 0 $0
Aggregated Statistics For Year 2001(Based on 1 partial tract) A) Conventional B) Refinancings C) Non-occupant Loans on Number Average Value Number Average Value Number Average Value
LOANS ORIGINATED 6 $96,807 3 $84,423 2 $86,030 APPLICATIONS APPROVED, NOT ACCEPTED 1 $138,970 1 $65,270 0 $0 APPLICATIONS DENIED 0 $0 0 $0 0 $0 APPLICATIONS WITHDRAWN 0 $0 0 $0 0 $0 FILES CLOSED FOR INCOMPLETENESS 0 $0 0 $0 0 $0
Aggregated Statistics For Year 2000(Based on 1 partial tract) A) Conventional C) Non-occupant Loans on Number Average Value Number Average Value
LOANS ORIGINATED 6 $99,263 3 $70,187 APPLICATIONS APPROVED, NOT ACCEPTED 1 $118,520 1 $81,220 APPLICATIONS DENIED 1 $85,430 0 $0 APPLICATIONS WITHDRAWN 0 $0 0 $0 FILES CLOSED FOR INCOMPLETENESS 0 $0 0 $0
Aggregated Statistics For Year 1999(Based on 1 partial tract) A) Conventional B) Refinancings C) Non-occupant Loans on Number Average Value Number Average Value Number Average Value
LOANS ORIGINATED 5 $106,672 1 $160,490 1 $90,980 APPLICATIONS APPROVED, NOT ACCEPTED 0 $0 0 $0 0 $0 APPLICATIONS DENIED 0 $0 0 $0 0 $0 APPLICATIONS WITHDRAWN 1 $92,770 0 $0 1 $91,580 FILES CLOSED FOR INCOMPLETENESS 0 $0 0 $0 0 $0
Detailed PMIC statistics for the following Tracts:
0007.04
Fire-safe hotels and motels in Florence, Oregon:
Comfort Inn, 2475 Hwy 101, Florence, Oregon 97439 Phone: (541) 997-7797, Fax: (541) 997-7895
Best Western Pier Point Inn, 85625 Hwy 101, Florence, Oregon 97439 Phone: (541) 997-7171, Fax: (541) 997-3828
All 2 fire-safe hotels and motels in Florence, Oregon Florence compared to Oregon state average:
Hispanic race population percentage below state average. Median age significantly above state average. Length of stay since moving in above state average. House age below state average.
#59 on the list of "Top 101 cities with the most users submitting photos to our site per 10,000 residents (population 5,000+)"
#71 on the list of "Top 100 cities with oldest residents (pop. 5,000+)"
#75 on the list of "Top 101 cities with largest percentage of females in industries: retail trade (population 5,000+)"
#84 on the list of "Top 101 cities with largest percentage of males in occupations: personal care and service occupations (population 5,000+)"
#52 (97439) on the list of "Top 101 zip codes with the smallest percentage of returns reporting salary or wage in 2012 (pop 5,000+)"
#8 on the list of "Top 101 counties with the largest decrease in the number of infant deaths per 1000 residents 2000-2006 to 2007-2013 (pop. 50,000+)"
#11 on the list of "Top 101 counties with the lowest number of infant deaths per 1000 residents 2007-2013 (pop. 50,000+)"
#19 on the list of "Top 101 counties with the lowest Ozone (1-hour) air pollution readings in 2012 (ppm)"
#22 on the list of "Top 101 counties with highest percentage of residents voting for 3rd party candidates in the 2012 Presidential Election (pop. 50,000+)"
#54 on the list of "Top 101 counties with the highest percentage of residents that exercised in the past month"
Top Patent Applicants
Patrick Dickson (4)
Dain Silvola (2)
Robert Ernest Hadd (1)
Ronald E. Mills (1)
Raymond T. Hebert (1)
Ray Hebert (1)
Klaus H. Witte (1)
Eduerdo Osorio (1)
Rafael Miguel Garcia (1)
Kurt J. Windisch (1)
Total of 14 patent applications in 2008-2024.
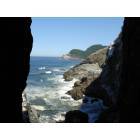

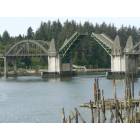
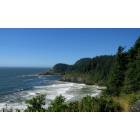
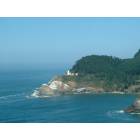

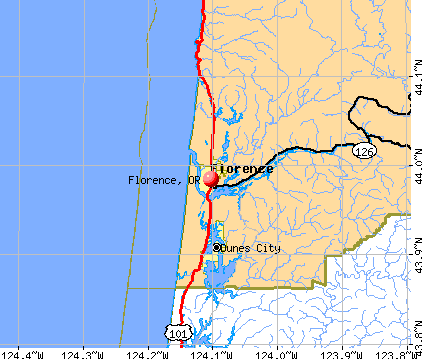


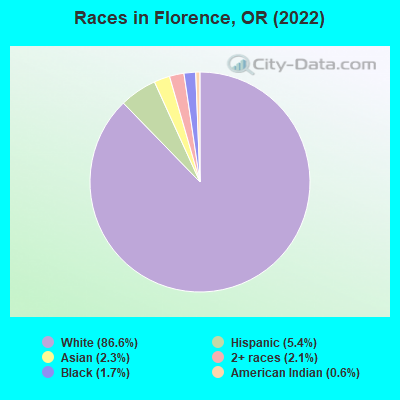
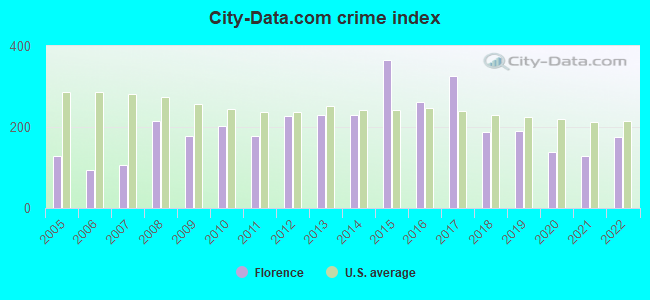
 Recent articles from our blog. Our writers, many of them Ph.D. graduates or candidates, create easy-to-read articles on a wide variety of topics.

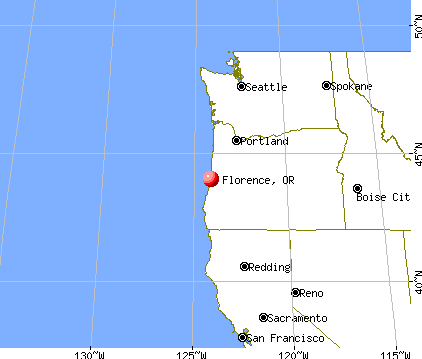
 (49.6 miles
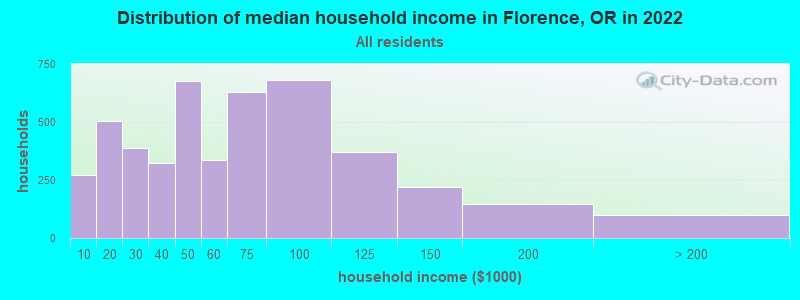
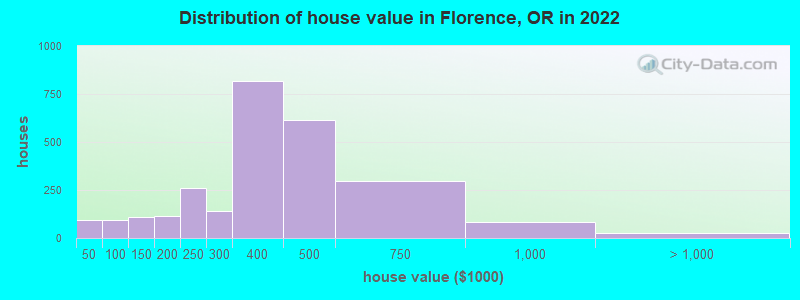

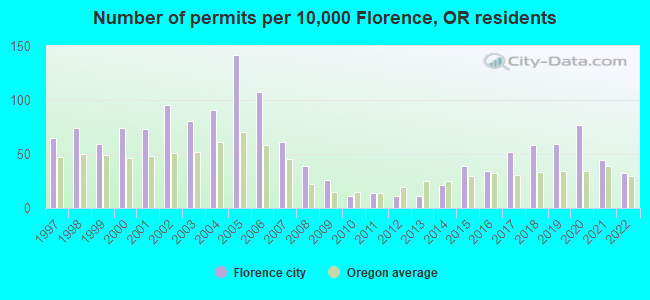
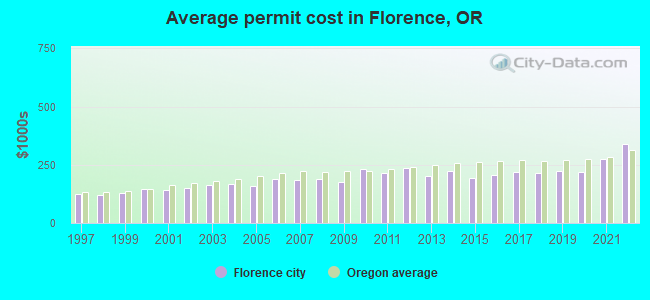
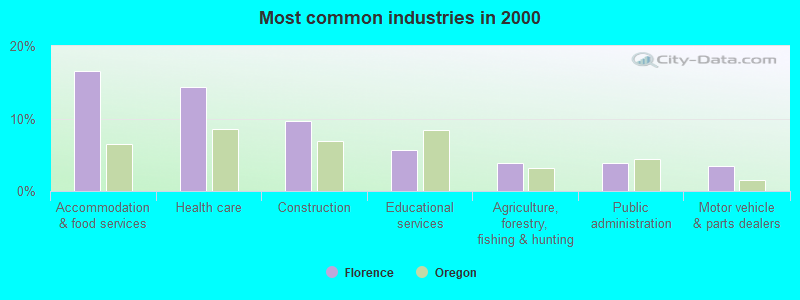

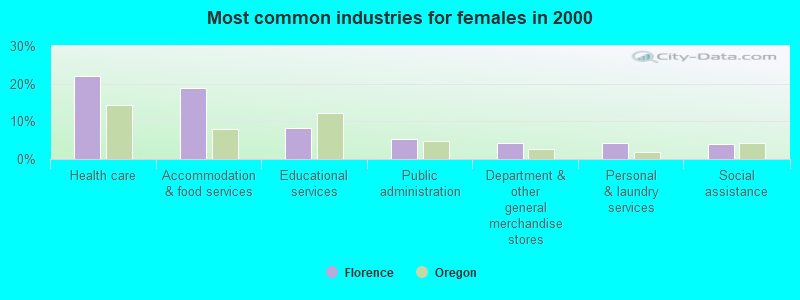
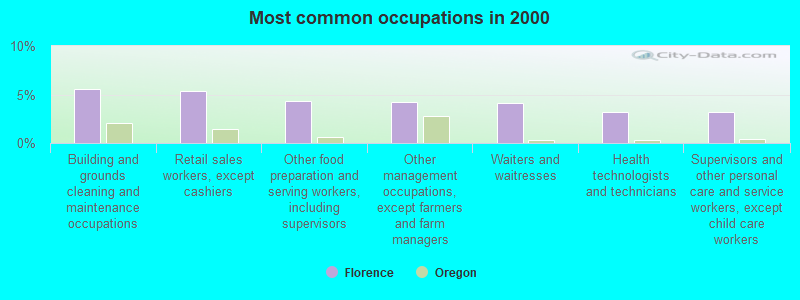
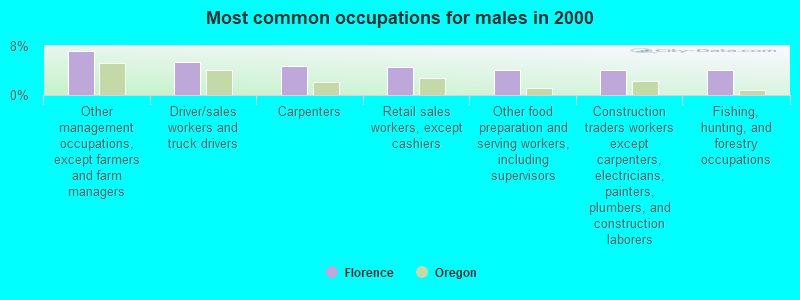
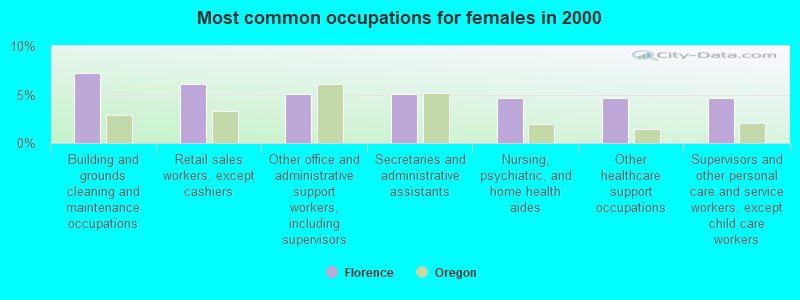
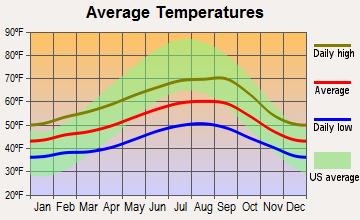
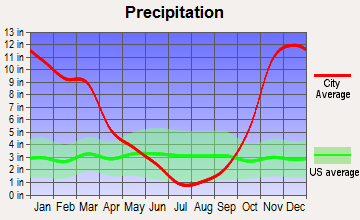
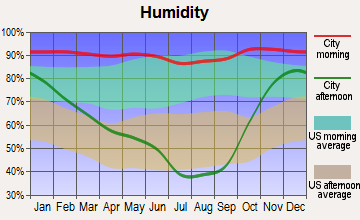
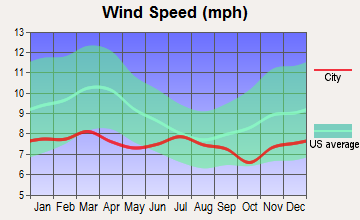
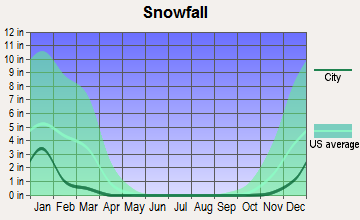

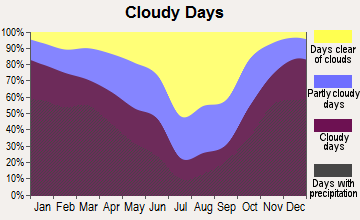
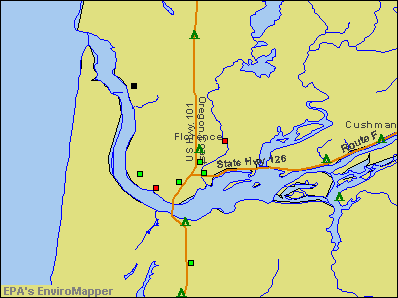

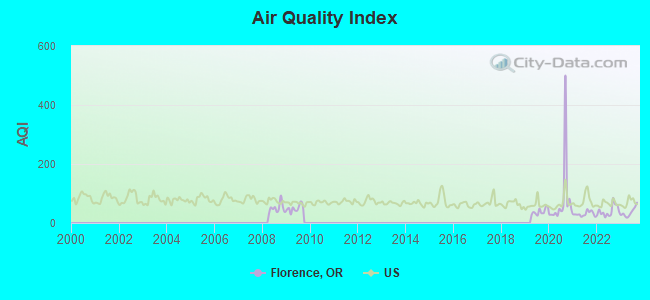
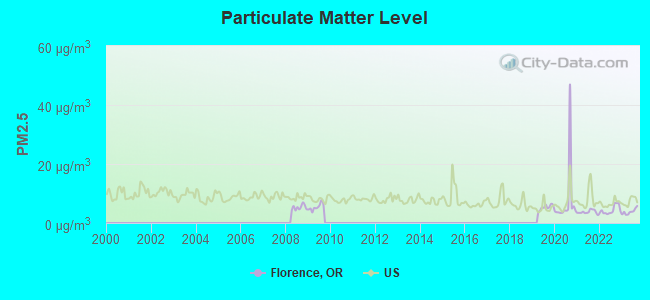
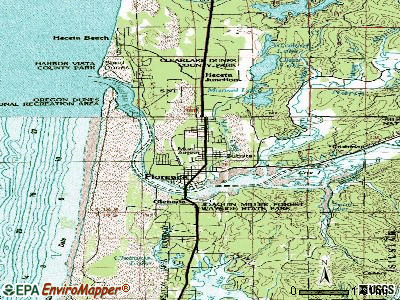
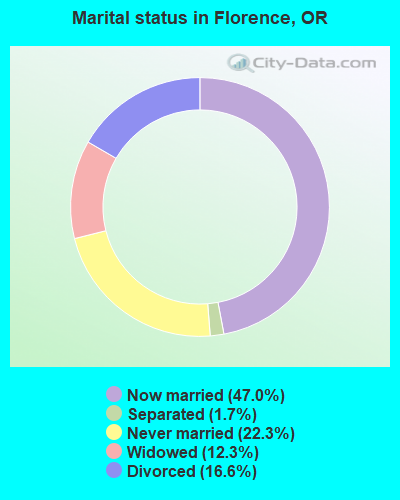
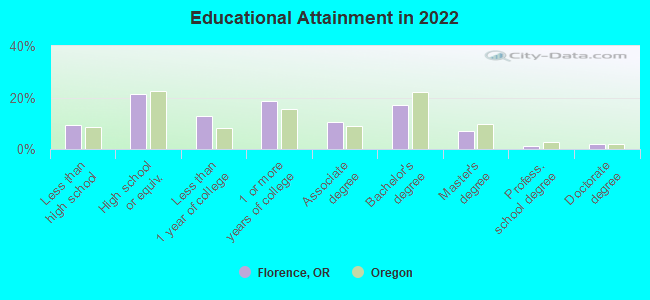
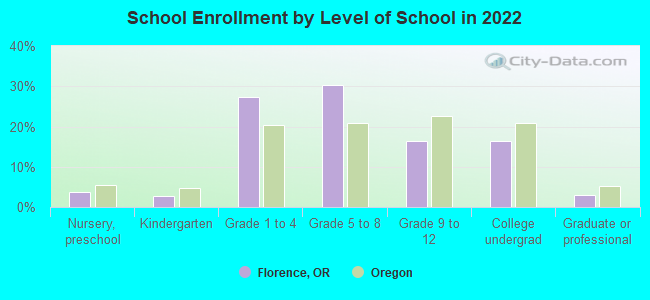
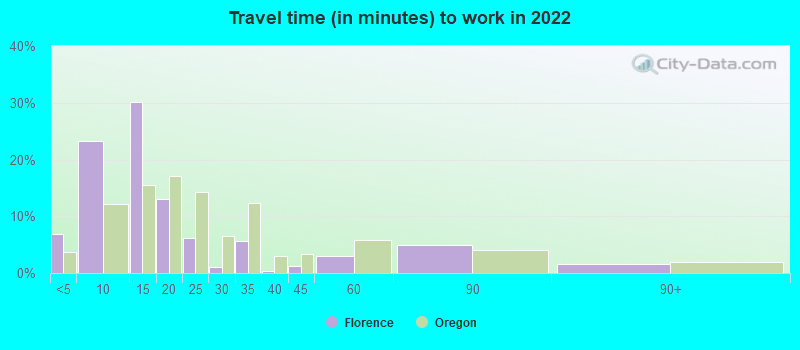
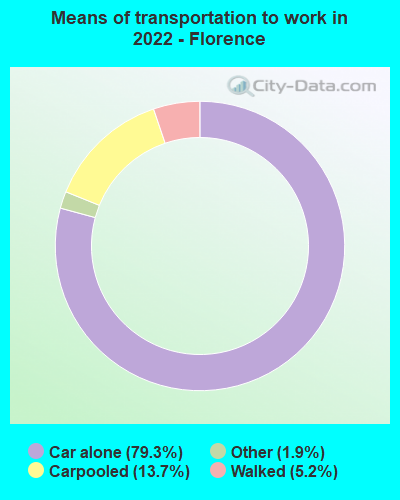
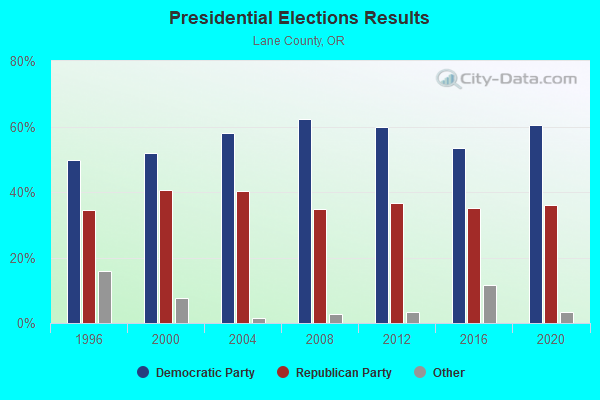
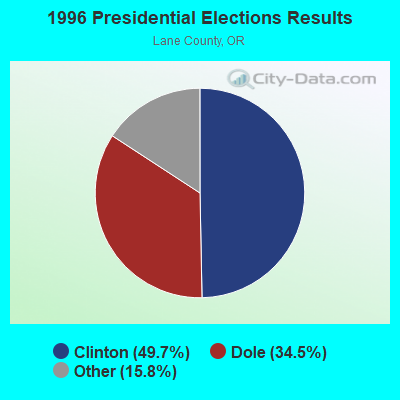
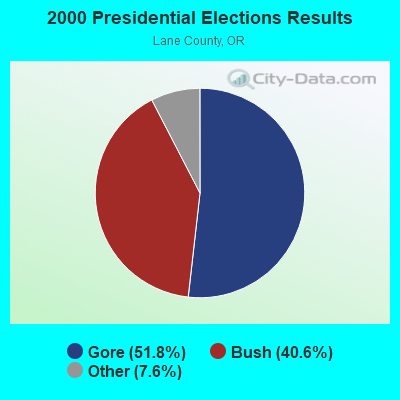
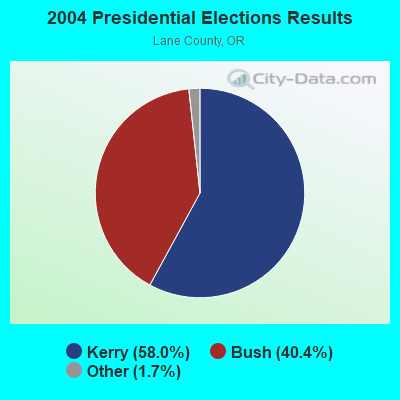
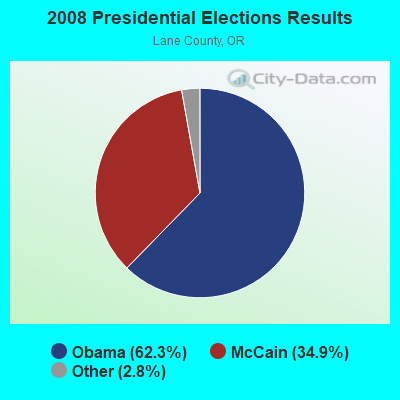
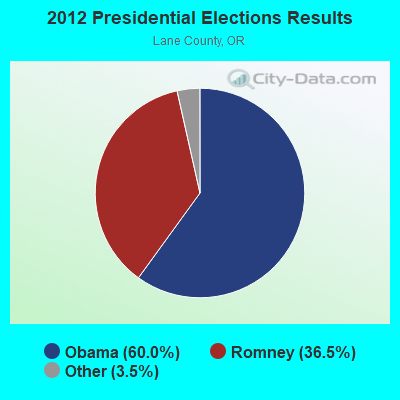
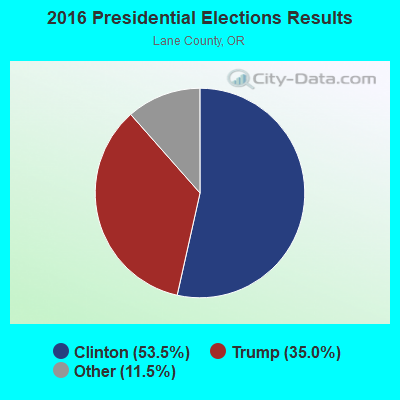
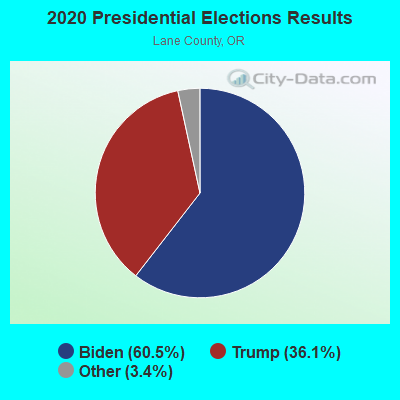
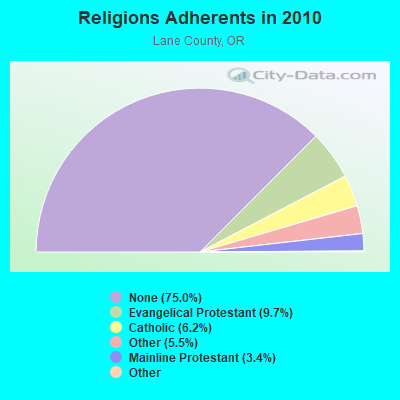
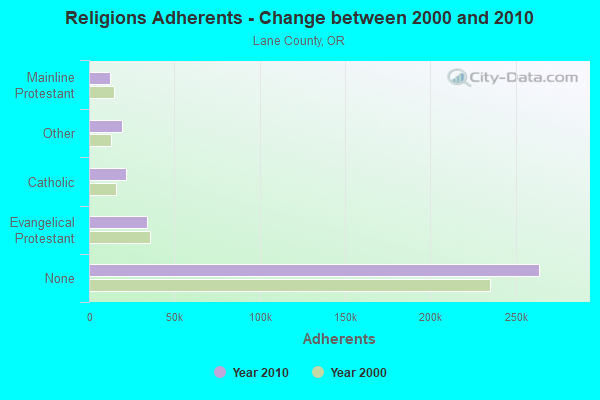
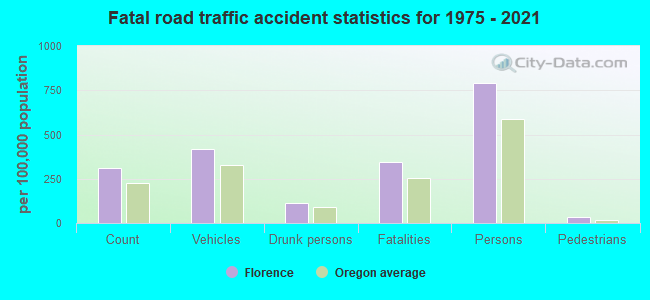
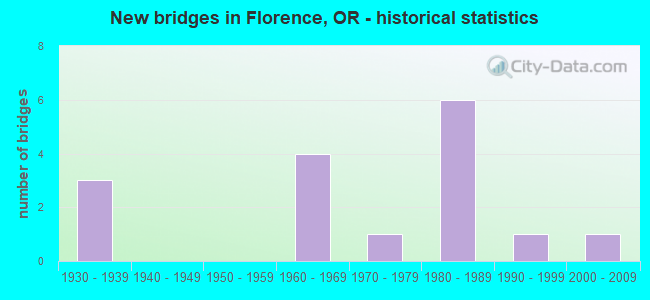
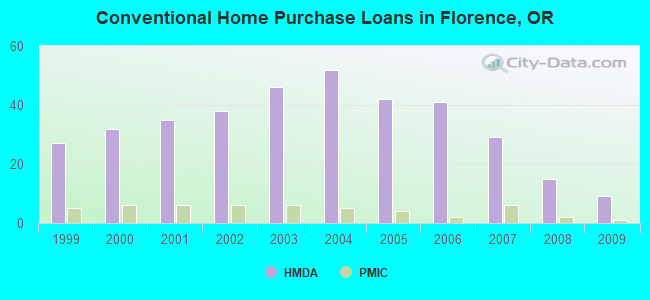
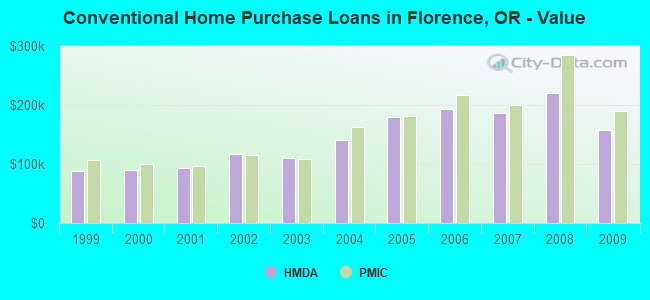
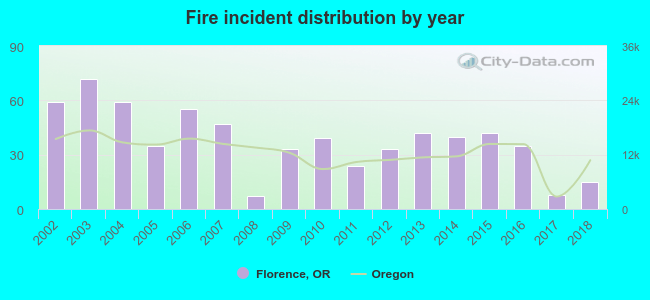 Based on the data from the years 2002 - 2018 the average number of fire incidents per year is 38. The highest number of reported fires - 72 took place in 2003, and the least - 7 in 2008. The data has a dropping trend.
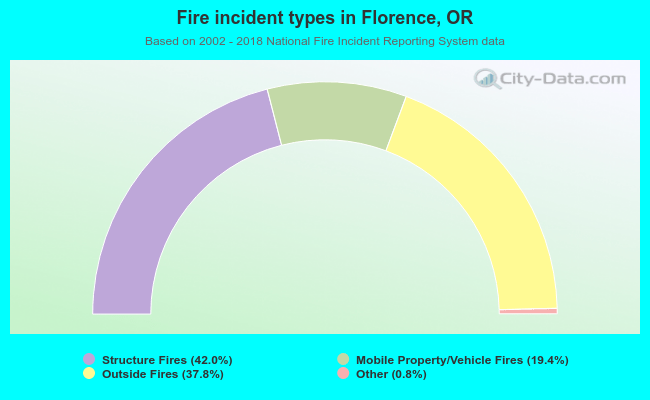 When looking into fire subcategories, the most incidents belonged to: Structure Fires (42.0%), and Outside Fires (37.8%).