Gladstone, Oregon Submit your own pictures of this city and show them to the world
OSM Map
General Map
Google Map
MSN Map
OSM Map
General Map
Google Map
MSN Map
OSM Map
General Map
Google Map
MSN Map
OSM Map
General Map
Google Map
MSN Map
Please wait while loading the map...
Population in 2022: 11,951 (100% urban, 0% rural). Population change since 2000: +4.5%Males: 6,172 Females: 5,779
March 2022 cost of living index in Gladstone: 104.1 (near average, U.S. average is 100) Percentage of residents living in poverty in 2022: 16.8%for White Non-Hispanic residents , 3.2% for Black residents , 50.6% for Hispanic or Latino residents , 51.6% for other race residents , 15.6% for two or more races residents )
Profiles of local businesses
Business Search - 14 Million verified businesses
Data:
Median household income ($)
Median household income (% change since 2000)
Household income diversity
Ratio of average income to average house value (%)
Ratio of average income to average rent
Median household income ($) - White
Median household income ($) - Black or African American
Median household income ($) - Asian
Median household income ($) - Hispanic or Latino
Median household income ($) - American Indian and Alaska Native
Median household income ($) - Multirace
Median household income ($) - Other Race
Median household income for houses/condos with a mortgage ($)
Median household income for apartments without a mortgage ($)
Races - White alone (%)
Races - White alone (% change since 2000)
Races - Black alone (%)
Races - Black alone (% change since 2000)
Races - American Indian alone (%)
Races - American Indian alone (% change since 2000)
Races - Asian alone (%)
Races - Asian alone (% change since 2000)
Races - Hispanic (%)
Races - Hispanic (% change since 2000)
Races - Native Hawaiian and Other Pacific Islander alone (%)
Races - Native Hawaiian and Other Pacific Islander alone (% change since 2000)
Races - Two or more races (%)
Races - Two or more races (% change since 2000)
Races - Other race alone (%)
Races - Other race alone (% change since 2000)
Racial diversity
Unemployment (%)
Unemployment (% change since 2000)
Unemployment (%) - White
Unemployment (%) - Black or African American
Unemployment (%) - Asian
Unemployment (%) - Hispanic or Latino
Unemployment (%) - American Indian and Alaska Native
Unemployment (%) - Multirace
Unemployment (%) - Other Race
Population density (people per square mile)
Population - Males (%)
Population - Females (%)
Population - Males (%) - White
Population - Males (%) - Black or African American
Population - Males (%) - Asian
Population - Males (%) - Hispanic or Latino
Population - Males (%) - American Indian and Alaska Native
Population - Males (%) - Multirace
Population - Males (%) - Other Race
Population - Females (%) - White
Population - Females (%) - Black or African American
Population - Females (%) - Asian
Population - Females (%) - Hispanic or Latino
Population - Females (%) - American Indian and Alaska Native
Population - Females (%) - Multirace
Population - Females (%) - Other Race
Coronavirus confirmed cases (Apr 28, 2024)
Deaths caused by coronavirus (Apr 28, 2024)
Coronavirus confirmed cases (per 100k population) (Apr 28, 2024)
Deaths caused by coronavirus (per 100k population) (Apr 28, 2024)
Daily increase in number of cases (Apr 28, 2024)
Weekly increase in number of cases (Apr 28, 2024)
Cases doubled (in days) (Apr 28, 2024)
Hospitalized patients (Apr 18, 2022)
Negative test results (Apr 18, 2022)
Total test results (Apr 18, 2022)
COVID Vaccine doses distributed (per 100k population) (Sep 19, 2023)
COVID Vaccine doses administered (per 100k population) (Sep 19, 2023)
COVID Vaccine doses distributed (Sep 19, 2023)
COVID Vaccine doses administered (Sep 19, 2023)
Likely homosexual households (%)
Likely homosexual households (% change since 2000)
Likely homosexual households - Lesbian couples (%)
Likely homosexual households - Lesbian couples (% change since 2000)
Likely homosexual households - Gay men (%)
Likely homosexual households - Gay men (% change since 2000)
Cost of living index
Median gross rent ($)
Median contract rent ($)
Median monthly housing costs ($)
Median house or condo value ($)
Median house or condo value ($ change since 2000)
Mean house or condo value by units in structure - 1, detached ($)
Mean house or condo value by units in structure - 1, attached ($)
Mean house or condo value by units in structure - 2 ($)
Mean house or condo value by units in structure by units in structure - 3 or 4 ($)
Mean house or condo value by units in structure - 5 or more ($)
Mean house or condo value by units in structure - Boat, RV, van, etc. ($)
Mean house or condo value by units in structure - Mobile home ($)
Median house or condo value ($) - White
Median house or condo value ($) - Black or African American
Median house or condo value ($) - Asian
Median house or condo value ($) - Hispanic or Latino
Median house or condo value ($) - American Indian and Alaska Native
Median house or condo value ($) - Multirace
Median house or condo value ($) - Other Race
Median resident age
Resident age diversity
Median resident age - Males
Median resident age - Females
Median resident age - White
Median resident age - Black or African American
Median resident age - Asian
Median resident age - Hispanic or Latino
Median resident age - American Indian and Alaska Native
Median resident age - Multirace
Median resident age - Other Race
Median resident age - Males - White
Median resident age - Males - Black or African American
Median resident age - Males - Asian
Median resident age - Males - Hispanic or Latino
Median resident age - Males - American Indian and Alaska Native
Median resident age - Males - Multirace
Median resident age - Males - Other Race
Median resident age - Females - White
Median resident age - Females - Black or African American
Median resident age - Females - Asian
Median resident age - Females - Hispanic or Latino
Median resident age - Females - American Indian and Alaska Native
Median resident age - Females - Multirace
Median resident age - Females - Other Race
Commute - mean travel time to work (minutes)
Travel time to work - Less than 5 minutes (%)
Travel time to work - Less than 5 minutes (% change since 2000)
Travel time to work - 5 to 9 minutes (%)
Travel time to work - 5 to 9 minutes (% change since 2000)
Travel time to work - 10 to 19 minutes (%)
Travel time to work - 10 to 19 minutes (% change since 2000)
Travel time to work - 20 to 29 minutes (%)
Travel time to work - 20 to 29 minutes (% change since 2000)
Travel time to work - 30 to 39 minutes (%)
Travel time to work - 30 to 39 minutes (% change since 2000)
Travel time to work - 40 to 59 minutes (%)
Travel time to work - 40 to 59 minutes (% change since 2000)
Travel time to work - 60 to 89 minutes (%)
Travel time to work - 60 to 89 minutes (% change since 2000)
Travel time to work - 90 or more minutes (%)
Travel time to work - 90 or more minutes (% change since 2000)
Marital status - Never married (%)
Marital status - Now married (%)
Marital status - Separated (%)
Marital status - Widowed (%)
Marital status - Divorced (%)
Median family income ($)
Median family income (% change since 2000)
Median non-family income ($)
Median non-family income (% change since 2000)
Median per capita income ($)
Median per capita income (% change since 2000)
Median family income ($) - White
Median family income ($) - Black or African American
Median family income ($) - Asian
Median family income ($) - Hispanic or Latino
Median family income ($) - American Indian and Alaska Native
Median family income ($) - Multirace
Median family income ($) - Other Race
Median year house/condo built
Median year apartment built
Year house built - Built 2005 or later (%)
Year house built - Built 2000 to 2004 (%)
Year house built - Built 1990 to 1999 (%)
Year house built - Built 1980 to 1989 (%)
Year house built - Built 1970 to 1979 (%)
Year house built - Built 1960 to 1969 (%)
Year house built - Built 1950 to 1959 (%)
Year house built - Built 1940 to 1949 (%)
Year house built - Built 1939 or earlier (%)
Average household size
Household density (households per square mile)
Average household size - White
Average household size - Black or African American
Average household size - Asian
Average household size - Hispanic or Latino
Average household size - American Indian and Alaska Native
Average household size - Multirace
Average household size - Other Race
Occupied housing units (%)
Vacant housing units (%)
Owner occupied housing units (%)
Renter occupied housing units (%)
Vacancy status - For rent (%)
Vacancy status - For sale only (%)
Vacancy status - Rented or sold, not occupied (%)
Vacancy status - For seasonal, recreational, or occasional use (%)
Vacancy status - For migrant workers (%)
Vacancy status - Other vacant (%)
Residents with income below the poverty level (%)
Residents with income below 50% of the poverty level (%)
Children below poverty level (%)
Poor families by family type - Married-couple family (%)
Poor families by family type - Male, no wife present (%)
Poor families by family type - Female, no husband present (%)
Poverty status for native-born residents (%)
Poverty status for foreign-born residents (%)
Poverty among high school graduates not in families (%)
Poverty among people who did not graduate high school not in families (%)
Residents with income below the poverty level (%) - White
Residents with income below the poverty level (%) - Black or African American
Residents with income below the poverty level (%) - Asian
Residents with income below the poverty level (%) - Hispanic or Latino
Residents with income below the poverty level (%) - American Indian and Alaska Native
Residents with income below the poverty level (%) - Multirace
Residents with income below the poverty level (%) - Other Race
Air pollution - Air Quality Index (AQI)
Air pollution - CO
Air pollution - NO2
Air pollution - SO2
Air pollution - Ozone
Air pollution - PM10
Air pollution - PM25
Air pollution - Pb
Crime - Murders per 100,000 population
Crime - Rapes per 100,000 population
Crime - Robberies per 100,000 population
Crime - Assaults per 100,000 population
Crime - Burglaries per 100,000 population
Crime - Thefts per 100,000 population
Crime - Auto thefts per 100,000 population
Crime - Arson per 100,000 population
Crime - City-data.com crime index
Crime - Violent crime index
Crime - Property crime index
Crime - Murders per 100,000 population (5 year average)
Crime - Rapes per 100,000 population (5 year average)
Crime - Robberies per 100,000 population (5 year average)
Crime - Assaults per 100,000 population (5 year average)
Crime - Burglaries per 100,000 population (5 year average)
Crime - Thefts per 100,000 population (5 year average)
Crime - Auto thefts per 100,000 population (5 year average)
Crime - Arson per 100,000 population (5 year average)
Crime - City-data.com crime index (5 year average)
Crime - Violent crime index (5 year average)
Crime - Property crime index (5 year average)
1996 Presidential Elections Results (%) - Democratic Party (Clinton)
1996 Presidential Elections Results (%) - Republican Party (Dole)
1996 Presidential Elections Results (%) - Other
2000 Presidential Elections Results (%) - Democratic Party (Gore)
2000 Presidential Elections Results (%) - Republican Party (Bush)
2000 Presidential Elections Results (%) - Other
2004 Presidential Elections Results (%) - Democratic Party (Kerry)
2004 Presidential Elections Results (%) - Republican Party (Bush)
2004 Presidential Elections Results (%) - Other
2008 Presidential Elections Results (%) - Democratic Party (Obama)
2008 Presidential Elections Results (%) - Republican Party (McCain)
2008 Presidential Elections Results (%) - Other
2012 Presidential Elections Results (%) - Democratic Party (Obama)
2012 Presidential Elections Results (%) - Republican Party (Romney)
2012 Presidential Elections Results (%) - Other
2016 Presidential Elections Results (%) - Democratic Party (Clinton)
2016 Presidential Elections Results (%) - Republican Party (Trump)
2016 Presidential Elections Results (%) - Other
2020 Presidential Elections Results (%) - Democratic Party (Biden)
2020 Presidential Elections Results (%) - Republican Party (Trump)
2020 Presidential Elections Results (%) - Other
Ancestries Reported - Arab (%)
Ancestries Reported - Czech (%)
Ancestries Reported - Danish (%)
Ancestries Reported - Dutch (%)
Ancestries Reported - English (%)
Ancestries Reported - French (%)
Ancestries Reported - French Canadian (%)
Ancestries Reported - German (%)
Ancestries Reported - Greek (%)
Ancestries Reported - Hungarian (%)
Ancestries Reported - Irish (%)
Ancestries Reported - Italian (%)
Ancestries Reported - Lithuanian (%)
Ancestries Reported - Norwegian (%)
Ancestries Reported - Polish (%)
Ancestries Reported - Portuguese (%)
Ancestries Reported - Russian (%)
Ancestries Reported - Scotch-Irish (%)
Ancestries Reported - Scottish (%)
Ancestries Reported - Slovak (%)
Ancestries Reported - Subsaharan African (%)
Ancestries Reported - Swedish (%)
Ancestries Reported - Swiss (%)
Ancestries Reported - Ukrainian (%)
Ancestries Reported - United States (%)
Ancestries Reported - Welsh (%)
Ancestries Reported - West Indian (%)
Ancestries Reported - Other (%)
Educational Attainment - No schooling completed (%)
Educational Attainment - Less than high school (%)
Educational Attainment - High school or equivalent (%)
Educational Attainment - Less than 1 year of college (%)
Educational Attainment - 1 or more years of college (%)
Educational Attainment - Associate degree (%)
Educational Attainment - Bachelor's degree (%)
Educational Attainment - Master's degree (%)
Educational Attainment - Professional school degree (%)
Educational Attainment - Doctorate degree (%)
School Enrollment - Nursery, preschool (%)
School Enrollment - Kindergarten (%)
School Enrollment - Grade 1 to 4 (%)
School Enrollment - Grade 5 to 8 (%)
School Enrollment - Grade 9 to 12 (%)
School Enrollment - College undergrad (%)
School Enrollment - Graduate or professional (%)
School Enrollment - Not enrolled in school (%)
School enrollment - Public schools (%)
School enrollment - Private schools (%)
School enrollment - Not enrolled (%)
Median number of rooms in houses and condos
Median number of rooms in apartments
Housing units lacking complete plumbing facilities (%)
Housing units lacking complete kitchen facilities (%)
Density of houses
Urban houses (%)
Rural houses (%)
Households with people 60 years and over (%)
Households with people 65 years and over (%)
Households with people 75 years and over (%)
Households with one or more nonrelatives (%)
Households with no nonrelatives (%)
Population in households (%)
Family households (%)
Nonfamily households (%)
Population in families (%)
Family households with own children (%)
Median number of bedrooms in owner occupied houses
Mean number of bedrooms in owner occupied houses
Median number of bedrooms in renter occupied houses
Mean number of bedrooms in renter occupied houses
Median number of vehichles in owner occupied houses
Mean number of vehichles in owner occupied houses
Median number of vehichles in renter occupied houses
Mean number of vehichles in renter occupied houses
Mortgage status - with mortgage (%)
Mortgage status - with second mortgage (%)
Mortgage status - with home equity loan (%)
Mortgage status - with both second mortgage and home equity loan (%)
Mortgage status - without a mortgage (%)
Average family size
Average family size - White
Average family size - Black or African American
Average family size - Asian
Average family size - Hispanic or Latino
Average family size - American Indian and Alaska Native
Average family size - Multirace
Average family size - Other Race
Geographical mobility - Same house 1 year ago (%)
Geographical mobility - Moved within same county (%)
Geographical mobility - Moved from different county within same state (%)
Geographical mobility - Moved from different state (%)
Geographical mobility - Moved from abroad (%)
Place of birth - Born in state of residence (%)
Place of birth - Born in other state (%)
Place of birth - Native, outside of US (%)
Place of birth - Foreign born (%)
Housing units in structures - 1, detached (%)
Housing units in structures - 1, attached (%)
Housing units in structures - 2 (%)
Housing units in structures - 3 or 4 (%)
Housing units in structures - 5 to 9 (%)
Housing units in structures - 10 to 19 (%)
Housing units in structures - 20 to 49 (%)
Housing units in structures - 50 or more (%)
Housing units in structures - Mobile home (%)
Housing units in structures - Boat, RV, van, etc. (%)
House/condo owner moved in on average (years ago)
Renter moved in on average (years ago)
Year householder moved into unit - Moved in 1999 to March 2000 (%)
Year householder moved into unit - Moved in 1995 to 1998 (%)
Year householder moved into unit - Moved in 1990 to 1994 (%)
Year householder moved into unit - Moved in 1980 to 1989 (%)
Year householder moved into unit - Moved in 1970 to 1979 (%)
Year householder moved into unit - Moved in 1969 or earlier (%)
Means of transportation to work - Drove car alone (%)
Means of transportation to work - Carpooled (%)
Means of transportation to work - Public transportation (%)
Means of transportation to work - Bus or trolley bus (%)
Means of transportation to work - Streetcar or trolley car (%)
Means of transportation to work - Subway or elevated (%)
Means of transportation to work - Railroad (%)
Means of transportation to work - Ferryboat (%)
Means of transportation to work - Taxicab (%)
Means of transportation to work - Motorcycle (%)
Means of transportation to work - Bicycle (%)
Means of transportation to work - Walked (%)
Means of transportation to work - Other means (%)
Working at home (%)
Industry diversity
Most Common Industries - Agriculture, forestry, fishing and hunting, and mining (%)
Most Common Industries - Agriculture, forestry, fishing and hunting (%)
Most Common Industries - Mining, quarrying, and oil and gas extraction (%)
Most Common Industries - Construction (%)
Most Common Industries - Manufacturing (%)
Most Common Industries - Wholesale trade (%)
Most Common Industries - Retail trade (%)
Most Common Industries - Transportation and warehousing, and utilities (%)
Most Common Industries - Transportation and warehousing (%)
Most Common Industries - Utilities (%)
Most Common Industries - Information (%)
Most Common Industries - Finance and insurance, and real estate and rental and leasing (%)
Most Common Industries - Finance and insurance (%)
Most Common Industries - Real estate and rental and leasing (%)
Most Common Industries - Professional, scientific, and management, and administrative and waste management services (%)
Most Common Industries - Professional, scientific, and technical services (%)
Most Common Industries - Management of companies and enterprises (%)
Most Common Industries - Administrative and support and waste management services (%)
Most Common Industries - Educational services, and health care and social assistance (%)
Most Common Industries - Educational services (%)
Most Common Industries - Health care and social assistance (%)
Most Common Industries - Arts, entertainment, and recreation, and accommodation and food services (%)
Most Common Industries - Arts, entertainment, and recreation (%)
Most Common Industries - Accommodation and food services (%)
Most Common Industries - Other services, except public administration (%)
Most Common Industries - Public administration (%)
Occupation diversity
Most Common Occupations - Management, business, science, and arts occupations (%)
Most Common Occupations - Management, business, and financial occupations (%)
Most Common Occupations - Management occupations (%)
Most Common Occupations - Business and financial operations occupations (%)
Most Common Occupations - Computer, engineering, and science occupations (%)
Most Common Occupations - Computer and mathematical occupations (%)
Most Common Occupations - Architecture and engineering occupations (%)
Most Common Occupations - Life, physical, and social science occupations (%)
Most Common Occupations - Education, legal, community service, arts, and media occupations (%)
Most Common Occupations - Community and social service occupations (%)
Most Common Occupations - Legal occupations (%)
Most Common Occupations - Education, training, and library occupations (%)
Most Common Occupations - Arts, design, entertainment, sports, and media occupations (%)
Most Common Occupations - Healthcare practitioners and technical occupations (%)
Most Common Occupations - Health diagnosing and treating practitioners and other technical occupations (%)
Most Common Occupations - Health technologists and technicians (%)
Most Common Occupations - Service occupations (%)
Most Common Occupations - Healthcare support occupations (%)
Most Common Occupations - Protective service occupations (%)
Most Common Occupations - Fire fighting and prevention, and other protective service workers including supervisors (%)
Most Common Occupations - Law enforcement workers including supervisors (%)
Most Common Occupations - Food preparation and serving related occupations (%)
Most Common Occupations - Building and grounds cleaning and maintenance occupations (%)
Most Common Occupations - Personal care and service occupations (%)
Most Common Occupations - Sales and office occupations (%)
Most Common Occupations - Sales and related occupations (%)
Most Common Occupations - Office and administrative support occupations (%)
Most Common Occupations - Natural resources, construction, and maintenance occupations (%)
Most Common Occupations - Farming, fishing, and forestry occupations (%)
Most Common Occupations - Construction and extraction occupations (%)
Most Common Occupations - Installation, maintenance, and repair occupations (%)
Most Common Occupations - Production, transportation, and material moving occupations (%)
Most Common Occupations - Production occupations (%)
Most Common Occupations - Transportation occupations (%)
Most Common Occupations - Material moving occupations (%)
People in Group quarters - Institutionalized population (%)
People in Group quarters - Correctional institutions (%)
People in Group quarters - Federal prisons and detention centers (%)
People in Group quarters - Halfway houses (%)
People in Group quarters - Local jails and other confinement facilities (including police lockups) (%)
People in Group quarters - Military disciplinary barracks (%)
People in Group quarters - State prisons (%)
People in Group quarters - Other types of correctional institutions (%)
People in Group quarters - Nursing homes (%)
People in Group quarters - Hospitals/wards, hospices, and schools for the handicapped (%)
People in Group quarters - Hospitals/wards and hospices for chronically ill (%)
People in Group quarters - Hospices or homes for chronically ill (%)
People in Group quarters - Military hospitals or wards for chronically ill (%)
People in Group quarters - Other hospitals or wards for chronically ill (%)
People in Group quarters - Hospitals or wards for drug/alcohol abuse (%)
People in Group quarters - Mental (Psychiatric) hospitals or wards (%)
People in Group quarters - Schools, hospitals, or wards for the mentally retarded (%)
People in Group quarters - Schools, hospitals, or wards for the physically handicapped (%)
People in Group quarters - Institutions for the deaf (%)
People in Group quarters - Institutions for the blind (%)
People in Group quarters - Orthopedic wards and institutions for the physically handicapped (%)
People in Group quarters - Wards in general hospitals for patients who have no usual home elsewhere (%)
People in Group quarters - Wards in military hospitals for patients who have no usual home elsewhere (%)
People in Group quarters - Juvenile institutions (%)
People in Group quarters - Long-term care (%)
People in Group quarters - Homes for abused, dependent, and neglected children (%)
People in Group quarters - Residential treatment centers for emotionally disturbed children (%)
People in Group quarters - Training schools for juvenile delinquents (%)
People in Group quarters - Short-term care, detention or diagnostic centers for delinquent children (%)
People in Group quarters - Type of juvenile institution unknown (%)
People in Group quarters - Noninstitutionalized population (%)
People in Group quarters - College dormitories (includes college quarters off campus) (%)
People in Group quarters - Military quarters (%)
People in Group quarters - On base (%)
People in Group quarters - Barracks, unaccompanied personnel housing (UPH), (Enlisted/Officer), ;and similar group living quarters for military personnel (%)
People in Group quarters - Transient quarters for temporary residents (%)
People in Group quarters - Military ships (%)
People in Group quarters - Group homes (%)
People in Group quarters - Homes or halfway houses for drug/alcohol abuse (%)
People in Group quarters - Homes for the mentally ill (%)
People in Group quarters - Homes for the mentally retarded (%)
People in Group quarters - Homes for the physically handicapped (%)
People in Group quarters - Other group homes (%)
People in Group quarters - Religious group quarters (%)
People in Group quarters - Dormitories (%)
People in Group quarters - Agriculture workers' dormitories on farms (%)
People in Group quarters - Job Corps and vocational training facilities (%)
People in Group quarters - Other workers' dormitories (%)
People in Group quarters - Crews of maritime vessels (%)
People in Group quarters - Other nonhousehold living situations (%)
People in Group quarters - Other noninstitutional group quarters (%)
Residents speaking English at home (%)
Residents speaking English at home - Born in the United States (%)
Residents speaking English at home - Native, born elsewhere (%)
Residents speaking English at home - Foreign born (%)
Residents speaking Spanish at home (%)
Residents speaking Spanish at home - Born in the United States (%)
Residents speaking Spanish at home - Native, born elsewhere (%)
Residents speaking Spanish at home - Foreign born (%)
Residents speaking other language at home (%)
Residents speaking other language at home - Born in the United States (%)
Residents speaking other language at home - Native, born elsewhere (%)
Residents speaking other language at home - Foreign born (%)
Class of Workers - Employee of private company (%)
Class of Workers - Self-employed in own incorporated business (%)
Class of Workers - Private not-for-profit wage and salary workers (%)
Class of Workers - Local government workers (%)
Class of Workers - State government workers (%)
Class of Workers - Federal government workers (%)
Class of Workers - Self-employed workers in own not incorporated business and Unpaid family workers (%)
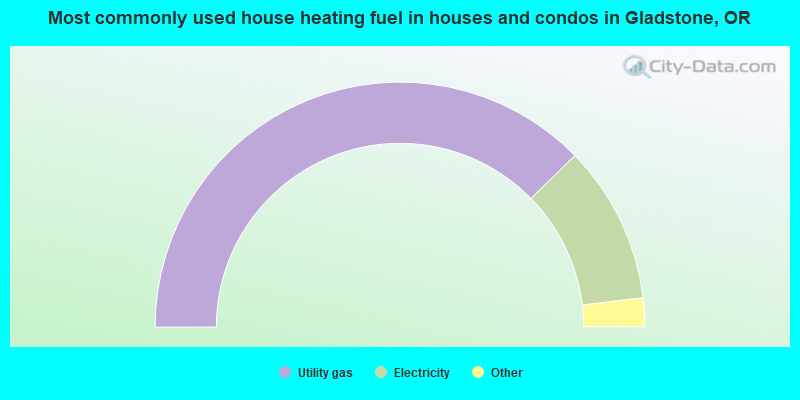
House heating fuel used in houses and condos - Utility gas (%)
House heating fuel used in houses and condos - Bottled, tank, or LP gas (%)
House heating fuel used in houses and condos - Electricity (%)
House heating fuel used in houses and condos - Fuel oil, kerosene, etc. (%)
House heating fuel used in houses and condos - Coal or coke (%)
House heating fuel used in houses and condos - Wood (%)
House heating fuel used in houses and condos - Solar energy (%)
House heating fuel used in houses and condos - Other fuel (%)
House heating fuel used in houses and condos - No fuel used (%)
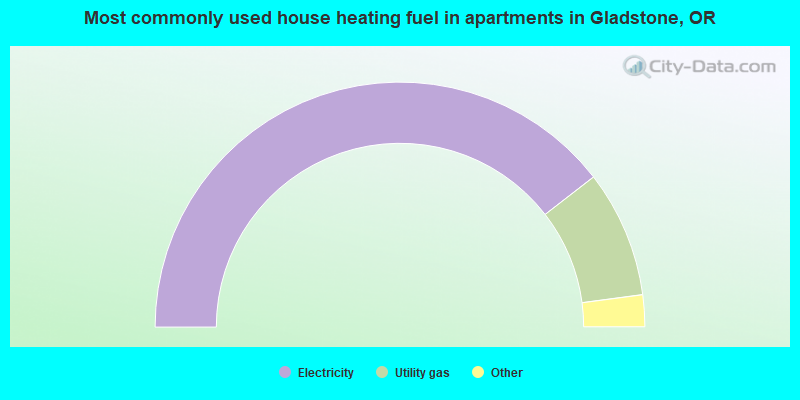
House heating fuel used in apartments - Utility gas (%)
House heating fuel used in apartments - Bottled, tank, or LP gas (%)
House heating fuel used in apartments - Electricity (%)
House heating fuel used in apartments - Fuel oil, kerosene, etc. (%)
House heating fuel used in apartments - Coal or coke (%)
House heating fuel used in apartments - Wood (%)
House heating fuel used in apartments - Solar energy (%)
House heating fuel used in apartments - Other fuel (%)
House heating fuel used in apartments - No fuel used (%)
Armed forces status - In Armed Forces (%)
Armed forces status - Civilian (%)
Armed forces status - Civilian - Veteran (%)
Armed forces status - Civilian - Nonveteran (%)
Fatal accidents locations in years 2005-2021
Fatal accidents locations in 2005
Fatal accidents locations in 2006
Fatal accidents locations in 2007
Fatal accidents locations in 2008
Fatal accidents locations in 2009
Fatal accidents locations in 2010
Fatal accidents locations in 2011
Fatal accidents locations in 2012
Fatal accidents locations in 2013
Fatal accidents locations in 2014
Fatal accidents locations in 2015
Fatal accidents locations in 2016
Fatal accidents locations in 2017
Fatal accidents locations in 2018
Fatal accidents locations in 2019
Fatal accidents locations in 2020
Fatal accidents locations in 2021
Alcohol use - People drinking some alcohol every month (%)
Alcohol use - People not drinking at all (%)
Alcohol use - Average days/month drinking alcohol
Alcohol use - Average drinks/week
Alcohol use - Average days/year people drink much
Audiometry - Average condition of hearing (%)
Audiometry - People that can hear a whisper from across a quiet room (%)
Audiometry - People that can hear normal voice from across a quiet room (%)
Audiometry - Ears ringing, roaring, buzzing (%)
Audiometry - Had a job exposure to loud noise (%)
Audiometry - Had off-work exposure to loud noise (%)
Blood Pressure & Cholesterol - Has high blood pressure (%)
Blood Pressure & Cholesterol - Checking blood pressure at home (%)
Blood Pressure & Cholesterol - Frequently checking blood cholesterol (%)
Blood Pressure & Cholesterol - Has high cholesterol level (%)
Consumer Behavior - Money monthly spent on food at supermarket/grocery store
Consumer Behavior - Money monthly spent on food at other stores
Consumer Behavior - Money monthly spent on eating out
Consumer Behavior - Money monthly spent on carryout/delivered foods
Consumer Behavior - Income spent on food at supermarket/grocery store (%)
Consumer Behavior - Income spent on food at other stores (%)
Consumer Behavior - Income spent on eating out (%)
Consumer Behavior - Income spent on carryout/delivered foods (%)
Current Health Status - General health condition (%)
Current Health Status - Blood donors (%)
Current Health Status - Has blood ever tested for HIV virus (%)
Current Health Status - Left-handed people (%)
Dermatology - People using sunscreen (%)
Diabetes - Diabetics (%)
Diabetes - Had a blood test for high blood sugar (%)
Diabetes - People taking insulin (%)
Diet Behavior & Nutrition - Diet health (%)
Diet Behavior & Nutrition - Milk product consumption (# of products/month)
Diet Behavior & Nutrition - Meals not home prepared (#/week)
Diet Behavior & Nutrition - Meals from fast food or pizza place (#/week)
Diet Behavior & Nutrition - Ready-to-eat foods (#/month)
Diet Behavior & Nutrition - Frozen meals/pizza (#/month)
Drug Use - People that ever used marijuana or hashish (%)
Drug Use - Ever used hard drugs (%)
Drug Use - Ever used any form of cocaine (%)
Drug Use - Ever used heroin (%)
Drug Use - Ever used methamphetamine (%)
Health Insurance - People covered by health insurance (%)
Kidney Conditions-Urology - Avg. # of times urinating at night
Medical Conditions - People with asthma (%)
Medical Conditions - People with anemia (%)
Medical Conditions - People with psoriasis (%)
Medical Conditions - People with overweight (%)
Medical Conditions - Elderly people having difficulties in thinking or remembering (%)
Medical Conditions - People who ever received blood transfusion (%)
Medical Conditions - People having trouble seeing even with glass/contacts (%)
Medical Conditions - People with arthritis (%)
Medical Conditions - People with gout (%)
Medical Conditions - People with congestive heart failure (%)
Medical Conditions - People with coronary heart disease (%)
Medical Conditions - People with angina pectoris (%)
Medical Conditions - People who ever had heart attack (%)
Medical Conditions - People who ever had stroke (%)
Medical Conditions - People with emphysema (%)
Medical Conditions - People with thyroid problem (%)
Medical Conditions - People with chronic bronchitis (%)
Medical Conditions - People with any liver condition (%)
Medical Conditions - People who ever had cancer or malignancy (%)
Mental Health - People who have little interest in doing things (%)
Mental Health - People feeling down, depressed, or hopeless (%)
Mental Health - People who have trouble sleeping or sleeping too much (%)
Mental Health - People feeling tired or having little energy (%)
Mental Health - People with poor appetite or overeating (%)
Mental Health - People feeling bad about themself (%)
Mental Health - People who have trouble concentrating on things (%)
Mental Health - People moving or speaking slowly or too fast (%)
Mental Health - People having thoughts they would be better off dead (%)
Oral Health - Average years since last visit a dentist
Oral Health - People embarrassed because of mouth (%)
Oral Health - People with gum disease (%)
Oral Health - General health of teeth and gums (%)
Oral Health - Average days a week using dental floss/device
Oral Health - Average days a week using mouthwash for dental problem
Oral Health - Average number of teeth
Pesticide Use - Households using pesticides to control insects (%)
Pesticide Use - Households using pesticides to kill weeds (%)
Physical Activity - People doing vigorous-intensity work activities (%)
Physical Activity - People doing moderate-intensity work activities (%)
Physical Activity - People walking or bicycling (%)
Physical Activity - People doing vigorous-intensity recreational activities (%)
Physical Activity - People doing moderate-intensity recreational activities (%)
Physical Activity - Average hours a day doing sedentary activities
Physical Activity - Average hours a day watching TV or videos
Physical Activity - Average hours a day using computer
Physical Functioning - People having limitations keeping them from working (%)
Physical Functioning - People limited in amount of work they can do (%)
Physical Functioning - People that need special equipment to walk (%)
Physical Functioning - People experiencing confusion/memory problems (%)
Physical Functioning - People requiring special healthcare equipment (%)
Prescription Medications - Average number of prescription medicines taking
Preventive Aspirin Use - Adults 40+ taking low-dose aspirin (%)
Reproductive Health - Vaginal deliveries (%)
Reproductive Health - Cesarean deliveries (%)
Reproductive Health - Deliveries resulted in a live birth (%)
Reproductive Health - Pregnancies resulted in a delivery (%)
Reproductive Health - Women breastfeeding newborns (%)
Reproductive Health - Women that had a hysterectomy (%)
Reproductive Health - Women that had both ovaries removed (%)
Reproductive Health - Women that have ever taken birth control pills (%)
Reproductive Health - Women taking birth control pills (%)
Reproductive Health - Women that have ever used Depo-Provera or injectables (%)
Reproductive Health - Women that have ever used female hormones (%)
Sexual Behavior - People 18+ that ever had sex (vaginal, anal, or oral) (%)
Sexual Behavior - Males 18+ that ever had vaginal sex with a woman (%)
Sexual Behavior - Males 18+ that ever performed oral sex on a woman (%)
Sexual Behavior - Males 18+ that ever had anal sex with a woman (%)
Sexual Behavior - Males 18+ that ever had any sex with a man (%)
Sexual Behavior - Females 18+ that ever had vaginal sex with a man (%)
Sexual Behavior - Females 18+ that ever performed oral sex on a man (%)
Sexual Behavior - Females 18+ that ever had anal sex with a man (%)
Sexual Behavior - Females 18+ that ever had any kind of sex with a woman (%)
Sexual Behavior - Average age people first had sex
Sexual Behavior - Average number of female sex partners in lifetime (males 18+)
Sexual Behavior - Average number of female vaginal sex partners in lifetime (males 18+)
Sexual Behavior - Average age people first performed oral sex on a woman (18+)
Sexual Behavior - Average number of woman performed oral sex on in lifetime (18+)
Sexual Behavior - Average number of male sex partners in lifetime (males 18+)
Sexual Behavior - Average number of male anal sex partners in lifetime (males 18+)
Sexual Behavior - Average age people first performed oral sex on a man (18+)
Sexual Behavior - Average number of male oral sex partners in lifetime (18+)
Sexual Behavior - People using protection when performing oral sex (%)
Sexual Behavior - Average number of times people have vaginal or anal sex a year
Sexual Behavior - People having sex without condom (%)
Sexual Behavior - Average number of male sex partners in lifetime (females 18+)
Sexual Behavior - Average number of male vaginal sex partners in lifetime (females 18+)
Sexual Behavior - Average number of female sex partners in lifetime (females 18+)
Sexual Behavior - Circumcised males 18+ (%)
Sleep Disorders - Average hours sleeping at night
Sleep Disorders - People that has trouble sleeping (%)
Smoking-Cigarette Use - People smoking cigarettes (%)
Taste & Smell - People 40+ having problems with smell (%)
Taste & Smell - People 40+ having problems with taste (%)
Taste & Smell - People 40+ that ever had wisdom teeth removed (%)
Taste & Smell - People 40+ that ever had tonsils teeth removed (%)
Taste & Smell - People 40+ that ever had a loss of consciousness because of a head injury (%)
Taste & Smell - People 40+ that ever had a broken nose or other serious injury to face or skull (%)
Taste & Smell - People 40+ that ever had two or more sinus infections (%)
Weight - Average height (inches)
Weight - Average weight (pounds)
Weight - Average BMI
Weight - People that are obese (%)
Weight - People that ever were obese (%)
Weight - People trying to lose weight (%)
According to our research of Oregon and other state lists, there was 1 registered sex offender living in Gladstone, Oregon as of April 28, 2024 . The ratio of all residents to sex offenders in Gladstone is 12,242 to 1.The ratio of registered sex offenders to all residents in this city is much lower than the state average.
Officers per 1,000 residents here:
1.20Oregon average:
1.48
Latest news from Gladstone, OR collected exclusively by city-data.com from local newspapers, TV, and radio stations
Ancestries: German (18.2%), American (10.8%), European (8.3%), English (4.5%), Irish (4.0%), Norwegian (4.0%).
Current Local Time:
Land area: 2.48 square miles.
Population density: 4,826 people per square mile (average).
728 residents are foreign born (2.9% Latin America , 2.3% Asia ).
This city:
6.0%Oregon:
9.8%
Median real estate property taxes paid for housing units with mortgages in 2022: $4,974 (0.9%)Median real estate property taxes paid for housing units with no mortgage in 2022: $4,610 (1.0%)
Nearest city with pop. 50,000+: Northwest Clackamas, OR (1.5 miles
Nearest city with pop. 1,000,000+: Los Angeles, CA
Nearest cities:
Latitude: 45.39 N, Longitude: 122.59 W
Daytime population change due to commuting: -2,007 (-16.6%)Workers who live and work in this city: 1,869 (28.8%)
Property values in Gladstone, OR
Single-family new house construction building permits:
2003: 47 buildings , average cost: $224,2002002: 25 buildings , average cost: $245,2002001: 26 buildings , average cost: $164,4002000: 4 buildings , average cost: $169,2001999: 11 buildings , average cost: $148,9001998: 15 buildings , average cost: $137,2001997: 13 buildings , average cost: $194,500Unemployment in December 2023:
Population change in the 1990s: +1,202 (+11.7%).
Most common occupations in Gladstone, OR (%)
Both Males Females
Other office and administrative support workers, including supervisors (4.4%)
Retail sales workers, except cashiers (4.4%)
Secretaries and administrative assistants (4.3%)
Other sales and related occupations, including supervisors (4.1%)
Sales representatives, services, wholesale and manufacturing (3.6%)
Other management occupations, except farmers and farm managers (3.5%)
Material recording, scheduling, dispatching, and distributing workers (3.4%)
Retail sales workers, except cashiers (5.5%)
Electrical equipment mechanics and other installation, maintenance, and repair workers, including supervisors (5.5%)
Other production occupations, including supervisors (5.4%)
Driver/sales workers and truck drivers (4.9%)
Metal workers and plastic workers (4.8%)
Laborers and material movers, hand (4.7%)
Construction traders workers except carpenters, electricians, painters, plumbers, and construction laborers (4.5%)
Secretaries and administrative assistants (9.1%)
Other office and administrative support workers, including supervisors (6.8%)
Information and record clerks, except customer service representatives (4.6%)
Preschool, kindergarten, elementary, and middle school teachers (4.6%)
Other sales and related occupations, including supervisors (4.0%)
Cashiers (3.6%)
Material recording, scheduling, dispatching, and distributing workers (3.6%)
Earthquake activity:
Gladstone-area historical earthquake activity is significantly above Oregon state average. It is 1468% greater than the overall U.S. average. On 4/13/1949 at 19:55:42, a magnitude 7.0 (7.0 UK, Class: Major, Intensity: VIII - XII) earthquake occurred 129.0 miles away from Gladstone center, causing $80,000,000 total damage On 2/28/2001 at 18:54:32, a magnitude 6.8 (6.5 MB, 6.6 MS, 6.8 MW, Class: Strong, Intensity: VII - IX) earthquake occurred 117.9 miles away from Gladstone center, causing $2,000,000,000 total damage and $305,000,000 insured lossesOn 2/28/2001 at 18:54:32, a magnitude 6.8 (6.8 MD, Depth: 32.2 mi) earthquake occurred 122.1 miles away from the city center On 4/29/1965 at 15:28:43, a magnitude 6.6 (6.6 UK) earthquake occurred 134.2 miles away from Gladstone center, causing $28,000,000 total damage On 1/31/1922 at 13:17:28, a magnitude 7.6 (7.6 UK) earthquake occurred 356.9 miles away from the city center On 11/8/1980 at 10:27:34, a magnitude 7.2 (6.2 MB, 7.2 MS, 7.2 MW, 7.0 ML) earthquake occurred 308.0 miles away from Gladstone center Magnitude types: body-wave magnitude (MB), duration magnitude (MD), local magnitude (ML), surface-wave magnitude (MS), moment magnitude (MW) Natural disasters: The number of natural disasters in Clackamas County (13) is near the US average (15).Major Disasters (Presidential) Declared: 11Emergencies Declared: 1Floods: 7, Landslides: 4, Mudslides: 4, Storms: 4, Winter Storms: 4, Snows: 2, Winds: 2, Earthquake: 1, Fire: 1, Heavy Rain: 1, Hurricane: 1, Other: 1 (Note: some incidents may be assigned to more than one category). Hospitals and medical centers in Gladstone: AVAMERE REHABILITATION OF CLACKAMAS (220 E. HEREFORD)
GLADSTONE CONVALESCENT CARE FACILITY (1315 WEBSTER RD)
GLADSTONE REHAB AND LIVING CENTER (18000 SE WEBSTER ROAD)
TRI-CITY HEALTH CARE (340 FIRST ST)
Amtrak stations near Gladstone: 2 miles: OREGON CITY (1757 WASHINGTON ST.) 11 miles: PORTLAND (800 NW 6TH AVE.) Services: ticket office, fully wheelchair accessible, enclosed waiting area, public restrooms, public payphones, full-service food facilities, paid short-term parking, paid long-term parking, call for car rental service, taxi stand, intercity bus service, public transit connection.
18 miles: VANCOUVER (FOOT OF W. 11TH ST.) Services: ticket office, fully wheelchair accessible, enclosed waiting area, public restrooms, public payphones, vending machines, free short-term parking, free long-term parking, call for taxi service.
Colleges/universities with over 2000 students nearest to Gladstone:
Clackamas Community College (about 5 miles; Oregon City, OR ; Full-time enrollment: 4,261)
Lewis & Clark College (about 6 miles; Portland, OR ; FT enrollment: 2,864)
Portland Community College (about 8 miles; Portland, OR ; FT enrollment: 23,600)
Pioneer Pacific College (about 10 miles; Wilsonville, OR ; FT enrollment: 2,194)
Portland State University (about 10 miles; Portland, OR ; FT enrollment: 21,450)
Concordia University-Portland (about 13 miles; Portland, OR ; FT enrollment: 3,996)
Mt Hood Community College (about 13 miles; Gresham, OR ; FT enrollment: 11,847)
Public high school in Gladstone:
Private high schools in Gladstone: GRACE CHRISTIAN SCHOOL Students: 133, Location: 6460 GLEN ECHO AVE, Grades: PK-12)
NORTHWEST ALTERNATIVE SCHOOL Students: 47, Location: 18000 WEBSTER RD, Grades: 7-12)
Public elementary/middle schools in Gladstone:
Private elementary/middle school in Gladstone: RIVERGATE ADVENTIST ELEMENTARY SCHOOL Students: 165, Location: 1505 OHLSON RD, Grades: PK-8)
See full list of schools located in Gladstone Library in Gladstone: GLADSTONE PUBLIC LIBRARY Operating income: $581,692; Location: 135 E DARTMOUTH; 50,273 books ; 10,769 audio materials ; 8,443 video materials ; 27 state licensed databases ; 12 other licensed databases ; 127 print serial subscriptions ; 6 electronic serial subscriptions )
Notable locations in Gladstone: (A) , Gladstone Station (B) , Rivergreens Golf Course (C) , Gladstone Park Seventh Day Adventist Camp (D) , Gladstone Fire Department (E) , Department of Motor Vehicles Gladstone (F) , Gladstone City Hall (G) , Gladstone Municipal Court (H) , Gladstone Public Library (I) , Gladstone Public Works (J) . Display/hide their locations on the map
Churches in Gladstone include: (A) , Faith and Life Center Free Methodist Church (B) , Gladstone First Baptist Church (C) , Gladstone Christian Church (D) , Tri City Baptist Temple of Milwaukie (E) , Gladstone Assembly of God Church (F) , First Baptist Church of Gladstone (G) , Saint Stephen Lutheran Church (H) , Gladstone Park Seventh Day Adventist Church (I) . Display/hide their locations on the map
Creek: (A) . Display/hide its location on the map
Parks in Gladstone include: (1) , High Rocks City Park (2) , Stocker City Park (3) , Max Patterson Memorial City Park (4) , Cross Memorial City Park (5) , Meldrum Bar City Park (6) , Dierickx Field (7) , Sherwood Forest Tot Lot (8) , Ridgegate City Park (9) . Display/hide their locations on the map
Tourist attraction:
Hotels:
Clackamas County has a predicted average indoor radon screening level less than 2 pCi/L (pico curies per liter) - Low Potential Drinking water stations with addresses in Gladstone and their reported violations in the past:
GLADSTONE, CITY OF (Population served: 12,215, Purch surface water):
Past monitoring violations:
Monitoring and Reporting (DBP) - Between JAN-2014 and MAR-2014, Contaminant: TTHM
Monitoring and Reporting (DBP) - Between JAN-2014 and MAR-2014, Contaminant: Total Haloacetic Acids (HAA5)
Monitoring and Reporting (DBP) - Between JUL-2013 and SEP-2013, Contaminant: Total Haloacetic Acids (HAA5). Follow-up actions: St Compliance achieved (JAN-09-2014)
Monitoring and Reporting (DBP) - Between JUL-2013 and SEP-2013, Contaminant: TTHM. Follow-up actions: St Compliance achieved (JAN-09-2014)
Monitoring and Reporting (DBP) - In OCT-2009, Contaminant: TTHM. Follow-up actions: St Compliance achieved (FEB-17-2010), St Violation/Reminder Notice (FEB-22-2010)
2 minor monitoring violations
One other older monitoring violation
Serves WA, Population served: 100, Groundwater):
Past monitoring violations:
70 regular monitoring violations
Average household size: This city:
2.5 peopleOregon:
2.5 people
Percentage of family households: This city:
66.3%Whole state:
63.4%
Percentage of households with unmarried partners: This city:
7.4%Whole state:
8.0%
Likely homosexual households (counted as self-reported same-sex unmarried-partner households)
Lesbian couples: 0.5% of all households Gay men: 0.3% of all households
People in group quarters in Gladstone in 2010:
52 people in group homes intended for adults
41 people in nursing facilities/skilled-nursing facilities
7 people in workers' group living quarters and job corps centers
6 people in residential treatment centers for adults
people in nursing homes in 2000people in homes for the mentally retarded in 2000Banks with branches in Gladstone (2011 data):
MBank: Gladstone Branch at 35 Southeast 82nd Drive, branch established on 1999/01/04. Info updated 2010/02/23: Bank assets: $189.6 mil, Deposits: $169.8 mil, headquarters in Gresham, OR, negative income in the last year , Commercial Lending Specialization, 6 total offices , Holding Company: Merchants Bancorp
U.S. Bank National Association: Gladstone Branch at 19900 Southeast Mcloughlin Boulevard, branch established on 1962/02/23. Info updated 2012/01/30: Bank assets: $330,470.8 mil, Deposits: $236,091.5 mil, headquarters in Cincinnati, OH, positive income , 3121 total offices , Holding Company: U.S. Bancorp
For population 15 years and over in Gladstone:
Never married: 33.7%Now married: 47.6%Separated: 1.8%Widowed: 5.2%Divorced: 11.7% For population 25 years and over in Gladstone:
High school or higher: 92.0%Bachelor's degree or higher: 25.7%Graduate or professional degree: 5.0%Unemployed: 6.1%Mean travel time to work (commute): 18.6 minutes
Education Gini index (Inequality in education) Here:
10.4Oregon average:
11.6
Religion statistics for Gladstone, OR (based on Clackamas County data)
Religion Adherents Congregations Evangelical Protestant 49,829 194 Catholic 27,128 13 Other 15,447 51 Mainline Protestant 15,118 49 Orthodox 2,275 5 None 266,195 -
Source: Clifford Grammich, Kirk Hadaway, Richard Houseal, Dale E.Jones, Alexei Krindatch, Richie Stanley and Richard H.Taylor. 2012. 2010 U.S.Religion Census: Religious Congregations & Membership Study. Association of Statisticians of American Religious Bodies. Jones, Dale E., et al. 2002. Congregations and Membership in the United States 2000. Nashville, TN: Glenmary Research Center. Graphs represent county-level data
Food Environment Statistics: Number of grocery stores : 56Here :
1.49 / 10,000 pop.State :
2.03 / 10,000 pop.
Number of supercenters and club stores : 10This county :
0.27 / 10,000 pop.State :
0.33 / 10,000 pop.
Number of convenience stores (no gas) : 55This county :
1.47 / 10,000 pop.State :
2.01 / 10,000 pop.
Number of convenience stores (with gas) : 59Clackamas County :
1.57 / 10,000 pop.Oregon :
1.69 / 10,000 pop.
Number of full-service restaurants : 284This county :
7.57 / 10,000 pop.State :
9.93 / 10,000 pop.
Adult diabetes rate : This county :
6.9%State :
7.4%
Adult obesity rate : Clackamas County :
25.7%Oregon :
25.6%
Low-income preschool obesity rate : This county :
13.5%Oregon :
14.2%
Health and Nutrition: Healthy diet rate : This city:
48.9%Oregon:
49.6%
Average overall health of teeth and gums : Gladstone:
45.5%State:
46.8%
Average BMI : Gladstone:
28.3Oregon:
28.5
People feeling badly about themselves : This city:
20.1%State:
21.2%
People not drinking alcohol at all : Gladstone:
9.2%Oregon:
10.1%
Average hours sleeping at night : Overweight people : This city:
33.5%State:
33.3%
General health condition : Gladstone:
55.7%Oregon:
56.5%
Average condition of hearing : More about Health and Nutrition of Gladstone, OR Residents
Local government employment and payroll (March 2022)
Function
Full-time employees
Monthly full-time payroll
Average yearly full-time wage
Part-time employees
Monthly part-time payroll
Police Protection - Officers
17 $162,924 $115,005 0 $0 Other Government Administration
5 $46,404 $111,370 1 $3,090 Streets and Highways
3 $18,006 $72,024 0 $0 Water Supply
3 $17,018 $68,072 0 $0 Financial Administration
3 $20,265 $81,060 0 $0 Sewerage
3 $15,519 $62,076 0 $0 Welfare
3 $17,139 $68,556 1 $2,201 Firefighters
3 $39,710 $158,840 10 $43,278 Police - Other
3 $16,876 $67,504 1 $2,871 Judicial and Legal
2 $13,046 $78,276 0 $0 Parks and Recreation
1 $4,973 $59,676 0 $0 Other and Unallocable
1 $5,154 $61,848 0 $0
Totals for Government
47 $377,032 $96,263 13 $51,440
Gladstone government finances - Expenditure in 2017 (per resident):
Current Operations - Police Protection: $2,724,000 ($227.93)
Central Staff Services: $1,402,000 ($117.31)Local Fire Protection: $985,000 ($82.42)Libraries: $826,000 ($69.12)Parks and Recreation: $776,000 ($64.93)Water Utilities: $560,000 ($46.86)Sewerage: $462,000 ($38.66)Judicial and Legal Services: $376,000 ($31.46)Regular Highways: $291,000 ($24.35)General - Other: $105,000 ($8.79)Financial Administration: $51,000 ($4.27)Intergovernmental to Local - Other - Sewerage: $960,000 ($80.33)
Other Capital Outlay - Libraries: $555,000 ($46.44)
General - Other: $293,000 ($24.52)Police Protection: $202,000 ($16.90)Local Fire Protection: $155,000 ($12.97)Regular Highways: $95,000 ($7.95)Sewerage: $54,000 ($4.52)Water Utilities: $41,000 ($3.43)Parks and Recreation: $40,000 ($3.35)Total Salaries and Wages: $4,503,000 ($376.79)
Water Utilities - Interest on Debt: $84,000 ($7.03)
Gladstone government finances - Revenue in 2017 (per resident):
Charges - Sewerage: $1,817,000 ($152.04)
Other: $151,000 ($12.63)Regular Highways: $44,000 ($3.68)Local Intergovernmental - Other: $627,000 ($52.46)
General Local Government Support: $132,000 ($11.05)Miscellaneous - Fines and Forfeits: $290,000 ($24.27)
General Revenue - Other: $81,000 ($6.78)Interest Earnings: $65,000 ($5.44)Donations From Private Sources: $46,000 ($3.85)Revenue - Water Utilities: $1,287,000 ($107.69)
State Intergovernmental - Highways: $616,000 ($51.54)
General Local Government Support: $229,000 ($19.16)Other: $83,000 ($6.95)Tax - Property: $5,734,000 ($479.79)
Public Utilities Sales: $617,000 ($51.63)Other License: $28,000 ($2.34)
Gladstone government finances - Debt in 2017 (per resident):
Long Term Debt - Beginning Outstanding - Unspecified Public Purpose: $2,050,000 ($171.53)
Outstanding Unspecified Public Purpose: $1,950,000 ($163.17)Retired Unspecified Public Purpose: $100,000 ($8.37)
Gladstone government finances - Cash and Securities in 2017 (per resident):
Other Funds - Cash and Securities: $10,096,000 ($844.78)
9.10% of this county's 2021 resident taxpayers lived in other counties in 2020 ($99,084 average adjusted gross income )
Here:
9.10%Oregon average:
8.20%
0.01% of residents moved from foreign countries ($71 average AGI )Clackamas County:
0.01%Oregon average:
0.01%
Top counties from which taxpayers relocated into this county between 2020 and 2021:
Businesses in Gladstone, OR
Name Count Name Count
Baskin-Robbins 1 Safeway 1 H&R Block 1 Starbucks 1 Honda 1 Subway 2 Mazda 1 Toyota 1 McDonald's 1 U-Haul 1 Nissan 1 Volkswagen 1 Pizza Hut 1 Vons 1
Strongest AM radio stations in Gladstone:
KPOJ (620 AM; 50 kW; PORTLAND, OR; Owner: CITICASTERS LICENSES, L.P.)
KKSN (1520 AM; 50 kW; OREGON CITY, OR; Owner: ENTERCOM PORTLAND LICENSE, LLC)
KEX (1190 AM; 50 kW; PORTLAND, OR; Owner: CITICASTERS LICENSES, L.P.)
KKSL (1290 AM; 10 kW; LAKE OSWEGO, OR; Owner: ABC, INC.)
KXL (750 AM; 50 kW; PORTLAND, OR; Owner: ROSE CITY RADIO CORPORATION)
KOTK (1080 AM; 50 kW; PORTLAND, OR; Owner: FISHER BROADCASTING - PORTLAND RADIO, L.L.C.)
KDZR (1640 AM; 10 kW; LAKE OSWEGO, OR; Owner: ABC, INC.)
KPAM (860 AM; 50 kW; TROUTDALE, OR; Owner: PAMPLIN BROADCASTING-OREGON, INC.)
KKPZ (1330 AM; 5 kW; PORTLAND, OR; Owner: KPHP RADIO, INC.)
KKAD (1550 AM; 50 kW; VANCOUVER, WA; Owner: PAMPLIN BROADCASTING-WASHINGTON, INC)
KBNP (1410 AM; 5 kW; PORTLAND, OR; Owner: KBNP RADIO, INC.)
KFXX (910 AM; 10 kW; VANCOUVER, WA; Owner: ENTERCOM PORTLAND LICENSE, LLC (DE))
KLVP (1040 AM; 2 kW; TIGARD, OR; Owner: EDUCATIONAL MEDIA FOUNDATION)
Strongest FM radio stations in Gladstone:
K242AF (96.3 FM; PORTLAND, OR; Owner: EDUCATIONAL MEDIA FOUNDATION)
K274AR (102.7 FM; GRESHAM, OR; Owner: EDUCATIONAL MEDIA FOUNDATION)
KNRK (94.7 FM; CAMAS, WA; Owner: ENTERCOM PORTLAND LICENSE, LLC (DE))
KGON (92.3 FM; PORTLAND, OR; Owner: ENTERCOM PORTLAND LICENSE, LLC (DE))
KKSN-FM (97.1 FM; PORTLAND, OR; Owner: ENTERCOM PORTLAND LICENSE, LLC (DE))
KXJM (95.5 FM; PORTLAND, OR; Owner: ROSE CITY RADIO CORPORATION)
KBOO (90.7 FM; PORTLAND, OR; Owner: THE KBOO FOUNDATION)
KWJJ-FM (99.5 FM; PORTLAND, OR; Owner: FISHER BROADCASTING - PORTLAND RADIO, L.L.C.)
KFIS (104.1 FM; SCAPPOOSE, OR; Owner: CARON BROADCASTING, INC.)
KRRC (104.1 FM; PORTLAND, OR; Owner: THE REED INSTITUTE)
KINK (101.9 FM; PORTLAND, OR; Owner: INFINITY RADIO OPERATIONS INC.)
KKCW (103.3 FM; BEAVERTON, OR; Owner: CITICASTERS LICENSES, L.P.)
KUFO-FM (101.1 FM; PORTLAND, OR; Owner: INFINITY RADIO OPERATIONS INC.)
KMHD (89.1 FM; GRESHAM, OR; Owner: MT. HOOD COMMUNITY COLLEGE DISTRICT)
KVMX (107.5 FM; BANKS, OR; Owner: INFINITY RADIO OPERATIONS INC.)
KLTH (106.7 FM; LAKE OSWEGO, OR; Owner: INIFINITY RADIO OF PORTLAND INC.)
KUPL-FM (98.7 FM; PORTLAND, OR; Owner: INFINITY RADIO OF PORTLAND INC.)
KOPB-FM (91.5 FM; PORTLAND, OR; Owner: OREGON PUBLIC BROADCASTING)
KPDQ-FM (93.7 FM; PORTLAND, OR; Owner: SALEM MEDIA OF OREGON, INC.)
KBVM (88.3 FM; PORTLAND, OR; Owner: CATHOLIC BROADCASTING NORTHWEST, INC)
TV broadcast stations around Gladstone:
KATU (Channel 2; PORTLAND, OR; Owner: FISHER BROADCASTING - PORTLAND TV, L.L.C.)
KOIN (Channel 6; PORTLAND, OR; Owner: EMMIS TELEVISION LICENSE CORPORATION)
KNMT (Channel 24; PORTLAND, OR; Owner: NATIONAL MINORITY T.V., INC.)
KPDX (Channel 49; VANCOUVER, WA; Owner: MEREDITH CORPORATION)
KPTV (Channel 12; PORTLAND, OR; Owner: MEREDITH CORPORATION)
K57IF (Channel 57; SALEM, OR; Owner: LaGRANDE BROADCASTING, INC.)
KGW (Channel 8; PORTLAND, OR; Owner: KING BROADCASTING COMPANY)
KOPB-TV (Channel 10; PORTLAND, OR; Owner: OREGON PUBLIC BROADCASTING)
KPXG-LP (Channel 54; PORTLAND, OR; Owner: PAXSON COMMUNICATIONS LICENSE COMPANY, LLC)
K14HN (Channel 14; VANCOUVER/CAMAS, WA; Owner: MEREDITH CORPORATION)
KWBP-LP (Channel 4; PORTLAND, OR; Owner: TRIBUNE BROADCASTING HOLDINGS, INC.)
K58CO (Channel 58; PORTLAND, OR; Owner: NORTHWEST CHRISTIAN BROADCASTING)
K16CB (Channel 16; HAPPY VALLEY, OR; Owner: MEREDITH CORPORATION)
KPXG (Channel 22; SALEM, OR; Owner: PAXSON SALEM LICENSE, INC.)
KWBP (Channel 32; SALEM, OR; Owner: TRIBUNE BROADCAST HOLDINGS, INC.)
KKEI-CA (Channel 56; PORTLAND, OR; Owner: WATCHTV, INC.)
K18EL (Channel 18; NEWBERG/TIGARD, OR; Owner: MEREDITH CORPORATION)
KORK-CA (Channel 35; PORTLAND, OR; Owner: WATCHTV, INC.)
National Bridge Inventory (NBI) Statistics 4 Number of bridges167ft / 51.5m Total length $3,740,000 Total costs307,486 Total average daily traffic28,407 Total average daily truck traffic
FCC Registered Antenna Towers: 14 (
See the full list of FCC Registered Antenna Towers in Gladstone )
FCC Registered Broadcast Land Mobile Towers: 10 (
See the full list of FCC Registered Broadcast Land Mobile Towers in Gladstone, OR )
FCC Registered Microwave Towers: 1
OR-POR188A, 16711 Se Valley View Road (Lat: 45.397583 Lon: -122.594000), Type: Pole, Structure height: 30.5 m, Call Sign: WQIV247, Assigned Frequencies: 19425.0 MHz, 11465.0 MHz, Grant Date: 05/22/2008, Expiration Date: 05/22/2018, Cancellation Date: 10/27/2017, Certifier: Nadja S Sodos-Wallace, Registrant: Sprint Corporation, 12502 Sunrise Valley Drive, M/S: Varesa0209, Reston, VA 20196, Phone: (800) 572-8256, Fax: (703) 433-4483, Email:
FCC Registered Amateur Radio Licenses: 81 (
See the full list of FCC Registered Amateur Radio Licenses in Gladstone )
FAA Registered Aircraft Manufacturers and Dealers: 2 (
See the full list of FAA Registered Manufacturers and Dealers in Gladstone )
FAA Registered Aircraft: 10 (
See the full list of FAA Registered Aircraft )
Home Mortgage Disclosure Act Aggregated Statistics For Year 2009(Based on 4 partial tracts) A) FHA, FSA/RHS & VA B) Conventional C) Refinancings D) Home Improvement Loans E) Loans on Dwellings For 5+ Families F) Non-occupant Loans on G) Loans On Manufactured Number Average Value Number Average Value Number Average Value Number Average Value Number Average Value Number Average Value Number Average Value
LOANS ORIGINATED 57 $214,506 25 $175,411 266 $199,755 7 $80,180 1 $599,170 26 $178,042 0 $0 APPLICATIONS APPROVED, NOT ACCEPTED 7 $233,723 4 $193,192 41 $202,765 1 $205,680 0 $0 4 $177,762 0 $0 APPLICATIONS DENIED 11 $211,251 4 $193,362 91 $225,720 7 $46,137 0 $0 5 $200,038 1 $16,600 APPLICATIONS WITHDRAWN 13 $198,977 6 $186,123 62 $207,471 3 $90,100 0 $0 8 $205,411 1 $154,580 FILES CLOSED FOR INCOMPLETENESS 2 $204,780 1 $158,470 15 $189,421 2 $67,920 0 $0 2 $80,935 2 $68,440
Aggregated Statistics For Year 2008(Based on 4 partial tracts) A) FHA, FSA/RHS & VA B) Conventional C) Refinancings D) Home Improvement Loans E) Loans on Dwellings For 5+ Families F) Non-occupant Loans on G) Loans On Manufactured Number Average Value Number Average Value Number Average Value Number Average Value Number Average Value Number Average Value Number Average Value
LOANS ORIGINATED 40 $243,844 60 $202,767 194 $203,338 12 $97,237 0 $0 19 $190,732 4 $73,155 APPLICATIONS APPROVED, NOT ACCEPTED 2 $181,185 12 $158,169 27 $201,500 5 $62,084 0 $0 4 $212,788 2 $65,550 APPLICATIONS DENIED 5 $210,204 23 $298,221 109 $234,345 20 $92,558 0 $0 12 $227,953 3 $85,210 APPLICATIONS WITHDRAWN 5 $253,656 8 $189,568 46 $235,421 5 $105,276 2 $295,630 3 $217,697 0 $0 FILES CLOSED FOR INCOMPLETENESS 0 $0 4 $233,802 14 $243,603 1 $234,610 0 $0 0 $0 0 $0
Aggregated Statistics For Year 2007(Based on 4 partial tracts) A) FHA, FSA/RHS & VA B) Conventional C) Refinancings D) Home Improvement Loans E) Loans on Dwellings For 5+ Families F) Non-occupant Loans on G) Loans On Manufactured Number Average Value Number Average Value Number Average Value Number Average Value Number Average Value Number Average Value Number Average Value
LOANS ORIGINATED 8 $254,675 127 $198,714 284 $185,514 36 $90,806 2 $999,415 44 $186,835 2 $24,910 APPLICATIONS APPROVED, NOT ACCEPTED 0 $0 24 $193,684 48 $189,932 3 $142,100 0 $0 5 $207,978 0 $0 APPLICATIONS DENIED 1 $228,540 34 $211,357 132 $198,446 33 $106,901 0 $0 10 $150,495 4 $38,142 APPLICATIONS WITHDRAWN 2 $204,365 15 $187,017 63 $207,623 14 $136,556 0 $0 5 $237,888 0 $0 FILES CLOSED FOR INCOMPLETENESS 0 $0 3 $260,923 13 $212,810 2 $163,715 0 $0 2 $200,590 0 $0
Aggregated Statistics For Year 2006(Based on 4 partial tracts) A) FHA, FSA/RHS & VA B) Conventional C) Refinancings D) Home Improvement Loans F) Non-occupant Loans on G) Loans On Manufactured Number Average Value Number Average Value Number Average Value Number Average Value Number Average Value Number Average Value
LOANS ORIGINATED 11 $207,325 215 $166,981 316 $166,693 31 $95,928 42 $179,025 3 $98,530 APPLICATIONS APPROVED, NOT ACCEPTED 0 $0 33 $150,356 70 $164,443 3 $66,790 6 $178,437 2 $39,705 APPLICATIONS DENIED 1 $283,280 51 $163,781 147 $171,524 28 $88,730 16 $169,769 3 $124,827 APPLICATIONS WITHDRAWN 2 $261,160 31 $147,515 98 $182,444 10 $124,534 10 $159,293 0 $0 FILES CLOSED FOR INCOMPLETENESS 0 $0 3 $163,180 25 $198,934 1 $64,900 1 $199,020 0 $0
Aggregated Statistics For Year 2005(Based on 4 partial tracts) A) FHA, FSA/RHS & VA B) Conventional C) Refinancings D) Home Improvement Loans E) Loans on Dwellings For 5+ Families F) Non-occupant Loans on G) Loans On Manufactured Number Average Value Number Average Value Number Average Value Number Average Value Number Average Value Number Average Value Number Average Value
LOANS ORIGINATED 7 $187,406 296 $133,735 374 $140,236 30 $94,280 1 $1,062,110 68 $144,011 2 $27,065 APPLICATIONS APPROVED, NOT ACCEPTED 0 $0 36 $131,587 52 $125,867 4 $33,368 0 $0 8 $145,112 2 $74,830 APPLICATIONS DENIED 2 $177,445 58 $129,448 155 $162,705 24 $79,786 0 $0 7 $129,654 3 $28,203 APPLICATIONS WITHDRAWN 0 $0 34 $132,044 102 $176,222 14 $71,950 0 $0 7 $140,214 1 $183,930 FILES CLOSED FOR INCOMPLETENESS 1 $131,310 8 $189,522 42 $159,976 0 $0 0 $0 2 $140,160 0 $0
Aggregated Statistics For Year 2004(Based on 4 partial tracts) A) FHA, FSA/RHS & VA B) Conventional C) Refinancings D) Home Improvement Loans E) Loans on Dwellings For 5+ Families F) Non-occupant Loans on G) Loans On Manufactured Number Average Value Number Average Value Number Average Value Number Average Value Number Average Value Number Average Value Number Average Value
LOANS ORIGINATED 19 $170,567 242 $126,627 299 $138,126 21 $57,981 3 $459,620 54 $137,953 2 $79,300 APPLICATIONS APPROVED, NOT ACCEPTED 3 $153,687 35 $110,725 53 $140,410 3 $114,087 1 $155,760 12 $139,661 4 $40,225 APPLICATIONS DENIED 2 $136,715 61 $92,626 129 $144,078 18 $66,493 0 $0 15 $138,983 12 $50,900 APPLICATIONS WITHDRAWN 2 $240,205 28 $137,509 91 $138,670 9 $51,312 0 $0 7 $136,231 0 $0 FILES CLOSED FOR INCOMPLETENESS 0 $0 3 $107,487 22 $158,125 1 $131,060 0 $0 0 $0 0 $0
Aggregated Statistics For Year 2003(Based on 4 partial tracts) A) FHA, FSA/RHS & VA B) Conventional C) Refinancings D) Home Improvement Loans E) Loans on Dwellings For 5+ Families F) Non-occupant Loans on Number Average Value Number Average Value Number Average Value Number Average Value Number Average Value Number Average Value
LOANS ORIGINATED 34 $156,994 202 $128,974 698 $133,364 25 $29,307 3 $1,592,123 75 $124,223 APPLICATIONS APPROVED, NOT ACCEPTED 3 $163,477 27 $107,000 96 $132,712 7 $41,121 0 $0 7 $110,093 APPLICATIONS DENIED 5 $167,826 39 $114,608 157 $147,200 22 $42,593 0 $0 19 $123,673 APPLICATIONS WITHDRAWN 3 $112,253 17 $137,630 119 $138,676 2 $23,365 0 $0 4 $126,388 FILES CLOSED FOR INCOMPLETENESS 1 $148,520 0 $0 18 $119,431 0 $0 0 $0 2 $122,025
Aggregated Statistics For Year 2002(Based on 4 partial tracts) A) FHA, FSA/RHS & VA B) Conventional C) Refinancings D) Home Improvement Loans E) Loans on Dwellings For 5+ Families F) Non-occupant Loans on Number Average Value Number Average Value Number Average Value Number Average Value Number Average Value Number Average Value
LOANS ORIGINATED 39 $162,763 131 $122,117 426 $133,215 18 $20,066 4 $410,440 47 $130,010 APPLICATIONS APPROVED, NOT ACCEPTED 4 $172,762 22 $105,275 46 $132,105 3 $6,703 0 $0 4 $106,328 APPLICATIONS DENIED 4 $140,712 22 $98,012 113 $129,102 11 $20,245 0 $0 6 $124,033 APPLICATIONS WITHDRAWN 1 $129,920 10 $114,020 97 $146,554 5 $38,814 0 $0 6 $144,552 FILES CLOSED FOR INCOMPLETENESS 1 $127,730 6 $81,675 22 $129,246 0 $0 0 $0 2 $84,475
Aggregated Statistics For Year 2001(Based on 4 partial tracts) A) FHA, FSA/RHS & VA B) Conventional C) Refinancings D) Home Improvement Loans E) Loans on Dwellings For 5+ Families F) Non-occupant Loans on Number Average Value Number Average Value Number Average Value Number Average Value Number Average Value Number Average Value
LOANS ORIGINATED 46 $149,467 119 $123,776 361 $126,621 29 $21,160 2 $3,930,680 34 $136,202 APPLICATIONS APPROVED, NOT ACCEPTED 2 $114,425 12 $107,777 44 $143,923 7 $50,651 0 $0 8 $134,629 APPLICATIONS DENIED 2 $141,195 31 $89,289 105 $123,171 23 $24,073 0 $0 4 $105,532 APPLICATIONS WITHDRAWN 3 $159,093 16 $124,148 84 $125,711 5 $53,090 0 $0 3 $133,857 FILES CLOSED FOR INCOMPLETENESS 1 $140,680 2 $148,035 18 $124,993 1 $24,630 0 $0 0 $0
Aggregated Statistics For Year 2000(Based on 4 partial tracts) A) FHA, FSA/RHS & VA B) Conventional C) Refinancings D) Home Improvement Loans F) Non-occupant Loans on Number Average Value Number Average Value Number Average Value Number Average Value Number Average Value
LOANS ORIGINATED 36 $147,175 108 $116,382 92 $114,322 31 $23,844 25 $123,451 APPLICATIONS APPROVED, NOT ACCEPTED 2 $117,275 18 $98,483 21 $114,338 8 $22,901 3 $69,920 APPLICATIONS DENIED 9 $128,957 36 $97,609 75 $106,611 23 $25,227 2 $198,570 APPLICATIONS WITHDRAWN 6 $139,497 12 $90,377 35 $105,536 8 $99,448 3 $73,360 FILES CLOSED FOR INCOMPLETENESS 1 $138,560 1 $140,470 16 $121,394 2 $22,345 1 $206,480
Aggregated Statistics For Year 1999(Based on 3 partial tracts) A) FHA, FSA/RHS & VA B) Conventional C) Refinancings D) Home Improvement Loans E) Loans on Dwellings For 5+ Families F) Non-occupant Loans on Number Average Value Number Average Value Number Average Value Number Average Value Number Average Value Number Average Value
LOANS ORIGINATED 34 $139,339 120 $129,126 200 $114,109 30 $21,054 1 $277,570 39 $116,226 APPLICATIONS APPROVED, NOT ACCEPTED 0 $0 20 $109,936 49 $118,781 10 $21,720 1 $86,670 2 $143,340 APPLICATIONS DENIED 3 $157,903 46 $98,498 82 $133,423 23 $28,380 0 $0 7 $143,296 APPLICATIONS WITHDRAWN 3 $125,480 13 $100,641 53 $99,049 5 $78,938 1 $127,600 5 $107,658 FILES CLOSED FOR INCOMPLETENESS 2 $150,800 1 $90,390 30 $123,740 0 $0 0 $0 4 $138,140
Detailed HMDA statistics for the following Tracts:
0217.00
, 0219.00 , 0220.00 , 0221.01
Private Mortgage Insurance Companies Aggregated Statistics For Year 2009(Based on 4 partial tracts) A) Conventional B) Refinancings Number Average Value Number Average Value
LOANS ORIGINATED 3 $193,883 4 $233,045 APPLICATIONS APPROVED, NOT ACCEPTED 1 $192,670 2 $255,695 APPLICATIONS DENIED 0 $0 4 $196,002 APPLICATIONS WITHDRAWN 1 $298,850 0 $0 FILES CLOSED FOR INCOMPLETENESS 0 $0 0 $0
Aggregated Statistics For Year 2008(Based on 4 partial tracts) A) Conventional B) Refinancings C) Non-occupant Loans on Number Average Value Number Average Value Number Average Value
LOANS ORIGINATED 31 $231,748 18 $248,074 2 $248,585 APPLICATIONS APPROVED, NOT ACCEPTED 6 $256,673 7 $260,183 2 $217,795 APPLICATIONS DENIED 2 $279,885 1 $334,170 0 $0 APPLICATIONS WITHDRAWN 3 $242,347 2 $206,075 0 $0 FILES CLOSED FOR INCOMPLETENESS 1 $199,760 1 $208,290 0 $0
Aggregated Statistics For Year 2007(Based on 4 partial tracts) A) Conventional B) Refinancings C) Non-occupant Loans on Number Average Value Number Average Value Number Average Value
LOANS ORIGINATED 35 $260,807 21 $237,807 5 $235,364 APPLICATIONS APPROVED, NOT ACCEPTED 2 $256,080 6 $208,080 1 $166,420 APPLICATIONS DENIED 1 $164,960 1 $257,370 0 $0 APPLICATIONS WITHDRAWN 3 $216,047 3 $250,073 2 $193,490 FILES CLOSED FOR INCOMPLETENESS 0 $0 0 $0 0 $0
Aggregated Statistics For Year 2006(Based on 4 partial tracts) A) Conventional B) Refinancings Number Average Value Number Average Value
LOANS ORIGINATED 14 $231,871 8 $218,435 APPLICATIONS APPROVED, NOT ACCEPTED 2 $240,150 1 $345,920 APPLICATIONS DENIED 0 $0 1 $155,930 APPLICATIONS WITHDRAWN 1 $200,230 1 $306,030 FILES CLOSED FOR INCOMPLETENESS 0 $0 0 $0
Aggregated Statistics For Year 2005(Based on 4 partial tracts) A) Conventional B) Refinancings C) Non-occupant Loans on Number Average Value Number Average Value Number Average Value
LOANS ORIGINATED 19 $190,546 18 $180,698 5 $135,180 APPLICATIONS APPROVED, NOT ACCEPTED 3 $149,717 9 $161,751 1 $143,990 APPLICATIONS DENIED 0 $0 1 $200,140 0 $0 APPLICATIONS WITHDRAWN 3 $201,360 0 $0 0 $0 FILES CLOSED FOR INCOMPLETENESS 0 $0 0 $0 0 $0
Aggregated Statistics For Year 2004(Based on 4 partial tracts) A) Conventional B) Refinancings C) Non-occupant Loans on D) Loans On Manufactured Number Average Value Number Average Value Number Average Value Number Average Value
LOANS ORIGINATED 18 $171,278 14 $171,116 2 $179,145 2 $125,570 APPLICATIONS APPROVED, NOT ACCEPTED 3 $148,167 7 $172,576 1 $165,180 0 $0 APPLICATIONS DENIED 0 $0 0 $0 0 $0 0 $0 APPLICATIONS WITHDRAWN 0 $0 1 $150,330 0 $0 0 $0 FILES CLOSED FOR INCOMPLETENESS 0 $0 0 $0 0 $0 0 $0
Aggregated Statistics For Year 2003(Based on 4 partial tracts) A) Conventional B) Refinancings C) Non-occupant Loans on Number Average Value Number Average Value Number Average Value
LOANS ORIGINATED 38 $165,182 61 $158,157 4 $165,872 APPLICATIONS APPROVED, NOT ACCEPTED 6 $143,670 19 $176,198 1 $134,730 APPLICATIONS DENIED 0 $0 2 $194,250 0 $0 APPLICATIONS WITHDRAWN 1 $168,260 2 $140,940 0 $0 FILES CLOSED FOR INCOMPLETENESS 0 $0 0 $0 0 $0
Aggregated Statistics For Year 2002(Based on 4 partial tracts) A) Conventional B) Refinancings C) Non-occupant Loans on Number Average Value Number Average Value Number Average Value
LOANS ORIGINATED 24 $156,149 41 $144,850 1 $197,360 APPLICATIONS APPROVED, NOT ACCEPTED 2 $171,085 8 $164,490 1 $189,040 APPLICATIONS DENIED 0 $0 2 $126,260 0 $0 APPLICATIONS WITHDRAWN 1 $175,640 1 $176,740 0 $0 FILES CLOSED FOR INCOMPLETENESS 0 $0 0 $0 0 $0
Aggregated Statistics For Year 2001(Based on 4 partial tracts) A) Conventional B) Refinancings C) Non-occupant Loans on Number Average Value Number Average Value Number Average Value
LOANS ORIGINATED 27 $152,985 44 $157,955 3 $133,893 APPLICATIONS APPROVED, NOT ACCEPTED 1 $216,690 11 $158,656 2 $122,885 APPLICATIONS DENIED 4 $128,322 3 $153,087 0 $0 APPLICATIONS WITHDRAWN 0 $0 2 $229,115 0 $0 FILES CLOSED FOR INCOMPLETENESS 0 $0 0 $0 0 $0
Aggregated Statistics For Year 2000(Based on 4 partial tracts) A) Conventional B) Refinancings C) Non-occupant Loans on Number Average Value Number Average Value Number Average Value
LOANS ORIGINATED 34 $139,520 18 $148,561 5 $102,316 APPLICATIONS APPROVED, NOT ACCEPTED 3 $129,257 2 $129,730 0 $0 APPLICATIONS DENIED 2 $197,165 0 $0 0 $0 APPLICATIONS WITHDRAWN 3 $137,653 2 $138,555 0 $0 FILES CLOSED FOR INCOMPLETENESS 2 $134,030 1 $103,240 0 $0
Aggregated Statistics For Year 1999(Based on 3 partial tracts) A) Conventional B) Refinancings C) Non-occupant Loans on Number Average Value Number Average Value Number Average Value
LOANS ORIGINATED 47 $146,841 21 $141,250 5 $119,042 APPLICATIONS APPROVED, NOT ACCEPTED 2 $141,440 5 $165,044 1 $93,340 APPLICATIONS DENIED 3 $147,997 4 $140,090 1 $170,380 APPLICATIONS WITHDRAWN 2 $126,320 4 $144,715 0 $0 FILES CLOSED FOR INCOMPLETENESS 0 $0 0 $0 0 $0
Detailed PMIC statistics for the following Tracts:
0217.00
, 0219.00 , 0220.00 , 0221.01 Fire-safe hotels and motels in Gladstone, Oregon:
Holiday Inn Express Portland Se-Clackamas Area, 75 82 nd Dr, Gladstone, Oregon 97027 Phone: (503) 722-7777, Fax: (503) 722-8600
Budget Inn, 19240 SE Mcloughlin Blvd, Gladstone, Oregon 97027 Phone: (503) 656-1955, Fax: (503) 657-9301
All 2 fire-safe hotels and motels in Gladstone, Oregon
Most common first names in Gladstone, OR among deceased individuals Name Count Lived (average)
William 66 76.3 years Mary 57 80.0 years James 55 70.0 years John 54 77.3 years Robert 52 67.9 years Helen 45 79.2 years Margaret 45 78.2 years Charles 36 79.8 years Harold 35 75.0 years George 32 79.4 years
Most common last names in Gladstone, OR among deceased individuals Last name Count Lived (average)
Smith 41 76.7 years Johnson 29 80.6 years Miller 20 82.6 years Brown 20 80.2 years Wilson 17 78.0 years Williams 16 70.6 years Anderson 15 81.8 years Nelson 13 73.5 years Jones 12 76.1 years Davis 12 61.7 years
Gladstone compared to Oregon state average:
Unemployed percentage below state average. Foreign-born population percentage below state average. Length of stay since moving in significantly above state average.
#26 on the list of "Top 101 cities with largest percentage of females in occupations: office and administrative support occupations (population 5,000+)"
#59 (97015) on the list of "Top 101 zip codes with the largest percentage of Ukrainian first ancestries (pop 5,000+)"
#27 on the list of "Top 101 counties with the highest percentage of residents that exercised in the past month"
#31 on the list of "Top 101 counties with the highest surface withdrawal of fresh water for public supply"
#44 on the list of "Top 101 counties with the highest total withdrawal of fresh water for public supply"
#48 on the list of "Top 101 counties with the highest percentage of residents that keep firearms around their homes"
#78 on the list of "Top 101 counties with the lowest number of births per 1000 residents 2007-2013"
Top Patent Applicants
Frederick D. Wilmot (8)
Frederick Dean Wilmot (6)
Thomas Middleton Semmes (3)
Marcus Hannon Geroux (2)
Daniel Ray Enyeart (2)
Dane Nelson Wenzel (2)
Gabriele R. Holmes (2)
Gary N. Mills (1)
Scott Cook (1)
Chris Lee (1)
Total of 33 patent applications in 2008-2024.
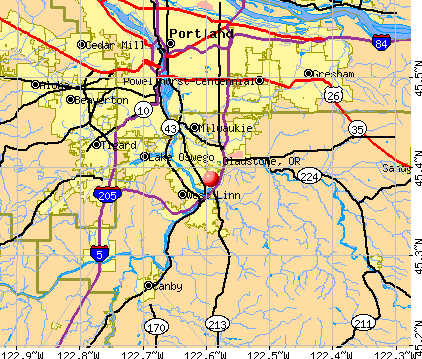


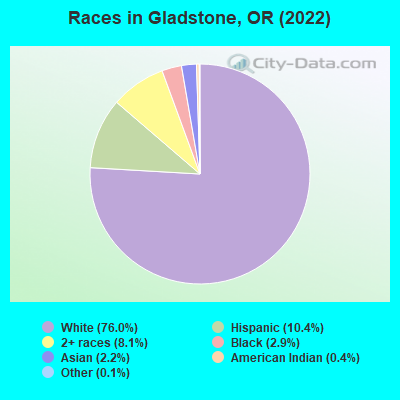
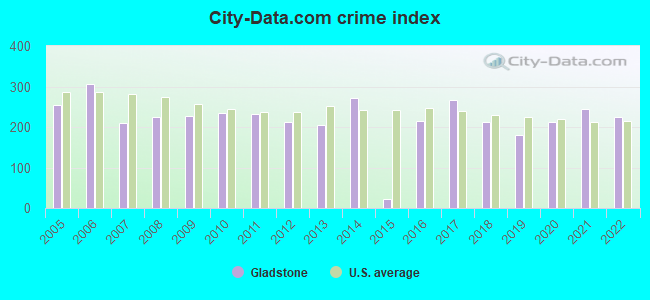
 Recent articles from our blog. Our writers, many of them Ph.D. graduates or candidates, create easy-to-read articles on a wide variety of topics.

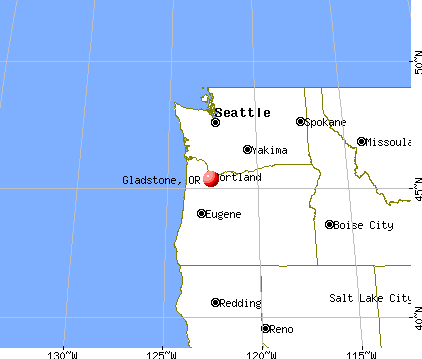
 , pop. 224,220).
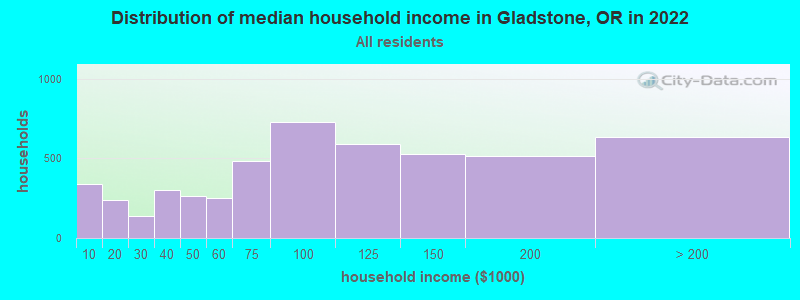
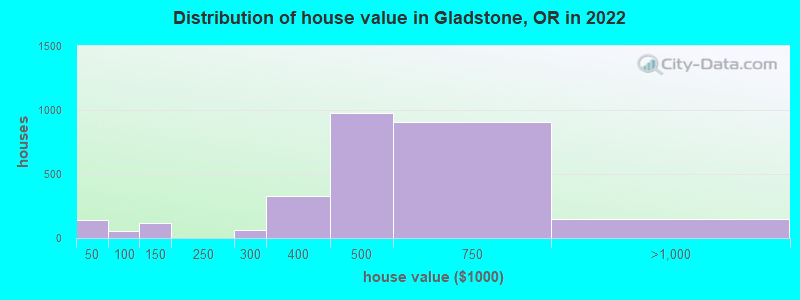
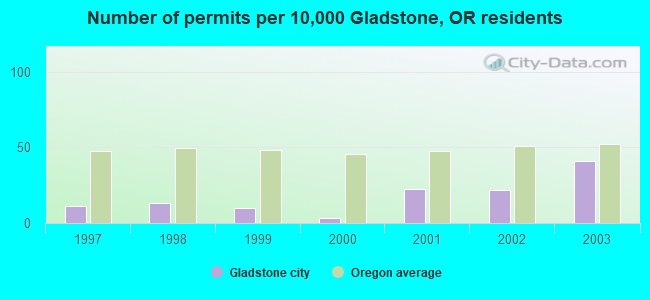
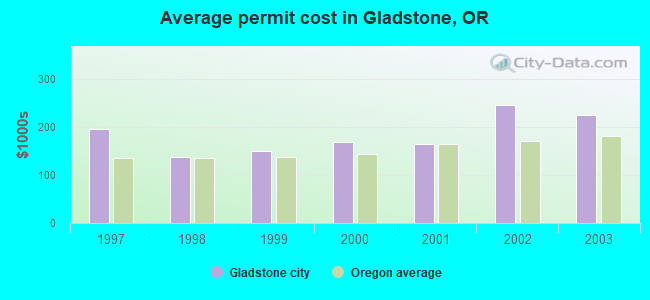
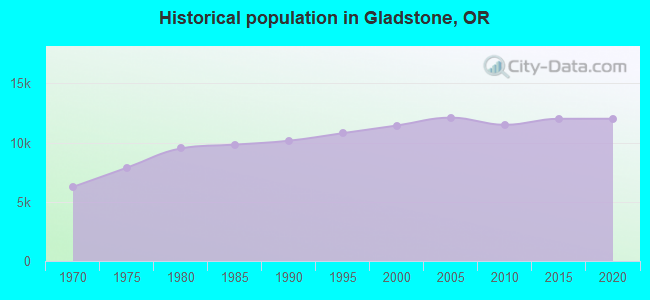
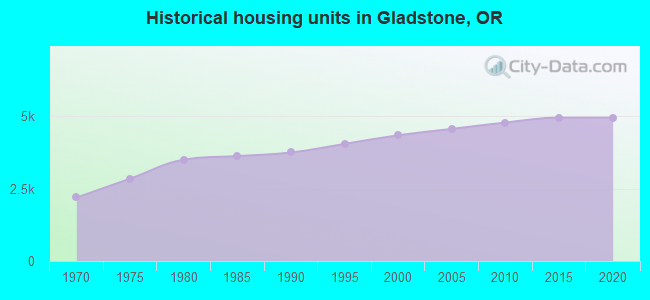
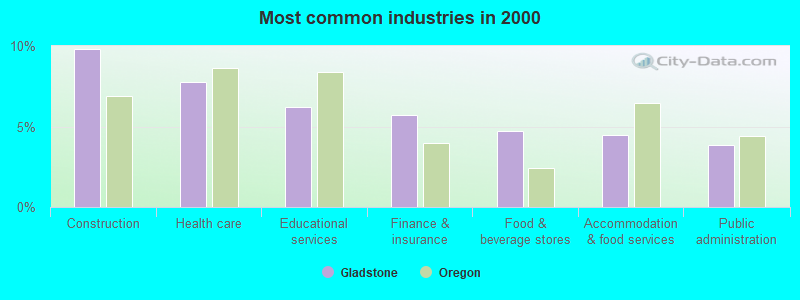
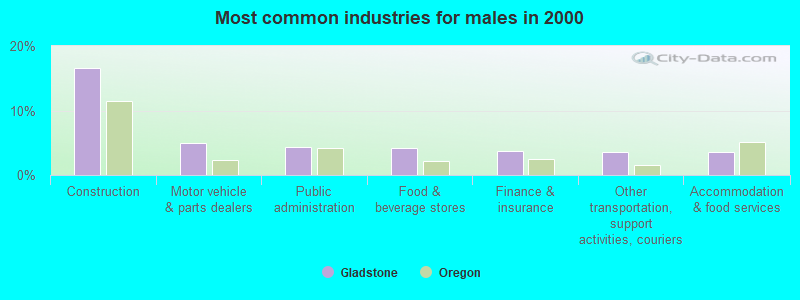
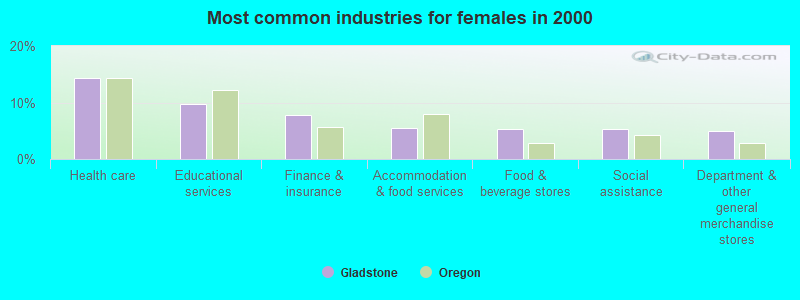
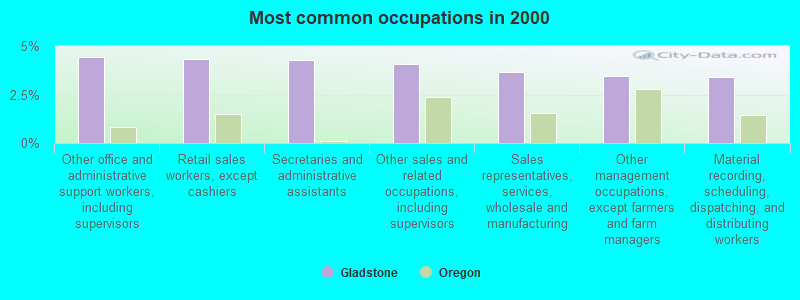
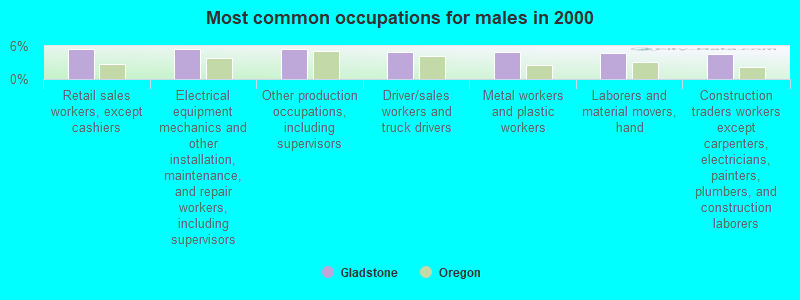
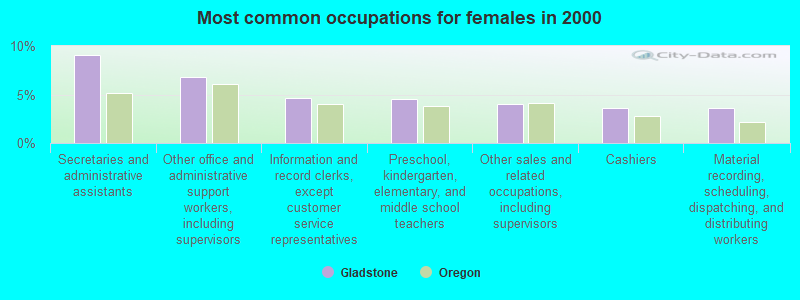
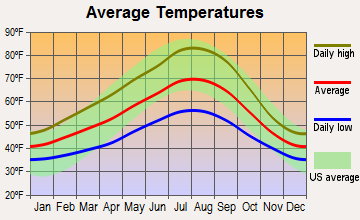
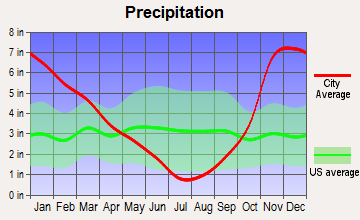
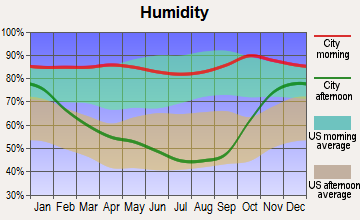
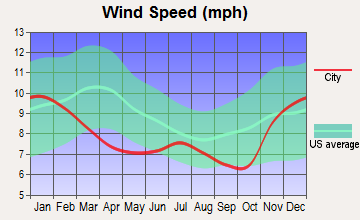
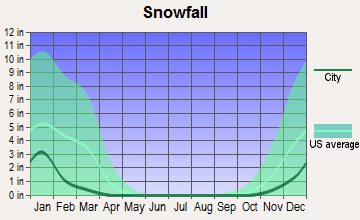
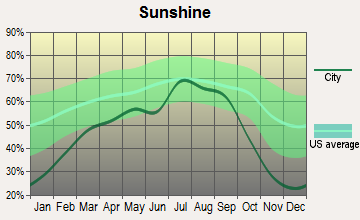
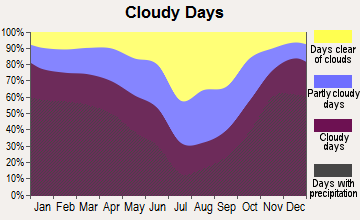
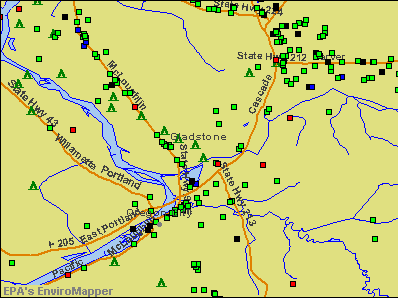

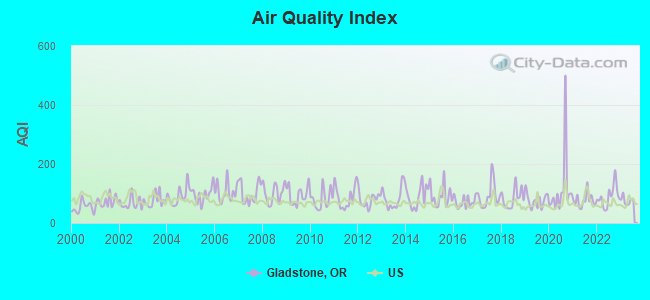
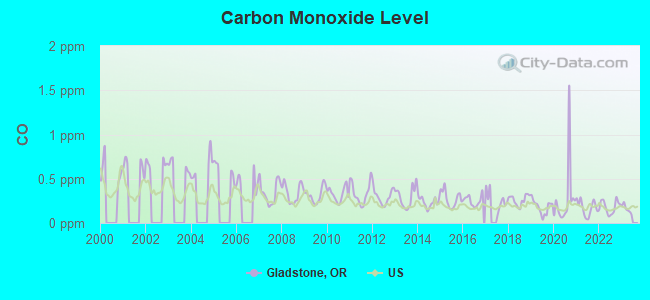
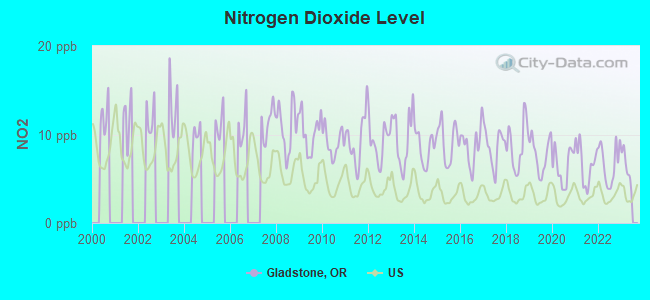
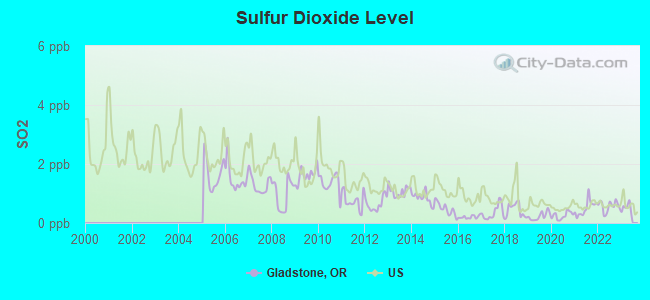
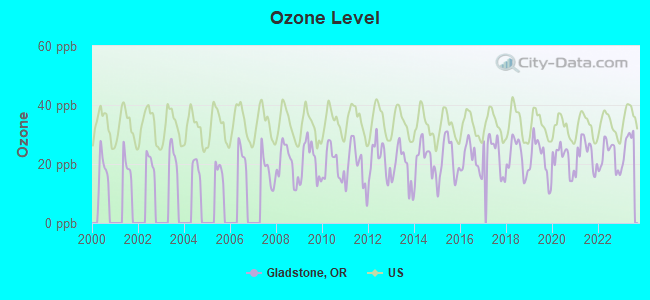
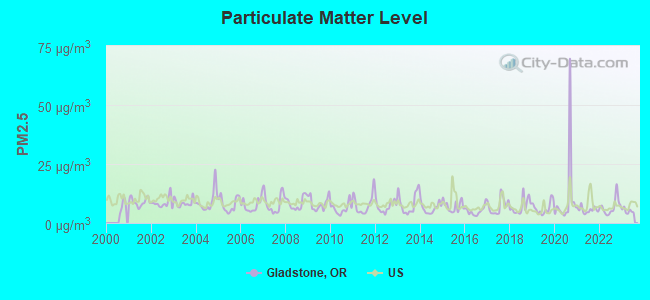
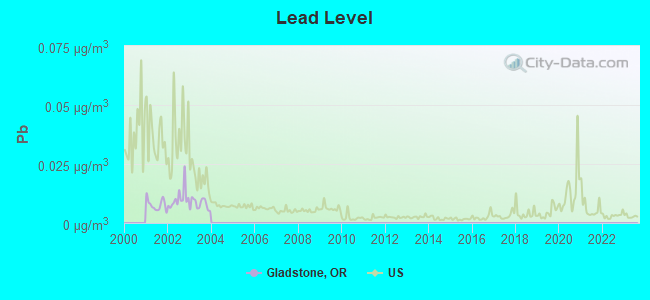
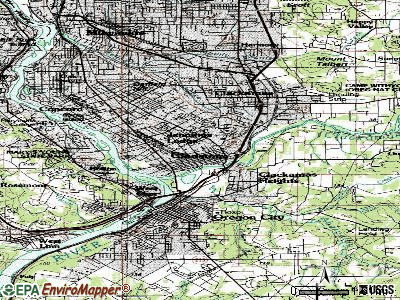
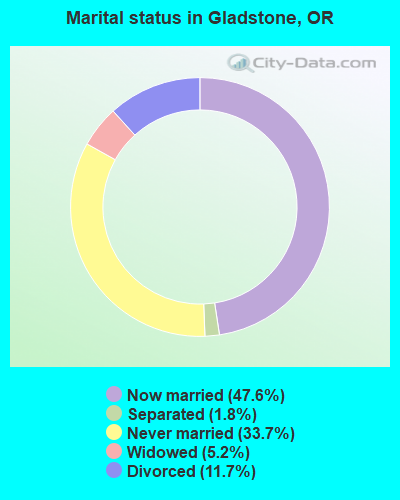
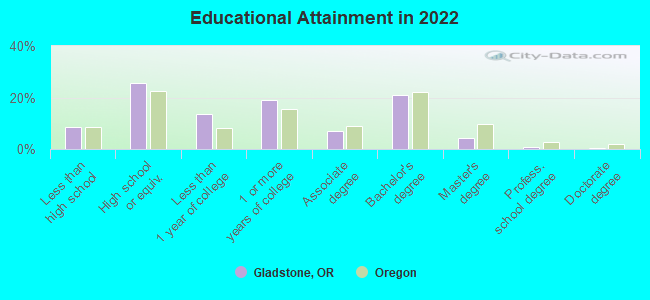
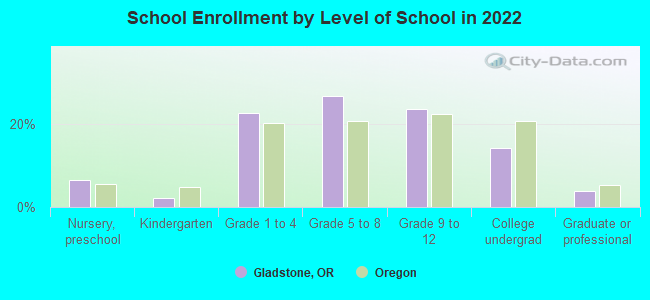
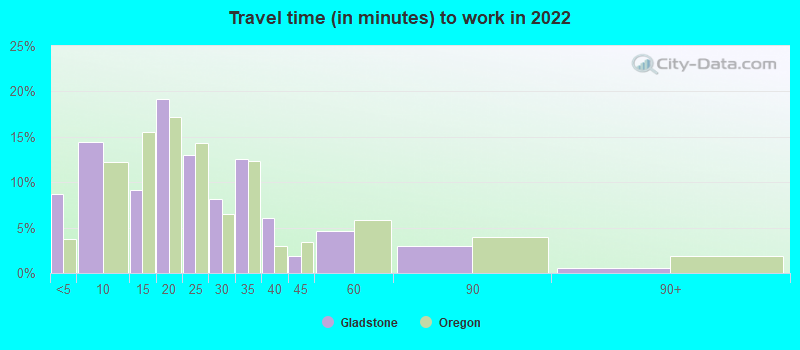
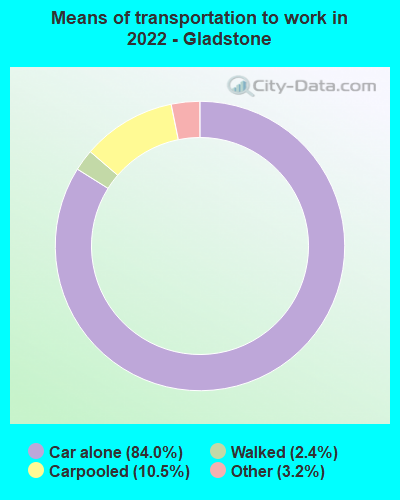
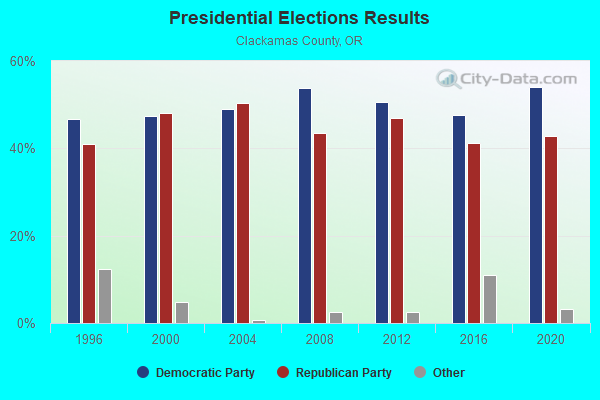
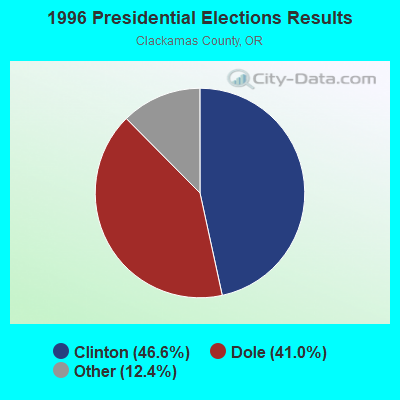
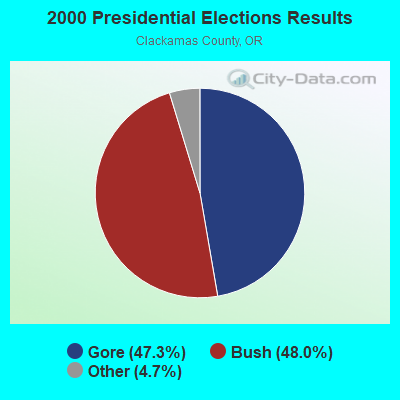
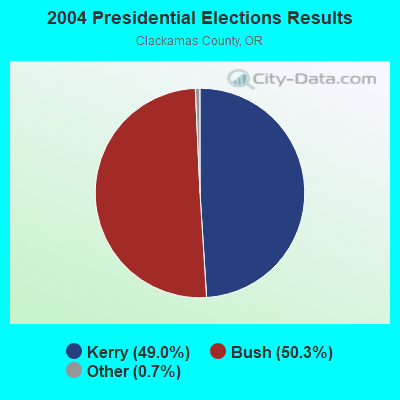

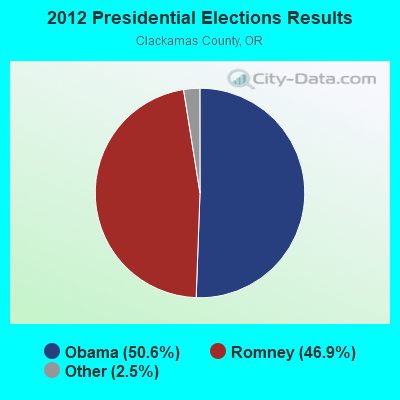
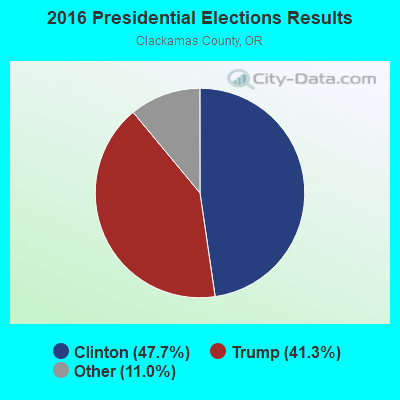
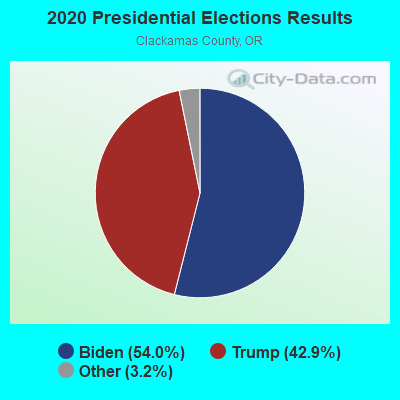
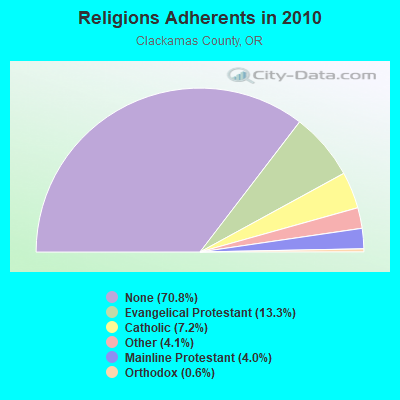
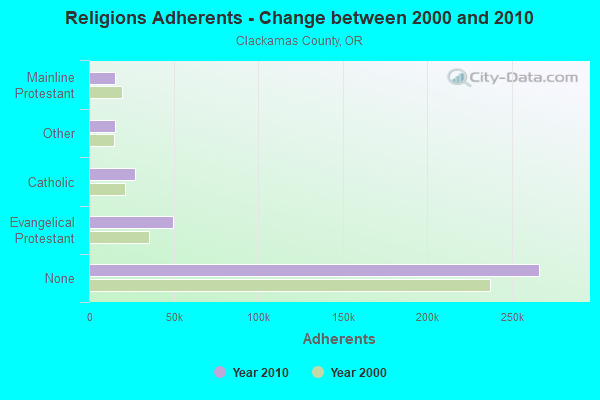
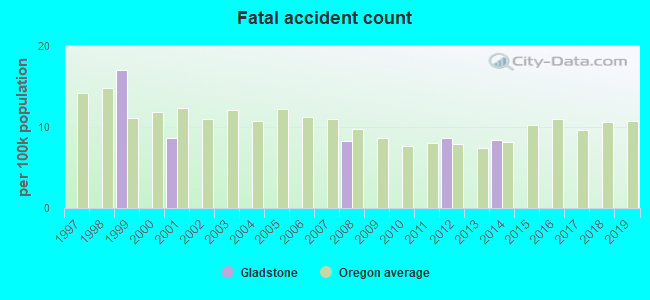
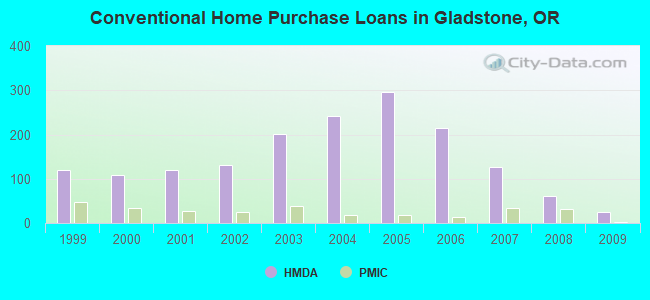
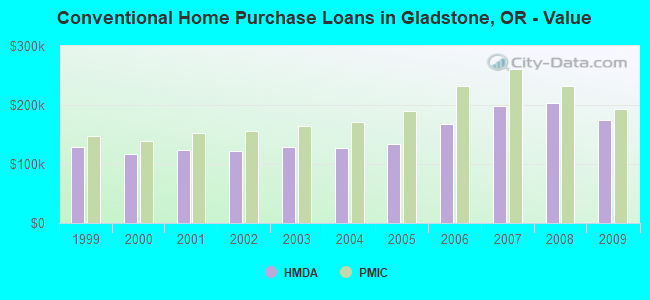
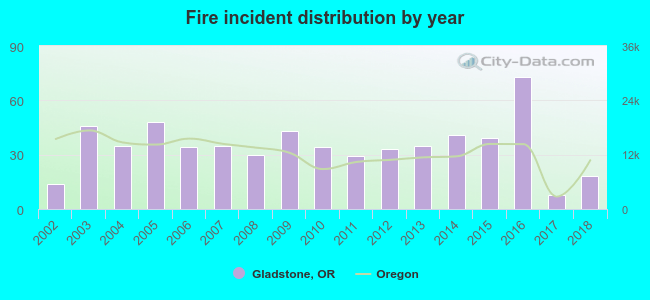 Based on the data from the years 2002 - 2018 the average number of fire incidents per year is 35. The highest number of fires - 73 took place in 2016, and the least - 8 in 2017. The data has a growing trend.
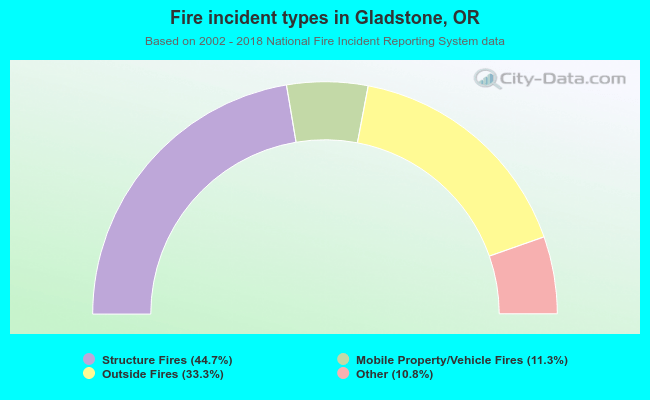 When looking into fire subcategories, the most incidents belonged to: Structure Fires (44.7%), and Outside Fires (33.3%).