Petal, Mississippi Submit your own pictures of this city and show them to the world
OSM Map
General Map
Google Map
MSN Map
OSM Map
General Map
Google Map
MSN Map
OSM Map
General Map
Google Map
MSN Map
OSM Map
General Map
Google Map
MSN Map
Please wait while loading the map...
Population in 2022: 11,230 (86% urban, 14% rural). Population change since 2000: +48.2%Males: 5,084 Females: 6,146
March 2022 cost of living index in Petal: 79.6 (low, U.S. average is 100) Percentage of residents living in poverty in 2022: 13.9%for White Non-Hispanic residents , 19.1% for Black residents , 82.3% for Hispanic or Latino residents , 79.0% for other race residents , 5.8% for two or more races residents )
Profiles of local businesses
Business Search - 14 Million verified businesses
Data:
Median household income ($)
Median household income (% change since 2000)
Household income diversity
Ratio of average income to average house value (%)
Ratio of average income to average rent
Median household income ($) - White
Median household income ($) - Black or African American
Median household income ($) - Asian
Median household income ($) - Hispanic or Latino
Median household income ($) - American Indian and Alaska Native
Median household income ($) - Multirace
Median household income ($) - Other Race
Median household income for houses/condos with a mortgage ($)
Median household income for apartments without a mortgage ($)
Races - White alone (%)
Races - White alone (% change since 2000)
Races - Black alone (%)
Races - Black alone (% change since 2000)
Races - American Indian alone (%)
Races - American Indian alone (% change since 2000)
Races - Asian alone (%)
Races - Asian alone (% change since 2000)
Races - Hispanic (%)
Races - Hispanic (% change since 2000)
Races - Native Hawaiian and Other Pacific Islander alone (%)
Races - Native Hawaiian and Other Pacific Islander alone (% change since 2000)
Races - Two or more races (%)
Races - Two or more races (% change since 2000)
Races - Other race alone (%)
Races - Other race alone (% change since 2000)
Racial diversity
Unemployment (%)
Unemployment (% change since 2000)
Unemployment (%) - White
Unemployment (%) - Black or African American
Unemployment (%) - Asian
Unemployment (%) - Hispanic or Latino
Unemployment (%) - American Indian and Alaska Native
Unemployment (%) - Multirace
Unemployment (%) - Other Race
Population density (people per square mile)
Population - Males (%)
Population - Females (%)
Population - Males (%) - White
Population - Males (%) - Black or African American
Population - Males (%) - Asian
Population - Males (%) - Hispanic or Latino
Population - Males (%) - American Indian and Alaska Native
Population - Males (%) - Multirace
Population - Males (%) - Other Race
Population - Females (%) - White
Population - Females (%) - Black or African American
Population - Females (%) - Asian
Population - Females (%) - Hispanic or Latino
Population - Females (%) - American Indian and Alaska Native
Population - Females (%) - Multirace
Population - Females (%) - Other Race
Coronavirus confirmed cases (May 13, 2024)
Deaths caused by coronavirus (May 13, 2024)
Coronavirus confirmed cases (per 100k population) (May 13, 2024)
Deaths caused by coronavirus (per 100k population) (May 13, 2024)
Daily increase in number of cases (May 13, 2024)
Weekly increase in number of cases (May 13, 2024)
Cases doubled (in days) (May 13, 2024)
Hospitalized patients (Apr 18, 2022)
Negative test results (Apr 18, 2022)
Total test results (Apr 18, 2022)
COVID Vaccine doses distributed (per 100k population) (Sep 19, 2023)
COVID Vaccine doses administered (per 100k population) (Sep 19, 2023)
COVID Vaccine doses distributed (Sep 19, 2023)
COVID Vaccine doses administered (Sep 19, 2023)
Likely homosexual households (%)
Likely homosexual households (% change since 2000)
Likely homosexual households - Lesbian couples (%)
Likely homosexual households - Lesbian couples (% change since 2000)
Likely homosexual households - Gay men (%)
Likely homosexual households - Gay men (% change since 2000)
Cost of living index
Median gross rent ($)
Median contract rent ($)
Median monthly housing costs ($)
Median house or condo value ($)
Median house or condo value ($ change since 2000)
Mean house or condo value by units in structure - 1, detached ($)
Mean house or condo value by units in structure - 1, attached ($)
Mean house or condo value by units in structure - 2 ($)
Mean house or condo value by units in structure by units in structure - 3 or 4 ($)
Mean house or condo value by units in structure - 5 or more ($)
Mean house or condo value by units in structure - Boat, RV, van, etc. ($)
Mean house or condo value by units in structure - Mobile home ($)
Median house or condo value ($) - White
Median house or condo value ($) - Black or African American
Median house or condo value ($) - Asian
Median house or condo value ($) - Hispanic or Latino
Median house or condo value ($) - American Indian and Alaska Native
Median house or condo value ($) - Multirace
Median house or condo value ($) - Other Race
Median resident age
Resident age diversity
Median resident age - Males
Median resident age - Females
Median resident age - White
Median resident age - Black or African American
Median resident age - Asian
Median resident age - Hispanic or Latino
Median resident age - American Indian and Alaska Native
Median resident age - Multirace
Median resident age - Other Race
Median resident age - Males - White
Median resident age - Males - Black or African American
Median resident age - Males - Asian
Median resident age - Males - Hispanic or Latino
Median resident age - Males - American Indian and Alaska Native
Median resident age - Males - Multirace
Median resident age - Males - Other Race
Median resident age - Females - White
Median resident age - Females - Black or African American
Median resident age - Females - Asian
Median resident age - Females - Hispanic or Latino
Median resident age - Females - American Indian and Alaska Native
Median resident age - Females - Multirace
Median resident age - Females - Other Race
Commute - mean travel time to work (minutes)
Travel time to work - Less than 5 minutes (%)
Travel time to work - Less than 5 minutes (% change since 2000)
Travel time to work - 5 to 9 minutes (%)
Travel time to work - 5 to 9 minutes (% change since 2000)
Travel time to work - 10 to 19 minutes (%)
Travel time to work - 10 to 19 minutes (% change since 2000)
Travel time to work - 20 to 29 minutes (%)
Travel time to work - 20 to 29 minutes (% change since 2000)
Travel time to work - 30 to 39 minutes (%)
Travel time to work - 30 to 39 minutes (% change since 2000)
Travel time to work - 40 to 59 minutes (%)
Travel time to work - 40 to 59 minutes (% change since 2000)
Travel time to work - 60 to 89 minutes (%)
Travel time to work - 60 to 89 minutes (% change since 2000)
Travel time to work - 90 or more minutes (%)
Travel time to work - 90 or more minutes (% change since 2000)
Marital status - Never married (%)
Marital status - Now married (%)
Marital status - Separated (%)
Marital status - Widowed (%)
Marital status - Divorced (%)
Median family income ($)
Median family income (% change since 2000)
Median non-family income ($)
Median non-family income (% change since 2000)
Median per capita income ($)
Median per capita income (% change since 2000)
Median family income ($) - White
Median family income ($) - Black or African American
Median family income ($) - Asian
Median family income ($) - Hispanic or Latino
Median family income ($) - American Indian and Alaska Native
Median family income ($) - Multirace
Median family income ($) - Other Race
Median year house/condo built
Median year apartment built
Year house built - Built 2005 or later (%)
Year house built - Built 2000 to 2004 (%)
Year house built - Built 1990 to 1999 (%)
Year house built - Built 1980 to 1989 (%)
Year house built - Built 1970 to 1979 (%)
Year house built - Built 1960 to 1969 (%)
Year house built - Built 1950 to 1959 (%)
Year house built - Built 1940 to 1949 (%)
Year house built - Built 1939 or earlier (%)
Average household size
Household density (households per square mile)
Average household size - White
Average household size - Black or African American
Average household size - Asian
Average household size - Hispanic or Latino
Average household size - American Indian and Alaska Native
Average household size - Multirace
Average household size - Other Race
Occupied housing units (%)
Vacant housing units (%)
Owner occupied housing units (%)
Renter occupied housing units (%)
Vacancy status - For rent (%)
Vacancy status - For sale only (%)
Vacancy status - Rented or sold, not occupied (%)
Vacancy status - For seasonal, recreational, or occasional use (%)
Vacancy status - For migrant workers (%)
Vacancy status - Other vacant (%)
Residents with income below the poverty level (%)
Residents with income below 50% of the poverty level (%)
Children below poverty level (%)
Poor families by family type - Married-couple family (%)
Poor families by family type - Male, no wife present (%)
Poor families by family type - Female, no husband present (%)
Poverty status for native-born residents (%)
Poverty status for foreign-born residents (%)
Poverty among high school graduates not in families (%)
Poverty among people who did not graduate high school not in families (%)
Residents with income below the poverty level (%) - White
Residents with income below the poverty level (%) - Black or African American
Residents with income below the poverty level (%) - Asian
Residents with income below the poverty level (%) - Hispanic or Latino
Residents with income below the poverty level (%) - American Indian and Alaska Native
Residents with income below the poverty level (%) - Multirace
Residents with income below the poverty level (%) - Other Race
Air pollution - Air Quality Index (AQI)
Air pollution - CO
Air pollution - NO2
Air pollution - SO2
Air pollution - Ozone
Air pollution - PM10
Air pollution - PM25
Air pollution - Pb
Crime - Murders per 100,000 population
Crime - Rapes per 100,000 population
Crime - Robberies per 100,000 population
Crime - Assaults per 100,000 population
Crime - Burglaries per 100,000 population
Crime - Thefts per 100,000 population
Crime - Auto thefts per 100,000 population
Crime - Arson per 100,000 population
Crime - City-data.com crime index
Crime - Violent crime index
Crime - Property crime index
Crime - Murders per 100,000 population (5 year average)
Crime - Rapes per 100,000 population (5 year average)
Crime - Robberies per 100,000 population (5 year average)
Crime - Assaults per 100,000 population (5 year average)
Crime - Burglaries per 100,000 population (5 year average)
Crime - Thefts per 100,000 population (5 year average)
Crime - Auto thefts per 100,000 population (5 year average)
Crime - Arson per 100,000 population (5 year average)
Crime - City-data.com crime index (5 year average)
Crime - Violent crime index (5 year average)
Crime - Property crime index (5 year average)
1996 Presidential Elections Results (%) - Democratic Party (Clinton)
1996 Presidential Elections Results (%) - Republican Party (Dole)
1996 Presidential Elections Results (%) - Other
2000 Presidential Elections Results (%) - Democratic Party (Gore)
2000 Presidential Elections Results (%) - Republican Party (Bush)
2000 Presidential Elections Results (%) - Other
2004 Presidential Elections Results (%) - Democratic Party (Kerry)
2004 Presidential Elections Results (%) - Republican Party (Bush)
2004 Presidential Elections Results (%) - Other
2008 Presidential Elections Results (%) - Democratic Party (Obama)
2008 Presidential Elections Results (%) - Republican Party (McCain)
2008 Presidential Elections Results (%) - Other
2012 Presidential Elections Results (%) - Democratic Party (Obama)
2012 Presidential Elections Results (%) - Republican Party (Romney)
2012 Presidential Elections Results (%) - Other
2016 Presidential Elections Results (%) - Democratic Party (Clinton)
2016 Presidential Elections Results (%) - Republican Party (Trump)
2016 Presidential Elections Results (%) - Other
2020 Presidential Elections Results (%) - Democratic Party (Biden)
2020 Presidential Elections Results (%) - Republican Party (Trump)
2020 Presidential Elections Results (%) - Other
Ancestries Reported - Arab (%)
Ancestries Reported - Czech (%)
Ancestries Reported - Danish (%)
Ancestries Reported - Dutch (%)
Ancestries Reported - English (%)
Ancestries Reported - French (%)
Ancestries Reported - French Canadian (%)
Ancestries Reported - German (%)
Ancestries Reported - Greek (%)
Ancestries Reported - Hungarian (%)
Ancestries Reported - Irish (%)
Ancestries Reported - Italian (%)
Ancestries Reported - Lithuanian (%)
Ancestries Reported - Norwegian (%)
Ancestries Reported - Polish (%)
Ancestries Reported - Portuguese (%)
Ancestries Reported - Russian (%)
Ancestries Reported - Scotch-Irish (%)
Ancestries Reported - Scottish (%)
Ancestries Reported - Slovak (%)
Ancestries Reported - Subsaharan African (%)
Ancestries Reported - Swedish (%)
Ancestries Reported - Swiss (%)
Ancestries Reported - Ukrainian (%)
Ancestries Reported - United States (%)
Ancestries Reported - Welsh (%)
Ancestries Reported - West Indian (%)
Ancestries Reported - Other (%)
Educational Attainment - No schooling completed (%)
Educational Attainment - Less than high school (%)
Educational Attainment - High school or equivalent (%)
Educational Attainment - Less than 1 year of college (%)
Educational Attainment - 1 or more years of college (%)
Educational Attainment - Associate degree (%)
Educational Attainment - Bachelor's degree (%)
Educational Attainment - Master's degree (%)
Educational Attainment - Professional school degree (%)
Educational Attainment - Doctorate degree (%)
School Enrollment - Nursery, preschool (%)
School Enrollment - Kindergarten (%)
School Enrollment - Grade 1 to 4 (%)
School Enrollment - Grade 5 to 8 (%)
School Enrollment - Grade 9 to 12 (%)
School Enrollment - College undergrad (%)
School Enrollment - Graduate or professional (%)
School Enrollment - Not enrolled in school (%)
School enrollment - Public schools (%)
School enrollment - Private schools (%)
School enrollment - Not enrolled (%)
Median number of rooms in houses and condos
Median number of rooms in apartments
Housing units lacking complete plumbing facilities (%)
Housing units lacking complete kitchen facilities (%)
Density of houses
Urban houses (%)
Rural houses (%)
Households with people 60 years and over (%)
Households with people 65 years and over (%)
Households with people 75 years and over (%)
Households with one or more nonrelatives (%)
Households with no nonrelatives (%)
Population in households (%)
Family households (%)
Nonfamily households (%)
Population in families (%)
Family households with own children (%)
Median number of bedrooms in owner occupied houses
Mean number of bedrooms in owner occupied houses
Median number of bedrooms in renter occupied houses
Mean number of bedrooms in renter occupied houses
Median number of vehichles in owner occupied houses
Mean number of vehichles in owner occupied houses
Median number of vehichles in renter occupied houses
Mean number of vehichles in renter occupied houses
Mortgage status - with mortgage (%)
Mortgage status - with second mortgage (%)
Mortgage status - with home equity loan (%)
Mortgage status - with both second mortgage and home equity loan (%)
Mortgage status - without a mortgage (%)
Average family size
Average family size - White
Average family size - Black or African American
Average family size - Asian
Average family size - Hispanic or Latino
Average family size - American Indian and Alaska Native
Average family size - Multirace
Average family size - Other Race
Geographical mobility - Same house 1 year ago (%)
Geographical mobility - Moved within same county (%)
Geographical mobility - Moved from different county within same state (%)
Geographical mobility - Moved from different state (%)
Geographical mobility - Moved from abroad (%)
Place of birth - Born in state of residence (%)
Place of birth - Born in other state (%)
Place of birth - Native, outside of US (%)
Place of birth - Foreign born (%)
Housing units in structures - 1, detached (%)
Housing units in structures - 1, attached (%)
Housing units in structures - 2 (%)
Housing units in structures - 3 or 4 (%)
Housing units in structures - 5 to 9 (%)
Housing units in structures - 10 to 19 (%)
Housing units in structures - 20 to 49 (%)
Housing units in structures - 50 or more (%)
Housing units in structures - Mobile home (%)
Housing units in structures - Boat, RV, van, etc. (%)
House/condo owner moved in on average (years ago)
Renter moved in on average (years ago)
Year householder moved into unit - Moved in 1999 to March 2000 (%)
Year householder moved into unit - Moved in 1995 to 1998 (%)
Year householder moved into unit - Moved in 1990 to 1994 (%)
Year householder moved into unit - Moved in 1980 to 1989 (%)
Year householder moved into unit - Moved in 1970 to 1979 (%)
Year householder moved into unit - Moved in 1969 or earlier (%)
Means of transportation to work - Drove car alone (%)
Means of transportation to work - Carpooled (%)
Means of transportation to work - Public transportation (%)
Means of transportation to work - Bus or trolley bus (%)
Means of transportation to work - Streetcar or trolley car (%)
Means of transportation to work - Subway or elevated (%)
Means of transportation to work - Railroad (%)
Means of transportation to work - Ferryboat (%)
Means of transportation to work - Taxicab (%)
Means of transportation to work - Motorcycle (%)
Means of transportation to work - Bicycle (%)
Means of transportation to work - Walked (%)
Means of transportation to work - Other means (%)
Working at home (%)
Industry diversity
Most Common Industries - Agriculture, forestry, fishing and hunting, and mining (%)
Most Common Industries - Agriculture, forestry, fishing and hunting (%)
Most Common Industries - Mining, quarrying, and oil and gas extraction (%)
Most Common Industries - Construction (%)
Most Common Industries - Manufacturing (%)
Most Common Industries - Wholesale trade (%)
Most Common Industries - Retail trade (%)
Most Common Industries - Transportation and warehousing, and utilities (%)
Most Common Industries - Transportation and warehousing (%)
Most Common Industries - Utilities (%)
Most Common Industries - Information (%)
Most Common Industries - Finance and insurance, and real estate and rental and leasing (%)
Most Common Industries - Finance and insurance (%)
Most Common Industries - Real estate and rental and leasing (%)
Most Common Industries - Professional, scientific, and management, and administrative and waste management services (%)
Most Common Industries - Professional, scientific, and technical services (%)
Most Common Industries - Management of companies and enterprises (%)
Most Common Industries - Administrative and support and waste management services (%)
Most Common Industries - Educational services, and health care and social assistance (%)
Most Common Industries - Educational services (%)
Most Common Industries - Health care and social assistance (%)
Most Common Industries - Arts, entertainment, and recreation, and accommodation and food services (%)
Most Common Industries - Arts, entertainment, and recreation (%)
Most Common Industries - Accommodation and food services (%)
Most Common Industries - Other services, except public administration (%)
Most Common Industries - Public administration (%)
Occupation diversity
Most Common Occupations - Management, business, science, and arts occupations (%)
Most Common Occupations - Management, business, and financial occupations (%)
Most Common Occupations - Management occupations (%)
Most Common Occupations - Business and financial operations occupations (%)
Most Common Occupations - Computer, engineering, and science occupations (%)
Most Common Occupations - Computer and mathematical occupations (%)
Most Common Occupations - Architecture and engineering occupations (%)
Most Common Occupations - Life, physical, and social science occupations (%)
Most Common Occupations - Education, legal, community service, arts, and media occupations (%)
Most Common Occupations - Community and social service occupations (%)
Most Common Occupations - Legal occupations (%)
Most Common Occupations - Education, training, and library occupations (%)
Most Common Occupations - Arts, design, entertainment, sports, and media occupations (%)
Most Common Occupations - Healthcare practitioners and technical occupations (%)
Most Common Occupations - Health diagnosing and treating practitioners and other technical occupations (%)
Most Common Occupations - Health technologists and technicians (%)
Most Common Occupations - Service occupations (%)
Most Common Occupations - Healthcare support occupations (%)
Most Common Occupations - Protective service occupations (%)
Most Common Occupations - Fire fighting and prevention, and other protective service workers including supervisors (%)
Most Common Occupations - Law enforcement workers including supervisors (%)
Most Common Occupations - Food preparation and serving related occupations (%)
Most Common Occupations - Building and grounds cleaning and maintenance occupations (%)
Most Common Occupations - Personal care and service occupations (%)
Most Common Occupations - Sales and office occupations (%)
Most Common Occupations - Sales and related occupations (%)
Most Common Occupations - Office and administrative support occupations (%)
Most Common Occupations - Natural resources, construction, and maintenance occupations (%)
Most Common Occupations - Farming, fishing, and forestry occupations (%)
Most Common Occupations - Construction and extraction occupations (%)
Most Common Occupations - Installation, maintenance, and repair occupations (%)
Most Common Occupations - Production, transportation, and material moving occupations (%)
Most Common Occupations - Production occupations (%)
Most Common Occupations - Transportation occupations (%)
Most Common Occupations - Material moving occupations (%)
People in Group quarters - Institutionalized population (%)
People in Group quarters - Correctional institutions (%)
People in Group quarters - Federal prisons and detention centers (%)
People in Group quarters - Halfway houses (%)
People in Group quarters - Local jails and other confinement facilities (including police lockups) (%)
People in Group quarters - Military disciplinary barracks (%)
People in Group quarters - State prisons (%)
People in Group quarters - Other types of correctional institutions (%)
People in Group quarters - Nursing homes (%)
People in Group quarters - Hospitals/wards, hospices, and schools for the handicapped (%)
People in Group quarters - Hospitals/wards and hospices for chronically ill (%)
People in Group quarters - Hospices or homes for chronically ill (%)
People in Group quarters - Military hospitals or wards for chronically ill (%)
People in Group quarters - Other hospitals or wards for chronically ill (%)
People in Group quarters - Hospitals or wards for drug/alcohol abuse (%)
People in Group quarters - Mental (Psychiatric) hospitals or wards (%)
People in Group quarters - Schools, hospitals, or wards for the mentally retarded (%)
People in Group quarters - Schools, hospitals, or wards for the physically handicapped (%)
People in Group quarters - Institutions for the deaf (%)
People in Group quarters - Institutions for the blind (%)
People in Group quarters - Orthopedic wards and institutions for the physically handicapped (%)
People in Group quarters - Wards in general hospitals for patients who have no usual home elsewhere (%)
People in Group quarters - Wards in military hospitals for patients who have no usual home elsewhere (%)
People in Group quarters - Juvenile institutions (%)
People in Group quarters - Long-term care (%)
People in Group quarters - Homes for abused, dependent, and neglected children (%)
People in Group quarters - Residential treatment centers for emotionally disturbed children (%)
People in Group quarters - Training schools for juvenile delinquents (%)
People in Group quarters - Short-term care, detention or diagnostic centers for delinquent children (%)
People in Group quarters - Type of juvenile institution unknown (%)
People in Group quarters - Noninstitutionalized population (%)
People in Group quarters - College dormitories (includes college quarters off campus) (%)
People in Group quarters - Military quarters (%)
People in Group quarters - On base (%)
People in Group quarters - Barracks, unaccompanied personnel housing (UPH), (Enlisted/Officer), ;and similar group living quarters for military personnel (%)
People in Group quarters - Transient quarters for temporary residents (%)
People in Group quarters - Military ships (%)
People in Group quarters - Group homes (%)
People in Group quarters - Homes or halfway houses for drug/alcohol abuse (%)
People in Group quarters - Homes for the mentally ill (%)
People in Group quarters - Homes for the mentally retarded (%)
People in Group quarters - Homes for the physically handicapped (%)
People in Group quarters - Other group homes (%)
People in Group quarters - Religious group quarters (%)
People in Group quarters - Dormitories (%)
People in Group quarters - Agriculture workers' dormitories on farms (%)
People in Group quarters - Job Corps and vocational training facilities (%)
People in Group quarters - Other workers' dormitories (%)
People in Group quarters - Crews of maritime vessels (%)
People in Group quarters - Other nonhousehold living situations (%)
People in Group quarters - Other noninstitutional group quarters (%)
Residents speaking English at home (%)
Residents speaking English at home - Born in the United States (%)
Residents speaking English at home - Native, born elsewhere (%)
Residents speaking English at home - Foreign born (%)
Residents speaking Spanish at home (%)
Residents speaking Spanish at home - Born in the United States (%)
Residents speaking Spanish at home - Native, born elsewhere (%)
Residents speaking Spanish at home - Foreign born (%)
Residents speaking other language at home (%)
Residents speaking other language at home - Born in the United States (%)
Residents speaking other language at home - Native, born elsewhere (%)
Residents speaking other language at home - Foreign born (%)
Class of Workers - Employee of private company (%)
Class of Workers - Self-employed in own incorporated business (%)
Class of Workers - Private not-for-profit wage and salary workers (%)
Class of Workers - Local government workers (%)
Class of Workers - State government workers (%)
Class of Workers - Federal government workers (%)
Class of Workers - Self-employed workers in own not incorporated business and Unpaid family workers (%)
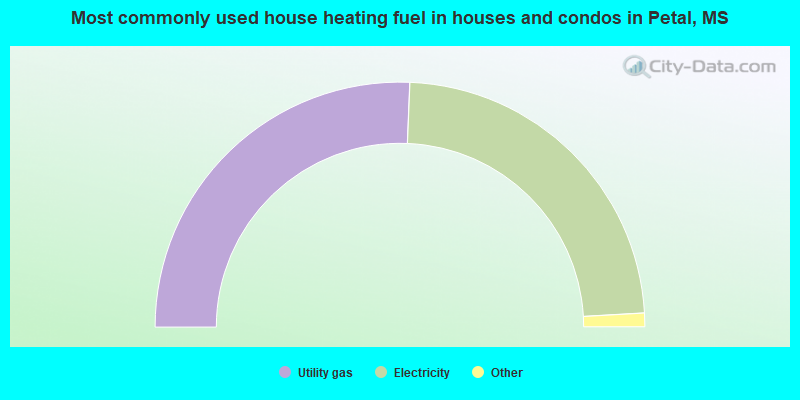
House heating fuel used in houses and condos - Utility gas (%)
House heating fuel used in houses and condos - Bottled, tank, or LP gas (%)
House heating fuel used in houses and condos - Electricity (%)
House heating fuel used in houses and condos - Fuel oil, kerosene, etc. (%)
House heating fuel used in houses and condos - Coal or coke (%)
House heating fuel used in houses and condos - Wood (%)
House heating fuel used in houses and condos - Solar energy (%)
House heating fuel used in houses and condos - Other fuel (%)
House heating fuel used in houses and condos - No fuel used (%)
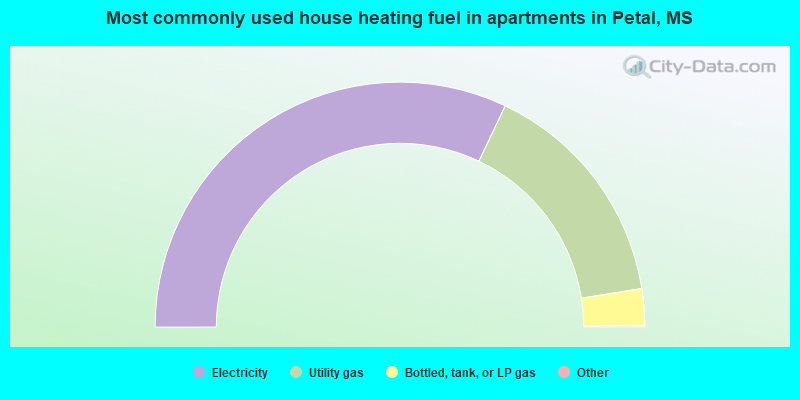
House heating fuel used in apartments - Utility gas (%)
House heating fuel used in apartments - Bottled, tank, or LP gas (%)
House heating fuel used in apartments - Electricity (%)
House heating fuel used in apartments - Fuel oil, kerosene, etc. (%)
House heating fuel used in apartments - Coal or coke (%)
House heating fuel used in apartments - Wood (%)
House heating fuel used in apartments - Solar energy (%)
House heating fuel used in apartments - Other fuel (%)
House heating fuel used in apartments - No fuel used (%)
Armed forces status - In Armed Forces (%)
Armed forces status - Civilian (%)
Armed forces status - Civilian - Veteran (%)
Armed forces status - Civilian - Nonveteran (%)
Fatal accidents locations in years 2005-2021
Fatal accidents locations in 2005
Fatal accidents locations in 2006
Fatal accidents locations in 2007
Fatal accidents locations in 2008
Fatal accidents locations in 2009
Fatal accidents locations in 2010
Fatal accidents locations in 2011
Fatal accidents locations in 2012
Fatal accidents locations in 2013
Fatal accidents locations in 2014
Fatal accidents locations in 2015
Fatal accidents locations in 2016
Fatal accidents locations in 2017
Fatal accidents locations in 2018
Fatal accidents locations in 2019
Fatal accidents locations in 2020
Fatal accidents locations in 2021
Alcohol use - People drinking some alcohol every month (%)
Alcohol use - People not drinking at all (%)
Alcohol use - Average days/month drinking alcohol
Alcohol use - Average drinks/week
Alcohol use - Average days/year people drink much
Audiometry - Average condition of hearing (%)
Audiometry - People that can hear a whisper from across a quiet room (%)
Audiometry - People that can hear normal voice from across a quiet room (%)
Audiometry - Ears ringing, roaring, buzzing (%)
Audiometry - Had a job exposure to loud noise (%)
Audiometry - Had off-work exposure to loud noise (%)
Blood Pressure & Cholesterol - Has high blood pressure (%)
Blood Pressure & Cholesterol - Checking blood pressure at home (%)
Blood Pressure & Cholesterol - Frequently checking blood cholesterol (%)
Blood Pressure & Cholesterol - Has high cholesterol level (%)
Consumer Behavior - Money monthly spent on food at supermarket/grocery store
Consumer Behavior - Money monthly spent on food at other stores
Consumer Behavior - Money monthly spent on eating out
Consumer Behavior - Money monthly spent on carryout/delivered foods
Consumer Behavior - Income spent on food at supermarket/grocery store (%)
Consumer Behavior - Income spent on food at other stores (%)
Consumer Behavior - Income spent on eating out (%)
Consumer Behavior - Income spent on carryout/delivered foods (%)
Current Health Status - General health condition (%)
Current Health Status - Blood donors (%)
Current Health Status - Has blood ever tested for HIV virus (%)
Current Health Status - Left-handed people (%)
Dermatology - People using sunscreen (%)
Diabetes - Diabetics (%)
Diabetes - Had a blood test for high blood sugar (%)
Diabetes - People taking insulin (%)
Diet Behavior & Nutrition - Diet health (%)
Diet Behavior & Nutrition - Milk product consumption (# of products/month)
Diet Behavior & Nutrition - Meals not home prepared (#/week)
Diet Behavior & Nutrition - Meals from fast food or pizza place (#/week)
Diet Behavior & Nutrition - Ready-to-eat foods (#/month)
Diet Behavior & Nutrition - Frozen meals/pizza (#/month)
Drug Use - People that ever used marijuana or hashish (%)
Drug Use - Ever used hard drugs (%)
Drug Use - Ever used any form of cocaine (%)
Drug Use - Ever used heroin (%)
Drug Use - Ever used methamphetamine (%)
Health Insurance - People covered by health insurance (%)
Kidney Conditions-Urology - Avg. # of times urinating at night
Medical Conditions - People with asthma (%)
Medical Conditions - People with anemia (%)
Medical Conditions - People with psoriasis (%)
Medical Conditions - People with overweight (%)
Medical Conditions - Elderly people having difficulties in thinking or remembering (%)
Medical Conditions - People who ever received blood transfusion (%)
Medical Conditions - People having trouble seeing even with glass/contacts (%)
Medical Conditions - People with arthritis (%)
Medical Conditions - People with gout (%)
Medical Conditions - People with congestive heart failure (%)
Medical Conditions - People with coronary heart disease (%)
Medical Conditions - People with angina pectoris (%)
Medical Conditions - People who ever had heart attack (%)
Medical Conditions - People who ever had stroke (%)
Medical Conditions - People with emphysema (%)
Medical Conditions - People with thyroid problem (%)
Medical Conditions - People with chronic bronchitis (%)
Medical Conditions - People with any liver condition (%)
Medical Conditions - People who ever had cancer or malignancy (%)
Mental Health - People who have little interest in doing things (%)
Mental Health - People feeling down, depressed, or hopeless (%)
Mental Health - People who have trouble sleeping or sleeping too much (%)
Mental Health - People feeling tired or having little energy (%)
Mental Health - People with poor appetite or overeating (%)
Mental Health - People feeling bad about themself (%)
Mental Health - People who have trouble concentrating on things (%)
Mental Health - People moving or speaking slowly or too fast (%)
Mental Health - People having thoughts they would be better off dead (%)
Oral Health - Average years since last visit a dentist
Oral Health - People embarrassed because of mouth (%)
Oral Health - People with gum disease (%)
Oral Health - General health of teeth and gums (%)
Oral Health - Average days a week using dental floss/device
Oral Health - Average days a week using mouthwash for dental problem
Oral Health - Average number of teeth
Pesticide Use - Households using pesticides to control insects (%)
Pesticide Use - Households using pesticides to kill weeds (%)
Physical Activity - People doing vigorous-intensity work activities (%)
Physical Activity - People doing moderate-intensity work activities (%)
Physical Activity - People walking or bicycling (%)
Physical Activity - People doing vigorous-intensity recreational activities (%)
Physical Activity - People doing moderate-intensity recreational activities (%)
Physical Activity - Average hours a day doing sedentary activities
Physical Activity - Average hours a day watching TV or videos
Physical Activity - Average hours a day using computer
Physical Functioning - People having limitations keeping them from working (%)
Physical Functioning - People limited in amount of work they can do (%)
Physical Functioning - People that need special equipment to walk (%)
Physical Functioning - People experiencing confusion/memory problems (%)
Physical Functioning - People requiring special healthcare equipment (%)
Prescription Medications - Average number of prescription medicines taking
Preventive Aspirin Use - Adults 40+ taking low-dose aspirin (%)
Reproductive Health - Vaginal deliveries (%)
Reproductive Health - Cesarean deliveries (%)
Reproductive Health - Deliveries resulted in a live birth (%)
Reproductive Health - Pregnancies resulted in a delivery (%)
Reproductive Health - Women breastfeeding newborns (%)
Reproductive Health - Women that had a hysterectomy (%)
Reproductive Health - Women that had both ovaries removed (%)
Reproductive Health - Women that have ever taken birth control pills (%)
Reproductive Health - Women taking birth control pills (%)
Reproductive Health - Women that have ever used Depo-Provera or injectables (%)
Reproductive Health - Women that have ever used female hormones (%)
Sexual Behavior - People 18+ that ever had sex (vaginal, anal, or oral) (%)
Sexual Behavior - Males 18+ that ever had vaginal sex with a woman (%)
Sexual Behavior - Males 18+ that ever performed oral sex on a woman (%)
Sexual Behavior - Males 18+ that ever had anal sex with a woman (%)
Sexual Behavior - Males 18+ that ever had any sex with a man (%)
Sexual Behavior - Females 18+ that ever had vaginal sex with a man (%)
Sexual Behavior - Females 18+ that ever performed oral sex on a man (%)
Sexual Behavior - Females 18+ that ever had anal sex with a man (%)
Sexual Behavior - Females 18+ that ever had any kind of sex with a woman (%)
Sexual Behavior - Average age people first had sex
Sexual Behavior - Average number of female sex partners in lifetime (males 18+)
Sexual Behavior - Average number of female vaginal sex partners in lifetime (males 18+)
Sexual Behavior - Average age people first performed oral sex on a woman (18+)
Sexual Behavior - Average number of woman performed oral sex on in lifetime (18+)
Sexual Behavior - Average number of male sex partners in lifetime (males 18+)
Sexual Behavior - Average number of male anal sex partners in lifetime (males 18+)
Sexual Behavior - Average age people first performed oral sex on a man (18+)
Sexual Behavior - Average number of male oral sex partners in lifetime (18+)
Sexual Behavior - People using protection when performing oral sex (%)
Sexual Behavior - Average number of times people have vaginal or anal sex a year
Sexual Behavior - People having sex without condom (%)
Sexual Behavior - Average number of male sex partners in lifetime (females 18+)
Sexual Behavior - Average number of male vaginal sex partners in lifetime (females 18+)
Sexual Behavior - Average number of female sex partners in lifetime (females 18+)
Sexual Behavior - Circumcised males 18+ (%)
Sleep Disorders - Average hours sleeping at night
Sleep Disorders - People that has trouble sleeping (%)
Smoking-Cigarette Use - People smoking cigarettes (%)
Taste & Smell - People 40+ having problems with smell (%)
Taste & Smell - People 40+ having problems with taste (%)
Taste & Smell - People 40+ that ever had wisdom teeth removed (%)
Taste & Smell - People 40+ that ever had tonsils teeth removed (%)
Taste & Smell - People 40+ that ever had a loss of consciousness because of a head injury (%)
Taste & Smell - People 40+ that ever had a broken nose or other serious injury to face or skull (%)
Taste & Smell - People 40+ that ever had two or more sinus infections (%)
Weight - Average height (inches)
Weight - Average weight (pounds)
Weight - Average BMI
Weight - People that are obese (%)
Weight - People that ever were obese (%)
Weight - People trying to lose weight (%)
Officers per 1,000 residents here:
2.44Mississippi average:
2.08
Latest news from Petal, MS collected exclusively by city-data.com from local newspapers, TV, and radio stations
Ancestries: American (31.1%), English (12.4%), German (9.3%), Irish (6.0%), Italian (1.6%), European (1.6%).
Current Local Time:
Land area: 9.67 square miles.
Population density: 1,161 people per square mile (low).
214 residents are foreign born
This city:
1.9%Mississippi:
2.3%
Median real estate property taxes paid for housing units with mortgages in 2022: $1,782 (0.9%)Median real estate property taxes paid for housing units with no mortgage in 2022: $1,506 (0.8%)
Nearest city with pop. 50,000+: Gulfport, MS
Nearest city with pop. 200,000+: New Orleans, LA
Nearest city with pop. 1,000,000+: Houston, TX
Nearest cities:
Latitude: 31.35 N, Longitude: 89.26 W
Daytime population change due to commuting: -822 (-7.4%)Workers who live and work in this city: 999 (21.9%)
Area code commonly used in this area: 601
Single-family new house construction building permits:
2022: 32 buildings , average cost: $180,2002021: 56 buildings , average cost: $158,6002020: 57 buildings , average cost: $165,9002019: 30 buildings , average cost: $176,4002018: 43 buildings , average cost: $157,7002017: 51 buildings , average cost: $155,8002016: 23 buildings , average cost: $190,7002015: 21 buildings , average cost: $160,0002014: 15 buildings , average cost: $185,0002013: 27 buildings , average cost: $191,1002012: 17 buildings , average cost: $397,5002011: 13 buildings , average cost: $171,8002010: 24 buildings , average cost: $148,8002009: 34 buildings , average cost: $109,1002008: 36 buildings , average cost: $142,4002007: 71 buildings , average cost: $137,0002006: 78 buildings , average cost: $109,7002005: 78 buildings , average cost: $109,7002004: 85 buildings , average cost: $109,1002003: 21 buildings , average cost: $91,0002002: 19 buildings , average cost: $91,0002001: 21 buildings , average cost: $80,2002000: 16 buildings , average cost: $75,1001999: 17 buildings , average cost: $83,5001998: 27 buildings , average cost: $64,2001997: 26 buildings , average cost: $56,400Unemployment in December 2023: Here:
2.4%Mississippi:
2.6%
Most common occupations in Petal, MS (%)
Both Males Females
Other production occupations, including supervisors (4.4%)
Other sales and related occupations, including supervisors (4.0%)
Sales representatives, services, wholesale and manufacturing (3.7%)
Building and grounds cleaning and maintenance occupations (3.7%)
Electrical equipment mechanics and other installation, maintenance, and repair workers, including supervisors (3.7%)
Other office and administrative support workers, including supervisors (3.6%)
Cashiers (3.5%)
Electrical equipment mechanics and other installation, maintenance, and repair workers, including supervisors (7.0%)
Other production occupations, including supervisors (5.1%)
Sales representatives, services, wholesale and manufacturing (5.0%)
Carpenters (4.7%)
Building and grounds cleaning and maintenance occupations (4.7%)
Material recording, scheduling, dispatching, and distributing workers (4.4%)
Driver/sales workers and truck drivers (4.3%)
Information and record clerks, except customer service representatives (7.0%)
Cashiers (6.5%)
Preschool, kindergarten, elementary, and middle school teachers (5.9%)
Secretaries and administrative assistants (5.1%)
Other office and administrative support workers, including supervisors (5.1%)
Other sales and related occupations, including supervisors (4.8%)
Registered nurses (4.1%)
Air pollution and air quality trends(lower is better)
AQI PM2.5
Tornado activity:
Petal-area historical tornado activity is near Mississippi state average. It is 113% greater than the overall U.S. average.
On 2/28/1987, a category F4 (max. wind speeds 207-260 mph) tornado 10.6 miles away from the Petal city center killed 6 people and injured 350 people and caused between $5,000,000 and $50,000,000 in damages.
On 5/7/1982, a category F3 (max. wind speeds 158-206 mph) tornado 4.6 miles away from the city center injured one person and caused between $50,000 and $500,000 in damages.
Earthquake activity:
Petal-area historical earthquake activity is significantly above Mississippi state average. It is 112% greater than the overall U.S. average. On 10/24/1997 at 08:35:17, a magnitude 4.9 (4.8 MB, 4.2 MS, 4.9 LG, Depth: 6.2 mi, Class: Light, Intensity: IV - V) earthquake occurred 118.3 miles away from Petal center On 1/18/1999 at 07:00:53, a magnitude 4.8 (4.8 MB, 4.0 LG, Depth: 0.6 mi) earthquake occurred 184.2 miles away from Petal center On 11/7/2004 at 11:20:21, a magnitude 4.3 (4.3 MW, Depth: 3.1 mi) earthquake occurred 118.9 miles away from Petal center On 6/24/1975 at 11:11:36, a magnitude 4.5 (4.5 MB) earthquake occurred 183.7 miles away from Petal center On 3/25/1976 at 00:41:20, a magnitude 5.0 (4.9 MB, 5.0 LG, Class: Moderate, Intensity: VI - VII) earthquake occurred 303.1 miles away from the city center On 7/16/1993 at 10:54:32, a magnitude 3.7 (3.7 LG, Depth: 3.1 mi, Class: Light, Intensity: II - III) earthquake occurred 60.6 miles away from Petal center Magnitude types: regional Lg-wave magnitude (LG), body-wave magnitude (MB), surface-wave magnitude (MS), moment magnitude (MW) Natural disasters: The number of natural disasters in Forrest County (21) is greater than the US average (15).Major Disasters (Presidential) Declared: 14Emergencies Declared: 4Hurricanes: 9, Floods: 8, Storms: 8, Tornadoes: 7, Drought: 1, Freeze: 1, Heavy Rain: 1, Mudslide: 1, Tropical Storm: 1, Wind: 1, Other: 1 (Note: some incidents may be assigned to more than one category). Hospitals and medical centers in Petal: BEDFORD CARE CENTER OF PETAL (908 S GEORGE STREET)
Other hospitals and medical centers near Petal: HATTIESBURG HEALTH AND REHAB CENTER (Nursing Home, about 3 miles away; HATTIESBURG, MS)
BEDFORD CARE CTR-MONROE HALL (Nursing Home, about 5 miles away; HATTIESBURG, MS)
PROVIDENCE HOSPICE, SOUTH, LLC (Hospital, about 5 miles away; HATTIESBURG, MS)
FORREST GENERAL HOME CARE HHA (Home Health Center, about 5 miles away; HATTIESBURG, MS)
BEDFORD CARE CENTER OF HATTIES (Nursing Home, about 5 miles away; HATTIESBURG, MS)
SOUTHERNCARE HATTIESBURG (Hospital, about 6 miles away; HATTIESBURG, MS)
WESLEY MEDICAL CENTER (about 6 miles away; HATTIESBURG, MS)
Heliports located in Petal: Amtrak station near Petal: 3 miles: HATTIESBURG (308 NEWMAN ST.) Services: enclosed waiting area, public restrooms, public payphones, vending machines, free short-term parking, free long-term parking, call for taxi service.
Colleges/universities with over 2000 students nearest to Petal:
William Carey University (about 4 miles; Hattiesburg, MS ; Full-time enrollment: 3,510)
University of Southern Mississippi (about 6 miles; Hattiesburg, MS ; FT enrollment: 14,294)
Jones County Junior College (about 18 miles; Ellisville, MS ; FT enrollment: 3,942)
Pearl River Community College (about 39 miles; Poplarville, MS ; FT enrollment: 3,074)
Mississippi Gulf Coast Community College (about 40 miles; Perkinston, MS ; FT enrollment: 8,320)
Copiah-Lincoln Community College (about 72 miles; Wesson, MS ; FT enrollment: 2,532)
East Central Community College (about 77 miles; Decatur, MS ; FT enrollment: 2,380)
Public high school in Petal:
Public elementary/middle schools in Petal:
See full list of schools located in Petal
Notable locations in Petal: (A) , Petal City Hall (B) , Caritas Manor Nursing Home (C) , The Petal Library (D) , Petal Fire Department Station 2 (E) , Petal Fire Department Station 1 (F) . Display/hide their locations on the map
Shopping Center: (1) . Display/hide its location on the map
Churches in Petal include: (A) , Petal United Methodist Church (B) , Petal Presbyterian Church (C) , Petal-Harvey Baptist Church (D) , Petal Church of God (E) , Mount Bethel Baptist Church (F) , Kingdom Hall of Jehovahs Witnesses (G) , First Baptist Church of Petal (H) , Carterville Baptist Church (I) . Display/hide their locations on the map
Cemeteries: (1) , Petal Cemetery (2) , Forrest Memorial Gardens (3) , Grant Cemetery (4) , Hillcrest Cemetery (5) . Display/hide their locations on the map
Streams, rivers, and creeks: (A) , Greens Creek (B) , Gordons Creek (C) . Display/hide their locations on the map
Park in Petal: (1) . Display/hide its location on the map
Tourist attractions:
Birthplace of: Ray Perkins (American football) - College football player, Nate Rolison - Baseball player, Tom Walters (American football) - Football player.
Forrest County has a predicted average indoor radon screening level less than 2 pCi/L (pico curies per liter) - Low Potential Drinking water stations with addresses in Petal and their reported violations in the past:
CITY OF PETAL (Population served: 8,791, Groundwater):
Past health violations:
MCL, Monthly (TCR) - In OCT-2007, Contaminant: Coliform. Follow-up actions: St Public Notif requested (NOV-09-2007), St Violation/Reminder Notice (NOV-09-2007), St Public Notif received (NOV-28-2007)
Past monitoring violations:
304 regular monitoring violations
Population served: 6,638, Groundwater):
Past monitoring violations:
467 regular monitoring violations
Population served: 1,700, Groundwater):
Past health violations:
MCL, Monthly (TCR) - In SEP-2013, Contaminant: Coliform. Follow-up actions: St Compliance achieved (OCT-07-2013), St Public Notif requested (OCT-08-2013), St Formal NOV issued (OCT-08-2013), St Public Notif received (OCT-22-2013)
MCL, Monthly (TCR) - In APR-2011, Contaminant: Coliform. Follow-up actions: St Public Notif requested (APR-13-2011), St Formal NOV issued (APR-13-2011), St Public Notif received (APR-29-2011), St Compliance achieved (MAY-09-2011)
MCL, Monthly (TCR) - In FEB-2009, Contaminant: Coliform. Follow-up actions: St Public Notif requested (MAR-04-2009), St Formal NOV issued (MAR-05-2009), St Public Notif received (DEC-08-2010)
Past monitoring violations:
232 regular monitoring violations
Average household size: This city:
2.6 peopleMississippi:
2.6 people
Percentage of family households: This city:
73.2%Whole state:
69.0%
Percentage of households with unmarried partners: This city:
5.0%Whole state:
5.7%
Likely homosexual households (counted as self-reported same-sex unmarried-partner households)
Lesbian couples: 0.5% of all households Gay men: 0.2% of all households
57 people in nursing facilities/skilled-nursing facilities in 2010people in nursing homes in 2000people in homes for the mentally ill in 2000
Banks with branches in Petal (2011 data):
BancorpSouth Bank: Eastbrook Branch at 27 Byrd Parkway, branch established on 2004/03/30; Petal Branch at 143 Central Avenue West, branch established on 1955/07/22. Info updated 2007/07/18: Bank assets: $12,990.3 mil, Deposits: $10,863.8 mil, headquarters in Tupelo, MS, positive income , Commercial Lending Specialization, 271 total offices , Holding Company: Bancorpsouth, Inc.
First Southern Bank: Petal Branch at 1048 Highway 42, branch established on 2005/11/07. Info updated 2006/11/03: Bank assets: $199.1 mil, Deposits: $162.4 mil, headquarters in Columbia, MS, positive income , Commercial Lending Specialization, 7 total offices , Holding Company: First Federal Bancorp
Hancock Bank: Petal Branch at 535 Highway 42, branch established on 1996/05/15. Info updated 2011/06/14: Bank assets: $4,988.4 mil, Deposits: $4,121.5 mil, headquarters in Gulfport, MS, positive income , Commercial Lending Specialization, 81 total offices , Holding Company: Hancock Holding Company
Pike National Bank: Pikco Petal Branch at 501 New Richton Road, branch established on 1995/04/03. Info updated 2007/03/29: Bank assets: $206.6 mil, Deposits: $156.6 mil, headquarters in Mccomb, MS, positive income , Commercial Lending Specialization, 11 total offices , Holding Company: Pcnb Corp.
Trustmark National Bank: Petal Branch at 117 South Main Street, branch established on 1962/08/01. Info updated 2012/03/26: Bank assets: $9,612.1 mil, Deposits: $7,410.1 mil, headquarters in Jackson, MS, positive income , Commercial Lending Specialization, 186 total offices , Holding Company: Trustmark Corporation
Grand Bank for Savings, FSB: 226 Highway 42 East at 226 Highway 42 East, branch established on 2006/03/01. Info updated 2011/07/21: Bank assets: $126.2 mil, Deposits: $114.0 mil, headquarters in Hattiesburg, MS, positive income , Mortgage Lending Specialization, 3 total offices
Regions Bank: Petal Branch at 120 South Main Street, branch established on 1934/07/01. Info updated 2011/02/24: Bank assets: $123,368.2 mil, Deposits: $98,301.3 mil, headquarters in Birmingham, AL, positive income , Commercial Lending Specialization, 1778 total offices , Holding Company: Regions Financial Corporation
Magnolia State Bank: Petal Branch at 1227 Highway 42, Suite 110, branch established on 2007/07/17. Info updated 2006/11/03: Bank assets: $264.5 mil, Deposits: $236.3 mil, headquarters in Bay Springs, MS, positive income , Commercial Lending Specialization, 10 total offices , Holding Company: Magnolia State Corporation, The
For population 15 years and over in Petal:
Never married: 29.9%Now married: 50.9%Separated: 2.0%Widowed: 6.4%Divorced: 10.9% For population 25 years and over in Petal:
High school or higher: 90.1%Bachelor's degree or higher: 30.4%Graduate or professional degree: 13.5%Unemployed: 4.1%Mean travel time to work (commute): 20.2 minutes
Education Gini index (Inequality in education) Here:
10.6Mississippi average:
11.8
Religion statistics for Petal, MS (based on Forrest County data)
Religion Adherents Congregations Evangelical Protestant 33,774 86 Mainline Protestant 7,405 22 Catholic 6,613 3 Other 2,532 13 Black Protestant 860 13 None 23,750 -
Source: Clifford Grammich, Kirk Hadaway, Richard Houseal, Dale E.Jones, Alexei Krindatch, Richie Stanley and Richard H.Taylor. 2012. 2010 U.S.Religion Census: Religious Congregations & Membership Study. Association of Statisticians of American Religious Bodies. Jones, Dale E., et al. 2002. Congregations and Membership in the United States 2000. Nashville, TN: Glenmary Research Center. Graphs represent county-level data
Food Environment Statistics: Number of grocery stores : 17Here :
2.16 / 10,000 pop.Mississippi :
2.08 / 10,000 pop.
Number of supercenters and club stores : 2Forrest County :
0.25 / 10,000 pop.Mississippi :
0.24 / 10,000 pop.
Number of convenience stores (no gas) : 5This county :
0.64 / 10,000 pop.Mississippi :
0.80 / 10,000 pop.
Number of convenience stores (with gas) : 56This county :
7.12 / 10,000 pop.Mississippi :
6.36 / 10,000 pop.
Number of full-service restaurants : 43Forrest County :
5.47 / 10,000 pop.State :
5.03 / 10,000 pop.
Adult diabetes rate : Forrest County :
11.8%State :
12.3%
Adult obesity rate : Forrest County :
33.9%Mississippi :
33.1%
Low-income preschool obesity rate : This county :
17.5%State :
14.4%
Health and Nutrition: Healthy diet rate : This city:
51.5%State:
48.6%
Average overall health of teeth and gums : This city:
49.0%State:
45.3%
People feeling badly about themselves : This city:
20.1%Mississippi:
20.5%
People not drinking alcohol at all : This city:
11.5%Mississippi:
11.6%
Average hours sleeping at night : General health condition : Here:
58.6%Mississippi:
54.9%
Average condition of hearing : Here:
78.6%Mississippi:
79.9%
More about Health and Nutrition of Petal, MS Residents
Local government employment and payroll (March 2022)
Function
Full-time employees
Monthly full-time payroll
Average yearly full-time wage
Part-time employees
Monthly part-time payroll
Firefighters
32 $99,871 $37,452 0 $0 Police Protection - Officers
23 $71,420 $37,263 6 $1,681 Other Government Administration
11 $39,007 $42,553 1 $1,128 Police - Other
10 $39,355 $47,226 0 $0 Parks and Recreation
7 $16,250 $27,857 0 $0 Judicial and Legal
6 $14,039 $28,078 0 $0 Water Supply
5 $16,283 $39,079 0 $0 Fire - Other
5 $19,665 $47,196 0 $0 Financial Administration
4 $11,254 $33,762 0 $0
Totals for Government
103 $327,144 $38,114 7 $2,809
Petal government finances - Expenditure in 2021 (per resident):
Current Operations - Local Fire Protection: $2,292,000 ($204.10)
Police Protection: $2,216,000 ($197.33)Regular Highways: $1,680,000 ($149.60)Parks and Recreation: $1,459,000 ($129.92)Sewerage: $1,381,000 ($122.97)Water Utilities: $1,056,000 ($94.03)Solid Waste Management: $884,000 ($78.72)Central Staff Services: $752,000 ($66.96)Judicial and Legal Services: $320,000 ($28.50)Financial Administration: $267,000 ($23.78)Protective Inspection and Regulation - Other: $217,000 ($19.32)General - Other: $7,000 ($0.62)General - Interest on Debt: $517,000 ($46.04)
Other Capital Outlay - General - Other: $324,000 ($28.85)
Sewerage: $122,000 ($10.86)Water Utilities: $93,000 ($8.28)
Petal government finances - Revenue in 2021 (per resident):
Charges - Sewerage: $1,121,000 ($99.82)
Solid Waste Management: $839,000 ($74.71)Other: $499,000 ($44.43)Miscellaneous - General Revenue - Other: $197,000 ($17.54)
Interest Earnings: $11,000 ($0.98)Revenue - Water Utilities: $2,534,000 ($225.65)
State Intergovernmental - General Local Government Support: $5,494,000 ($489.23)
Other: $144,000 ($12.82)Tax - Property: $4,848,000 ($431.70)
Public Utilities Sales: $564,000 ($50.22)
Petal government finances - Debt in 2021 (per resident):
Long Term Debt - Beginning Outstanding - Unspecified Public Purpose: $13,610,000 ($1211.93)
Outstanding Unspecified Public Purpose: $12,510,000 ($1113.98)Retired Unspecified Public Purpose: $1,100,000 ($97.95)
Petal government finances - Cash and Securities in 2021 (per resident):
Other Funds - Cash and Securities: $5,097,000 ($453.87)
Businesses in Petal, MS
Name Count Name Count
AT&T 1 Papa John's Pizza 1 Ace Hardware 1 Pizza Hut 1 AutoZone 1 Popeyes 1 Church's Chicken 1 Rite Aid 1 Domino's Pizza 1 SONIC Drive-In 1 FedEx 2 Subway 2 GNC 1 Taco Bell 1 GameStop 1 U-Haul 2 H&R Block 1 Walgreens 1 Hardee's 1 Walmart 1 Lowe's 1 YMCA 1 McDonald's 1
Strongest AM radio stations in Petal:
WBKH (950 AM; 5 kW; HATTIESBURG, MS; Owner: SOUTHERN AIR COMMUNICATIONS, INC.)
WORV (1580 AM; 1 kW; HATTIESBURG, MS; Owner: CIRCUIT BROADCASTING CO.)
WEEZ (890 AM; daytime; 10 kW; LAUREL, MS; Owner: CLEAR CHANNEL BROADCASTING LICENSES, INC.)
WFOR (1400 AM; 1 kW; HATTIESBURG, MS; Owner: CLEAR CHANNEL BROADCASTING LICENSES, INC.)
WSJC (810 AM; 50 kW; MAGEE, MS; Owner: FAMILY TALK RADIO)
WOMN (1110 AM; daytime; 30 kW; FRANKLINTON, LA; Owner: PITTMAN BROADCASTING SERVICES, LLC.)
WJNT (1180 AM; 50 kW; PEARL, MS; Owner: BUCHANAN BROADCASTING CO., INC.)
WRPM (1530 AM; daytime; 10 kW; POPLARVILLE, MS; Owner: DOWDY & DOWDY PARTNERS)
WWL (870 AM; 50 kW; NEW ORLEANS, LA; Owner: ENTERCOM NEW ORLEANS LICENSE, LLC)
WASG (550 AM; 25 kW; ATMORE, AL; Owner: 550 AM, INC)
WLNO (1060 AM; 50 kW; NEW ORLEANS, LA; Owner: COMMUNICOM CO. OF LOUISIANA, L.P.)
WIGG (1420 AM; 5 kW; WIGGINS, MS; Owner: TRALYN BROADCASTING, INC.)
WQST (850 AM; daytime; 10 kW; FOREST, MS; Owner: ACE BROADCASTING, INC.)
Strongest FM radio stations in Petal:
WJMG (92.1 FM; HATTIESBURG, MS; Owner: CIRCUIT B/CTING CO. OF HATTIESBURG)
WXRR (104.5 FM; HATTIESBURG, MS; Owner: BLAKENEY COMMUNICATIONS, INC.)
WZLD (106.3 FM; PETAL, MS; Owner: CLEAR CHANNEL BROADCASTING LICENSES, INC.)
WNSL (100.3 FM; LAUREL, MS; Owner: CLEAR CHANNEL BROADCASTING LICENSES, INC.)
WUSW (103.7 FM; HATTIESBURG, MS; Owner: CLEAR CHANNEL BROADCASTING LICENSES, INC.)
WUSM-FM (88.5 FM; HATTIESBURG, MS; Owner: UNIVERSITY OF SOUTHERN MISSISSIPPI)
WAII (89.3 FM; HATTIESBURG, MS; Owner: AMERICAN FAMILY ASSOCIATION)
WMXI (98.1 FM; LAUREL, MS; Owner: RAINEY BROADCASTING, INC.)
W216BA (91.1 FM; HATTIESBURG, MS; Owner: PENSACOLA CHRISTIAN COLLEGE, INC)
WBBN (95.9 FM; TAYLORSVILLE, MS; Owner: BLAKENEY COMMUNICATIONS, INC)
WKNZ (107.1 FM; COLLINS, MS; Owner: RADIO BROADCASTERS, L.L.C.)
WQID-LP (105.3 FM; HATTIESBURG, MS; Owner: HATTIESBURG URBAN HERITAGE ASSOCIATION)
WZKX (107.9 FM; BAY ST. LOUIS, MS; Owner: DOWDY & DOWDY PARTNERSHIP)
WMAH-FM (90.3 FM; BILOXI, MS; Owner: MISSISSIPPI AUTHORITY FOR EDUCATIONAL TV)
WFMM (97.3 FM; SUMRALL, MS; Owner: TELESOUTH COMMUNICATIONS, INC)
WZNF (95.3 FM; LUMBERTON, MS; Owner: JMD, INC.)
WAOY (91.7 FM; GULFPORT, MS; Owner: AMERICAN FAMILY ASSOCIATION, INC.)
WXHB (96.5 FM; RICHTON, MS; Owner: RADIO BROADCASTERS, L.L.C.)
WJKX (102.5 FM; ELLISVILLE, MS; Owner: CLEAR CHANNEL BROADCASTING LICENSES, INC.)
WATP (90.7 FM; LAUREL, MS; Owner: AMERICAN FAMILY ASSOCIATION)
TV broadcast stations around Petal:
WHLT (Channel 22; HATTIESBURG, MS; Owner: MEDIA GENERAL COMMUNICATIONS, INC.)
WDAM-TV (Channel 7; LAUREL, MS; Owner: WDAM LICENSE SUBSIDIARY, INC.)
W47BP (Channel 47; HATTIESBURG, MS; Owner: MISSISSIPPI AUTHORITY FOR ED. TV.)
W32CN (Channel 32; MERIDIAN, MS; Owner: MS COMMUNICATIONS, LLC)
WMAH-TV (Channel 19; BILOXI, MS; Owner: MISSISSIPPI AUTHORITY FOR EDUCATIONAL TELEVISION)
WLOX (Channel 13; BILOXI, MS; Owner: LIBCO, INC.)
W69DJ (Channel 69; MERIDIAN, MS; Owner: MS COMMUNICATIONS, LLC)
National Bridge Inventory (NBI) Statistics 57 Number of bridges1,076ft / 328m Total length $304,986,000 Total costs197,280 Total average daily traffic13,304 Total average daily truck traffic
New bridges - historical statistics
3 1950-1959 1 1960-1969 10 1970-1979 11 1980-1989 5 1990-1999 19 2000-2009 7 2010-2019 1 2020-2022
See full National Bridge Inventory statistics for Petal, MS
Home Mortgage Disclosure Act Aggregated Statistics For Year 2009(Based on 2 partial tracts) A) FHA, FSA/RHS & VA B) Conventional C) Refinancings D) Home Improvement Loans E) Loans on Dwellings For 5+ Families F) Non-occupant Loans on G) Loans On Manufactured Number Average Value Number Average Value Number Average Value Number Average Value Number Average Value Number Average Value Number Average Value
LOANS ORIGINATED 44 $115,425 25 $75,851 97 $92,051 13 $33,598 4 $327,738 33 $67,860 1 $6,940 APPLICATIONS APPROVED, NOT ACCEPTED 2 $43,530 2 $31,660 8 $99,086 1 $18,750 0 $0 2 $31,660 1 $39,320 APPLICATIONS DENIED 8 $102,169 13 $55,658 33 $96,732 8 $9,385 0 $0 2 $70,885 8 $54,249 APPLICATIONS WITHDRAWN 10 $122,573 6 $83,443 21 $101,795 2 $6,430 1 $101,260 2 $35,630 0 $0 FILES CLOSED FOR INCOMPLETENESS 1 $99,760 2 $45,490 11 $104,763 0 $0 0 $0 1 $90,010 0 $0
Aggregated Statistics For Year 2008(Based on 2 partial tracts) A) FHA, FSA/RHS & VA B) Conventional C) Refinancings D) Home Improvement Loans E) Loans on Dwellings For 5+ Families F) Non-occupant Loans on G) Loans On Manufactured Number Average Value Number Average Value Number Average Value Number Average Value Number Average Value Number Average Value Number Average Value
LOANS ORIGINATED 52 $107,844 37 $91,215 78 $98,075 11 $45,280 1 $123,020 44 $81,082 3 $39,590 APPLICATIONS APPROVED, NOT ACCEPTED 2 $110,495 3 $62,517 9 $83,069 1 $5,400 0 $0 2 $40,865 4 $50,940 APPLICATIONS DENIED 9 $114,540 18 $69,238 37 $102,793 7 $29,206 0 $0 5 $63,034 9 $54,304 APPLICATIONS WITHDRAWN 5 $119,284 3 $82,723 14 $105,604 2 $111,795 0 $0 2 $59,635 1 $10,500 FILES CLOSED FOR INCOMPLETENESS 2 $140,420 1 $60,910 5 $90,088 0 $0 0 $0 0 $0 0 $0
Aggregated Statistics For Year 2007(Based on 2 partial tracts) A) FHA, FSA/RHS & VA B) Conventional C) Refinancings D) Home Improvement Loans F) Non-occupant Loans on G) Loans On Manufactured Number Average Value Number Average Value Number Average Value Number Average Value Number Average Value Number Average Value
LOANS ORIGINATED 37 $107,925 84 $97,981 91 $91,884 18 $30,696 36 $100,940 4 $20,430 APPLICATIONS APPROVED, NOT ACCEPTED 2 $103,250 11 $71,050 17 $87,243 1 $3,750 2 $109,605 4 $26,658 APPLICATIONS DENIED 5 $81,414 26 $86,153 33 $84,554 16 $31,214 7 $66,889 5 $41,238 APPLICATIONS WITHDRAWN 2 $79,900 5 $69,168 14 $84,831 3 $63,120 3 $68,157 0 $0 FILES CLOSED FOR INCOMPLETENESS 1 $126,020 5 $87,448 8 $116,798 0 $0 3 $98,047 0 $0
Aggregated Statistics For Year 2006(Based on 2 partial tracts) A) FHA, FSA/RHS & VA B) Conventional C) Refinancings D) Home Improvement Loans F) Non-occupant Loans on G) Loans On Manufactured Number Average Value Number Average Value Number Average Value Number Average Value Number Average Value Number Average Value
LOANS ORIGINATED 33 $96,826 124 $81,491 83 $75,789 11 $33,395 38 $64,552 7 $27,270 APPLICATIONS APPROVED, NOT ACCEPTED 2 $57,825 9 $69,321 11 $77,265 4 $14,565 3 $59,780 5 $45,322 APPLICATIONS DENIED 17 $77,651 35 $75,655 47 $78,308 13 $23,416 4 $38,500 10 $43,520 APPLICATIONS WITHDRAWN 2 $79,885 12 $85,082 31 $87,723 2 $5,690 5 $56,796 0 $0 FILES CLOSED FOR INCOMPLETENESS 1 $87,890 8 $86,849 17 $86,285 1 $22,500 2 $57,385 0 $0
Aggregated Statistics For Year 2005(Based on 2 partial tracts) A) FHA, FSA/RHS & VA B) Conventional C) Refinancings D) Home Improvement Loans F) Non-occupant Loans on G) Loans On Manufactured Number Average Value Number Average Value Number Average Value Number Average Value Number Average Value Number Average Value
LOANS ORIGINATED 14 $80,406 90 $71,244 76 $63,733 8 $33,799 35 $56,399 6 $76,075 APPLICATIONS APPROVED, NOT ACCEPTED 1 $37,010 15 $64,049 11 $56,722 2 $39,655 1 $24,000 7 $46,171 APPLICATIONS DENIED 10 $67,770 34 $60,667 37 $87,769 14 $20,992 3 $45,730 9 $37,558 APPLICATIONS WITHDRAWN 3 $109,117 28 $66,491 34 $77,626 10 $122,097 5 $93,934 0 $0 FILES CLOSED FOR INCOMPLETENESS 2 $111,145 10 $77,374 9 $82,866 0 $0 0 $0 0 $0
Aggregated Statistics For Year 2004(Based on 2 partial tracts) A) FHA, FSA/RHS & VA B) Conventional C) Refinancings D) Home Improvement Loans E) Loans on Dwellings For 5+ Families F) Non-occupant Loans on G) Loans On Manufactured Number Average Value Number Average Value Number Average Value Number Average Value Number Average Value Number Average Value Number Average Value
LOANS ORIGINATED 13 $85,182 90 $75,163 105 $75,643 14 $34,470 2 $26,630 47 $82,680 7 $39,186 APPLICATIONS APPROVED, NOT ACCEPTED 4 $77,485 8 $39,718 18 $72,122 4 $14,815 0 $0 4 $38,792 5 $50,758 APPLICATIONS DENIED 4 $76,815 36 $53,049 40 $108,492 8 $23,018 0 $0 7 $46,833 17 $46,375 APPLICATIONS WITHDRAWN 2 $47,415 11 $82,835 40 $91,956 3 $39,167 0 $0 2 $73,510 0 $0 FILES CLOSED FOR INCOMPLETENESS 1 $66,010 3 $73,847 10 $97,143 2 $10,285 0 $0 1 $159,600 1 $18,750
Aggregated Statistics For Year 2003(Based on 2 partial tracts) A) FHA, FSA/RHS & VA B) Conventional C) Refinancings D) Home Improvement Loans E) Loans on Dwellings For 5+ Families F) Non-occupant Loans on Number Average Value Number Average Value Number Average Value Number Average Value Number Average Value Number Average Value
LOANS ORIGINATED 21 $79,007 60 $65,264 151 $63,458 13 $20,841 2 $208,905 35 $48,130 APPLICATIONS APPROVED, NOT ACCEPTED 0 $0 7 $53,133 15 $60,134 0 $0 0 $0 1 $30,000 APPLICATIONS DENIED 4 $83,185 32 $48,869 38 $65,376 7 $30,839 0 $0 4 $45,580 APPLICATIONS WITHDRAWN 4 $62,900 10 $62,034 47 $76,958 2 $5,395 0 $0 4 $69,552 FILES CLOSED FOR INCOMPLETENESS 0 $0 2 $45,360 6 $54,460 0 $0 0 $0 0 $0
Aggregated Statistics For Year 2002(Based on 2 partial tracts) A) FHA, FSA/RHS & VA B) Conventional C) Refinancings D) Home Improvement Loans E) Loans on Dwellings For 5+ Families F) Non-occupant Loans on Number Average Value Number Average Value Number Average Value Number Average Value Number Average Value Number Average Value
LOANS ORIGINATED 31 $64,129 76 $68,010 126 $66,449 14 $20,186 1 $93,760 40 $67,298 APPLICATIONS APPROVED, NOT ACCEPTED 0 $0 16 $46,091 13 $77,458 1 $2,250 0 $0 2 $45,380 APPLICATIONS DENIED 3 $62,313 34 $51,577 43 $74,880 6 $16,290 0 $0 4 $82,238 APPLICATIONS WITHDRAWN 3 $53,537 11 $51,911 38 $66,376 2 $37,870 0 $0 2 $17,870 FILES CLOSED FOR INCOMPLETENESS 1 $37,510 3 $85,580 9 $76,083 0 $0 0 $0 2 $28,910
Aggregated Statistics For Year 2001(Based on 2 partial tracts) A) FHA, FSA/RHS & VA B) Conventional C) Refinancings D) Home Improvement Loans E) Loans on Dwellings For 5+ Families F) Non-occupant Loans on Number Average Value Number Average Value Number Average Value Number Average Value Number Average Value Number Average Value
LOANS ORIGINATED 40 $70,952 72 $56,782 135 $62,203 20 $15,222 2 $292,495 36 $56,952 APPLICATIONS APPROVED, NOT ACCEPTED 2 $36,380 12 $44,180 25 $56,512 1 $3,750 0 $0 0 $0 APPLICATIONS DENIED 3 $58,810 29 $37,058 49 $61,252 8 $21,136 0 $0 2 $24,670 APPLICATIONS WITHDRAWN 1 $36,750 6 $58,000 35 $54,430 2 $8,045 0 $0 3 $50,393 FILES CLOSED FOR INCOMPLETENESS 0 $0 2 $41,630 5 $66,330 0 $0 0 $0 0 $0
Aggregated Statistics For Year 2000(Based on 2 partial tracts) A) FHA, FSA/RHS & VA B) Conventional C) Refinancings D) Home Improvement Loans F) Non-occupant Loans on Number Average Value Number Average Value Number Average Value Number Average Value Number Average Value
LOANS ORIGINATED 27 $59,919 59 $55,832 74 $49,794 23 $25,391 16 $31,301 APPLICATIONS APPROVED, NOT ACCEPTED 4 $42,560 18 $42,701 25 $63,427 2 $43,715 2 $140,375 APPLICATIONS DENIED 8 $43,239 38 $39,596 55 $54,789 12 $17,859 2 $33,360 APPLICATIONS WITHDRAWN 5 $50,858 5 $48,840 27 $71,527 2 $18,505 1 $385,500 FILES CLOSED FOR INCOMPLETENESS 0 $0 1 $38,550 8 $53,264 1 $5,400 0 $0
Aggregated Statistics For Year 1999(Based on 2 partial tracts) A) FHA, FSA/RHS & VA B) Conventional C) Refinancings D) Home Improvement Loans E) Loans on Dwellings For 5+ Families F) Non-occupant Loans on Number Average Value Number Average Value Number Average Value Number Average Value Number Average Value Number Average Value
LOANS ORIGINATED 24 $54,855 87 $61,697 109 $54,458 17 $16,113 1 $61,200 37 $47,875 APPLICATIONS APPROVED, NOT ACCEPTED 1 $43,520 10 $53,376 20 $46,198 2 $19,495 0 $0 1 $26,540 APPLICATIONS DENIED 4 $51,762 37 $40,346 52 $46,204 10 $29,114 0 $0 1 $25,810 APPLICATIONS WITHDRAWN 1 $44,240 6 $67,750 26 $53,780 3 $34,780 0 $0 1 $81,690 FILES CLOSED FOR INCOMPLETENESS 1 $24,330 0 $0 5 $33,344 0 $0 0 $0 0 $0
Detailed HMDA statistics for the following Tracts:
0103.00
, 0104.00
Private Mortgage Insurance Companies Aggregated Statistics For Year 2009(Based on 2 partial tracts) A) Conventional B) Refinancings C) Non-occupant Loans on Number Average Value Number Average Value Number Average Value
LOANS ORIGINATED 5 $140,892 2 $157,145 1 $123,360 APPLICATIONS APPROVED, NOT ACCEPTED 2 $62,460 1 $97,150 0 $0 APPLICATIONS DENIED 1 $270,040 2 $84,810 0 $0 APPLICATIONS WITHDRAWN 1 $270,040 0 $0 0 $0 FILES CLOSED FOR INCOMPLETENESS 0 $0 0 $0 0 $0
Aggregated Statistics For Year 2008(Based on 2 partial tracts) A) Conventional B) Refinancings C) Non-occupant Loans on Number Average Value Number Average Value Number Average Value
LOANS ORIGINATED 14 $120,376 7 $105,309 3 $122,730 APPLICATIONS APPROVED, NOT ACCEPTED 6 $123,060 2 $94,445 1 $74,260 APPLICATIONS DENIED 1 $148,800 0 $0 0 $0 APPLICATIONS WITHDRAWN 0 $0 0 $0 0 $0 FILES CLOSED FOR INCOMPLETENESS 0 $0 2 $99,845 0 $0
Aggregated Statistics For Year 2007(Based on 2 partial tracts) A) Conventional B) Refinancings C) Non-occupant Loans on Number Average Value Number Average Value Number Average Value
LOANS ORIGINATED 40 $105,980 19 $113,768 5 $74,690 APPLICATIONS APPROVED, NOT ACCEPTED 5 $84,900 2 $74,585 1 $45,010 APPLICATIONS DENIED 1 $92,520 1 $50,110 1 $50,110 APPLICATIONS WITHDRAWN 2 $124,945 1 $70,930 2 $66,065 FILES CLOSED FOR INCOMPLETENESS 1 $101,260 0 $0 0 $0
Aggregated Statistics For Year 2006(Based on 2 partial tracts) A) Conventional B) Refinancings C) Non-occupant Loans on Number Average Value Number Average Value Number Average Value
LOANS ORIGINATED 46 $89,533 5 $108,074 4 $57,800 APPLICATIONS APPROVED, NOT ACCEPTED 2 $61,085 5 $99,978 2 $49,880 APPLICATIONS DENIED 1 $97,510 0 $0 0 $0 APPLICATIONS WITHDRAWN 2 $83,635 1 $62,260 1 $90,010 FILES CLOSED FOR INCOMPLETENESS 1 $67,510 0 $0 0 $0
Aggregated Statistics For Year 2005(Based on 2 partial tracts) A) Conventional B) Refinancings C) Non-occupant Loans on Number Average Value Number Average Value Number Average Value
LOANS ORIGINATED 27 $93,593 8 $74,068 2 $95,990 APPLICATIONS APPROVED, NOT ACCEPTED 6 $69,387 5 $82,660 2 $101,640 APPLICATIONS DENIED 0 $0 0 $0 0 $0 APPLICATIONS WITHDRAWN 1 $46,510 0 $0 0 $0 FILES CLOSED FOR INCOMPLETENESS 0 $0 0 $0 0 $0
Aggregated Statistics For Year 2004(Based on 2 partial tracts) A) Conventional B) Refinancings C) Non-occupant Loans on D) Loans On Manufactured Number Average Value Number Average Value Number Average Value Number Average Value
LOANS ORIGINATED 27 $79,561 9 $103,191 7 $67,490 0 $0 APPLICATIONS APPROVED, NOT ACCEPTED 3 $69,970 8 $60,115 3 $45,097 1 $51,010 APPLICATIONS DENIED 1 $60,760 0 $0 1 $60,760 0 $0 APPLICATIONS WITHDRAWN 0 $0 2 $59,750 0 $0 0 $0 FILES CLOSED FOR INCOMPLETENESS 0 $0 0 $0 0 $0 0 $0
Aggregated Statistics For Year 2003(Based on 2 partial tracts) A) Conventional B) Refinancings C) Non-occupant Loans on Number Average Value Number Average Value Number Average Value
LOANS ORIGINATED 23 $76,225 32 $77,061 2 $69,155 APPLICATIONS APPROVED, NOT ACCEPTED 2 $55,935 10 $62,243 2 $27,755 APPLICATIONS DENIED 2 $56,285 0 $0 0 $0 APPLICATIONS WITHDRAWN 2 $89,080 2 $72,760 1 $33,920 FILES CLOSED FOR INCOMPLETENESS 0 $0 0 $0 0 $0
Aggregated Statistics For Year 2002(Based on 2 partial tracts) A) Conventional B) Refinancings C) Non-occupant Loans on Number Average Value Number Average Value Number Average Value
LOANS ORIGINATED 21 $69,734 23 $75,513 6 $48,143 APPLICATIONS APPROVED, NOT ACCEPTED 5 $69,892 7 $81,106 1 $38,260 APPLICATIONS DENIED 2 $19,660 1 $73,510 1 $15,420 APPLICATIONS WITHDRAWN 1 $60,910 0 $0 0 $0 FILES CLOSED FOR INCOMPLETENESS 0 $0 1 $51,010 0 $0
Aggregated Statistics For Year 2001(Based on 2 partial tracts) A) Conventional B) Refinancings C) Non-occupant Loans on Number Average Value Number Average Value Number Average Value
LOANS ORIGINATED 15 $65,547 23 $75,982 4 $54,165 APPLICATIONS APPROVED, NOT ACCEPTED 0 $0 7 $58,904 0 $0 APPLICATIONS DENIED 2 $43,130 0 $0 0 $0 APPLICATIONS WITHDRAWN 1 $50,110 1 $91,750 0 $0 FILES CLOSED FOR INCOMPLETENESS 0 $0 0 $0 0 $0
Aggregated Statistics For Year 2000(Based on 2 partial tracts) A) Conventional B) Refinancings Number Average Value Number Average Value
LOANS ORIGINATED 15 $74,887 5 $61,828 APPLICATIONS APPROVED, NOT ACCEPTED 1 $63,990 1 $31,500 APPLICATIONS DENIED 1 $57,050 1 $57,050 APPLICATIONS WITHDRAWN 0 $0 0 $0 FILES CLOSED FOR INCOMPLETENESS 0 $0 0 $0
Aggregated Statistics For Year 1999(Based on 2 partial tracts) A) Conventional B) Refinancings C) Non-occupant Loans on Number Average Value Number Average Value Number Average Value
LOANS ORIGINATED 23 $73,244 10 $74,139 2 $33,465 APPLICATIONS APPROVED, NOT ACCEPTED 1 $62,670 2 $84,080 0 $0 APPLICATIONS DENIED 0 $0 0 $0 0 $0 APPLICATIONS WITHDRAWN 0 $0 0 $0 0 $0 FILES CLOSED FOR INCOMPLETENESS 1 $80,170 0 $0 0 $0
Detailed PMIC statistics for the following Tracts:
0103.00
, 0104.00
Most common first names in Petal, MS among deceased individuals Name Count Lived (average)
James 108 69.2 years William 94 74.2 years John 81 72.9 years Mary 69 77.1 years Robert 64 67.8 years Charles 50 69.0 years Thomas 43 70.8 years Annie 38 80.0 years George 37 75.0 years Willie 33 75.9 years
Most common last names in Petal, MS among deceased individuals Last name Count Lived (average)
Smith 67 73.7 years Lee 39 79.0 years Williams 30 73.6 years Myers 30 74.8 years Jones 29 73.4 years Brown 27 73.7 years Walters 27 72.9 years Odom 26 71.0 years Carter 23 74.2 years Craft 21 79.5 years
Petal compared to Mississippi state average:
Unemployed percentage significantly below state average. Black race population percentage below state average. Hispanic race population percentage above state average. Length of stay since moving in significantly above state average. Percentage of population with a bachelor's degree or higher above state average.
#57 on the list of "Top 101 cities with the largest city-data.com crime index decrease from 2002 to 2012 (population 5,000+)"
#79 on the list of "Top 101 cities with the lowest number of thefts per 100,000 residents (population 5,000+)"
#41 on the list of "Top 101 counties with the smallest number of children under 18 without health insurance coverage in 2000 (pop. 50,000+)"
#60 on the list of "Top 101 counties with the highest percentage of residents relocating to other counties in 2011 (pop. 50,000+)"
#67 on the list of "Top 101 counties with the highest percentage of residents relocating from other counties between 2010 and 2011 (pop. 50,000+)"
#70 on the list of "Top 101 counties with the highest Particulate Matter (PM2.5 ) Annual air pollution readings in 2012 (µg/m3 )"
#72 on the list of "Top 101 counties with the smallest number of people without health insurance coverage in 2000 (pop. 50,000+)"
Top Patent Applicants
Joseph D. Lichtenhan (14)
James W. Rawlins (5)
Jeff A. Burger (2)
Eric B. Williams (2)
Beddhu Murali (2)
Jeffrey S. Wiggins (2)
Werner G. Pierce (1)
Jeffrey Wiggins (1)
James Rawlins (1)
William H. Sharp (1)
Total of 34 patent applications in 2008-2024.
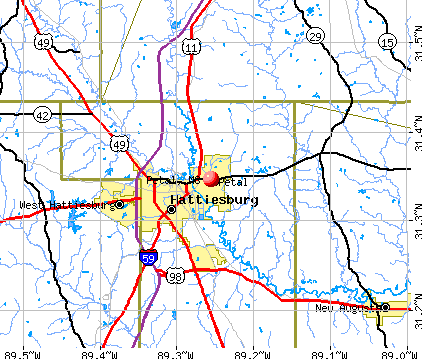


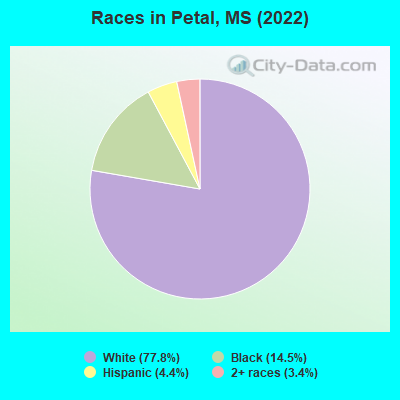
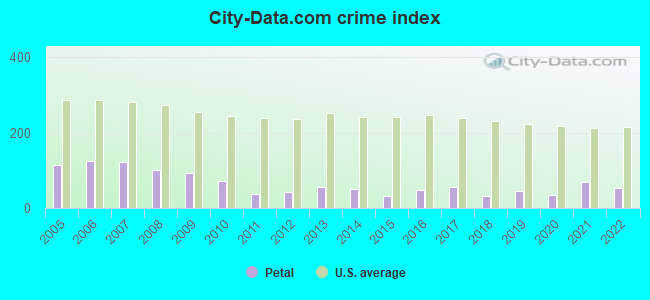
 Recent articles from our blog. Our writers, many of them Ph.D. graduates or candidates, create easy-to-read articles on a wide variety of topics.

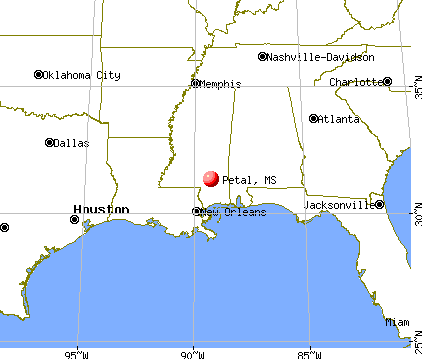
 (66.2 miles
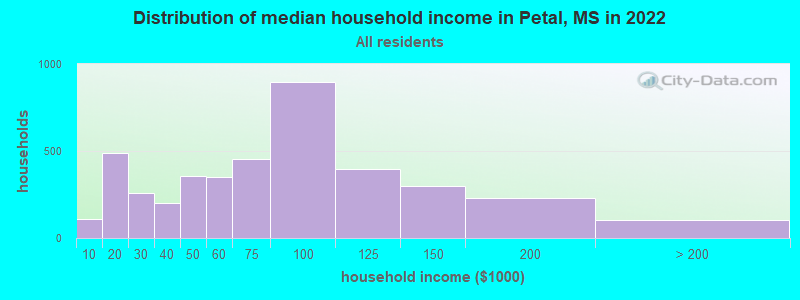
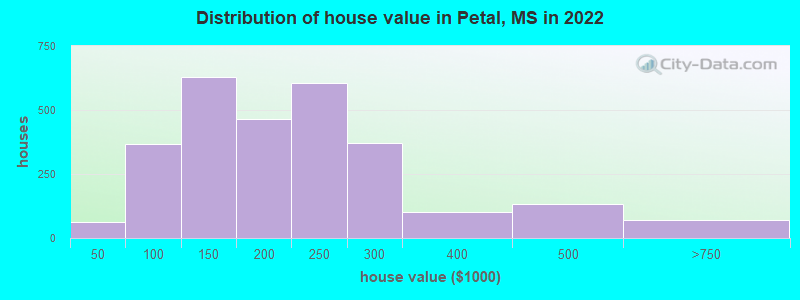
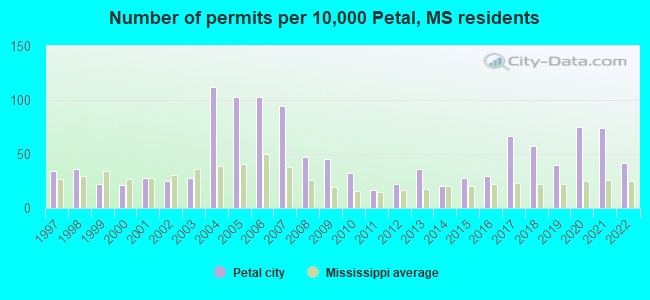
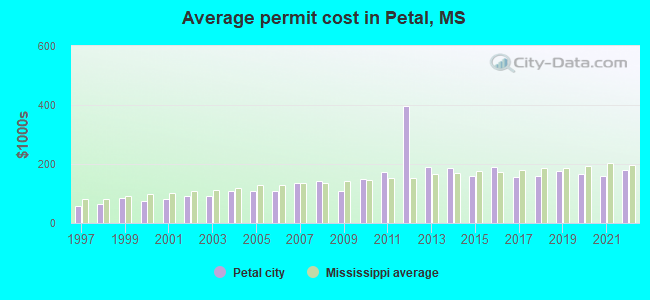
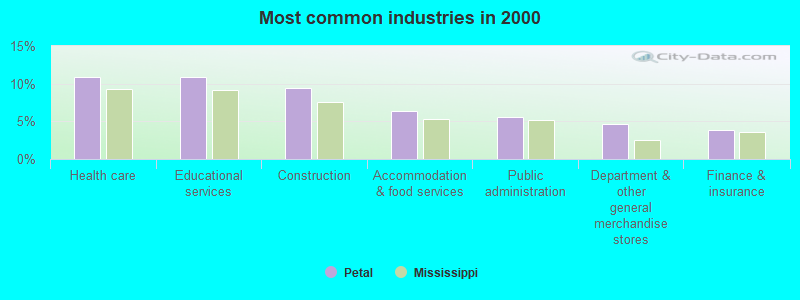
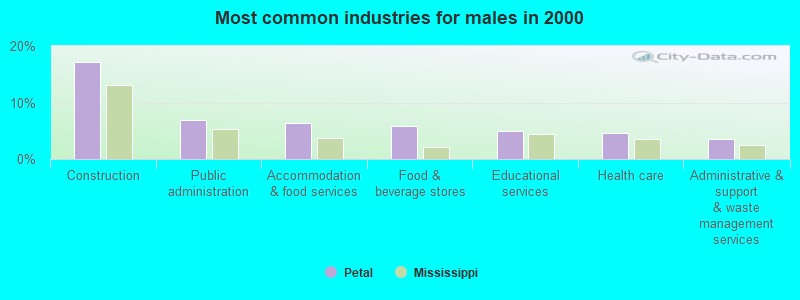
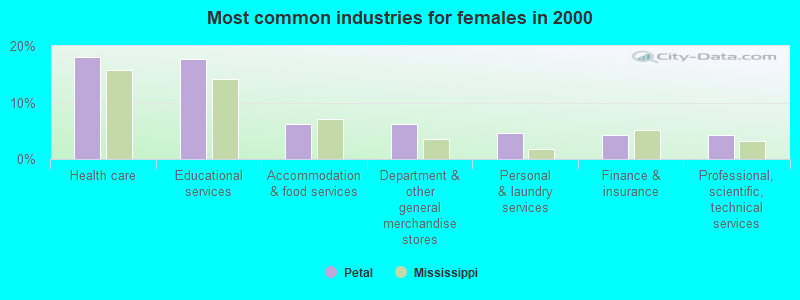
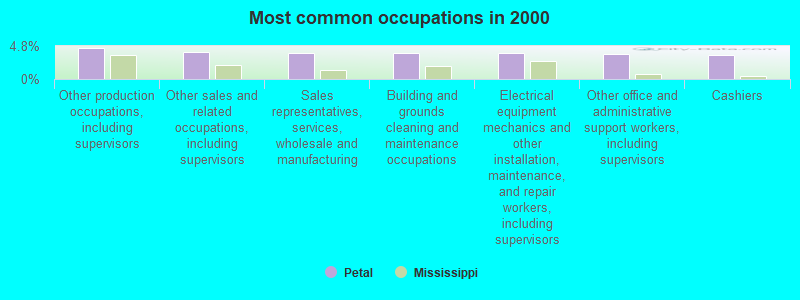
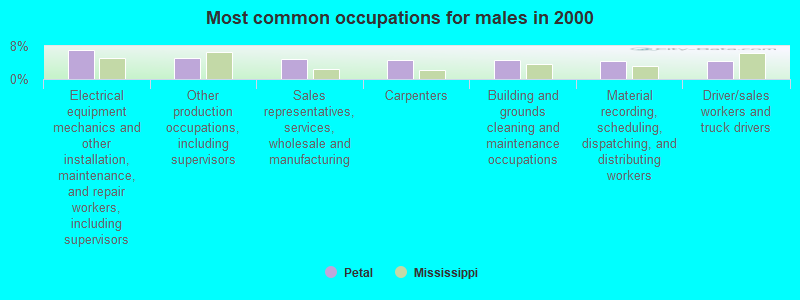
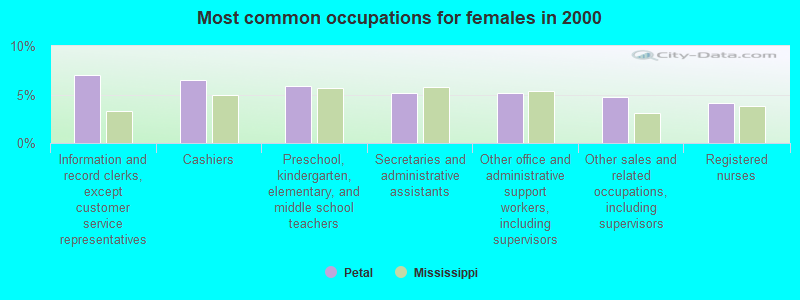
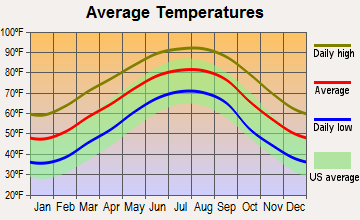
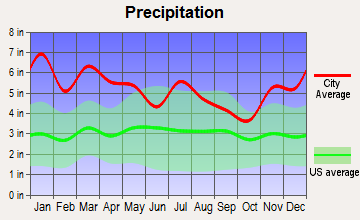
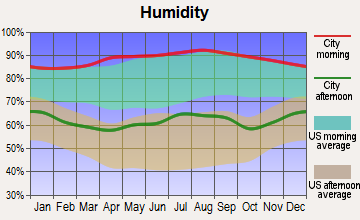
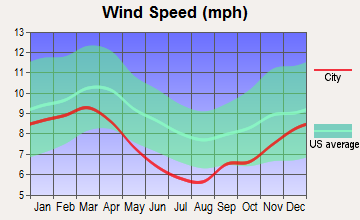
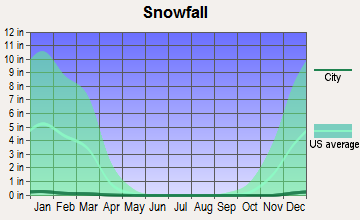
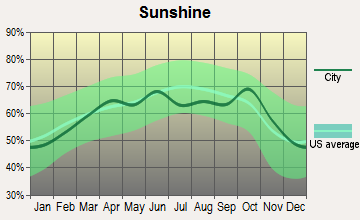
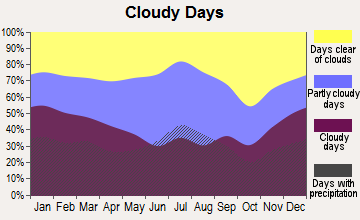
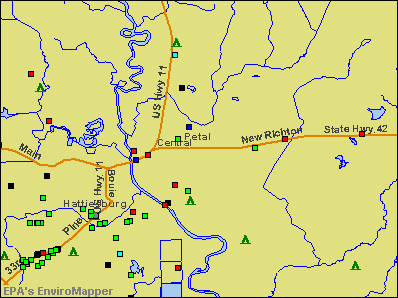

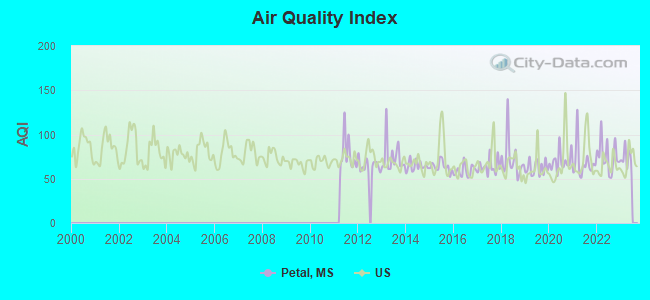
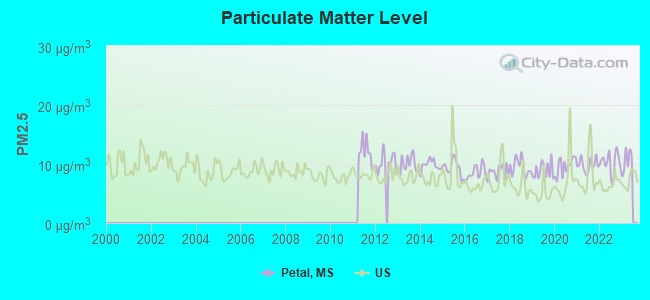

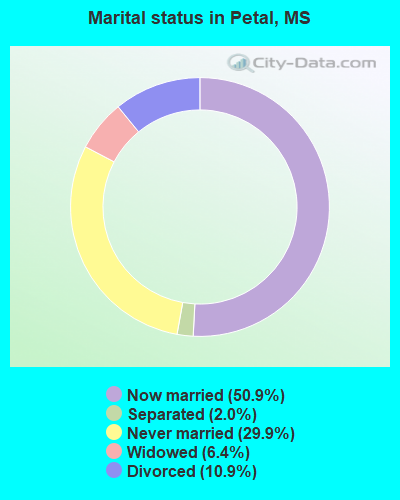
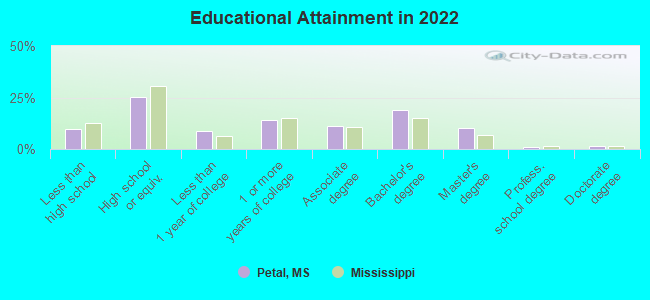
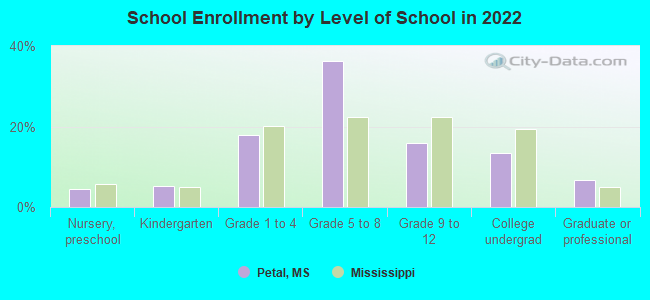
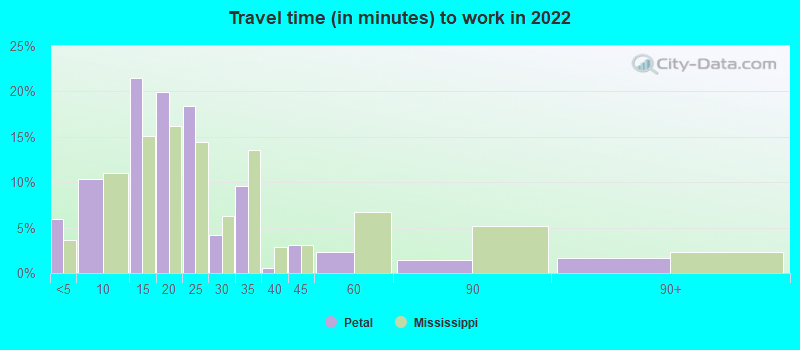
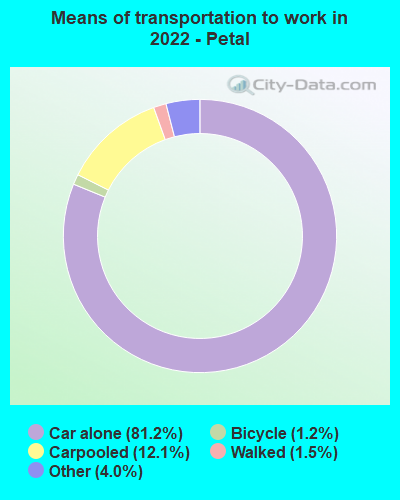
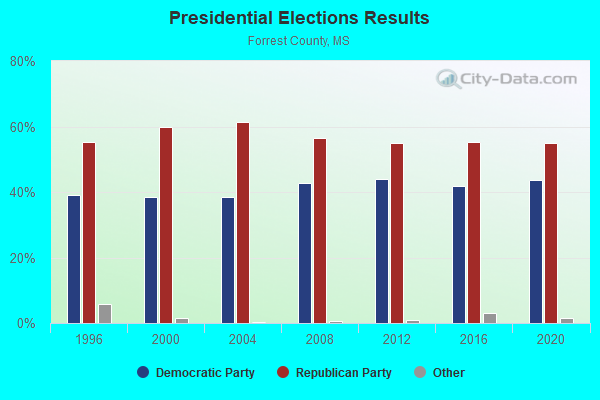
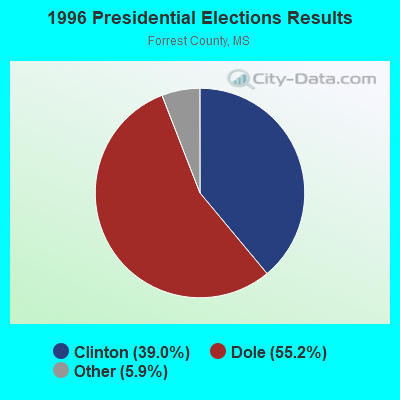
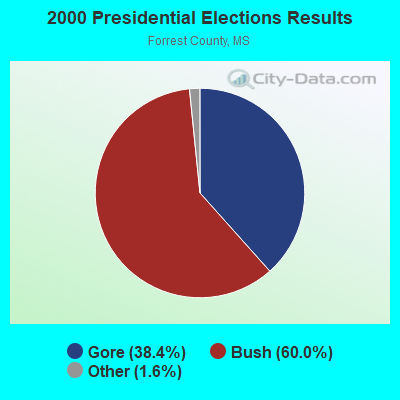
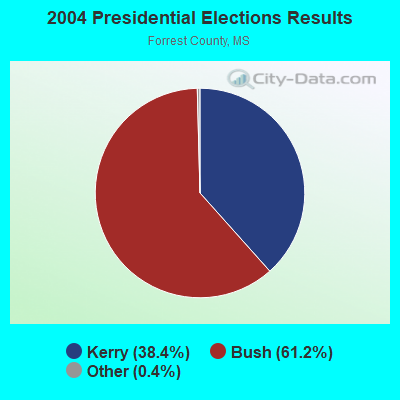
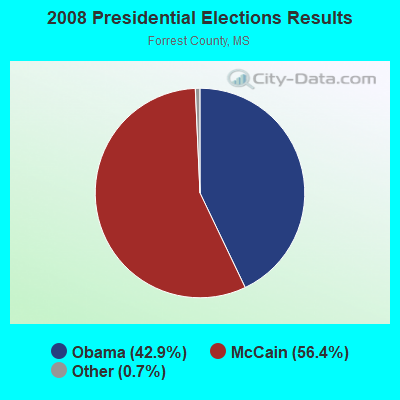
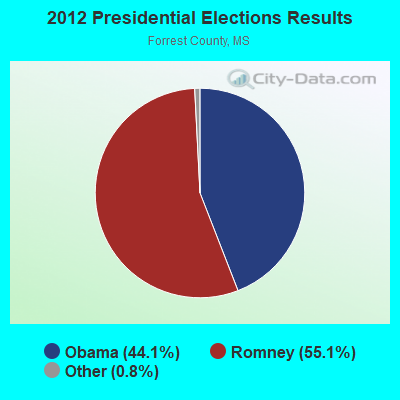
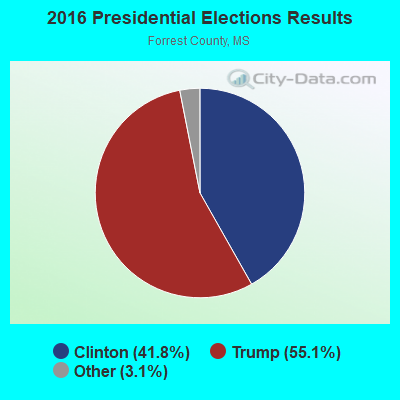
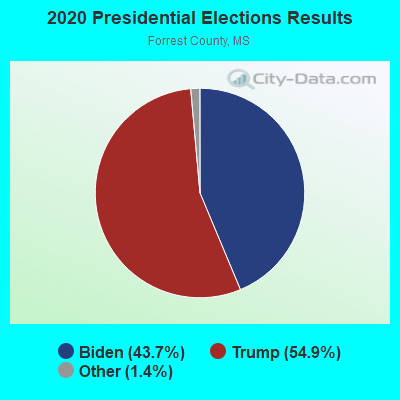
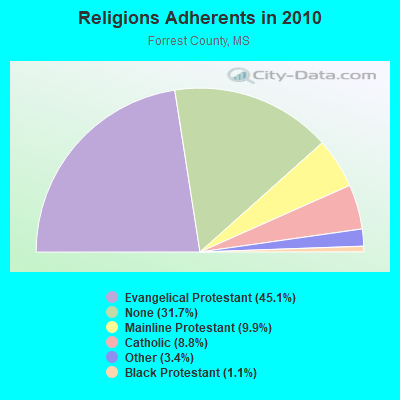
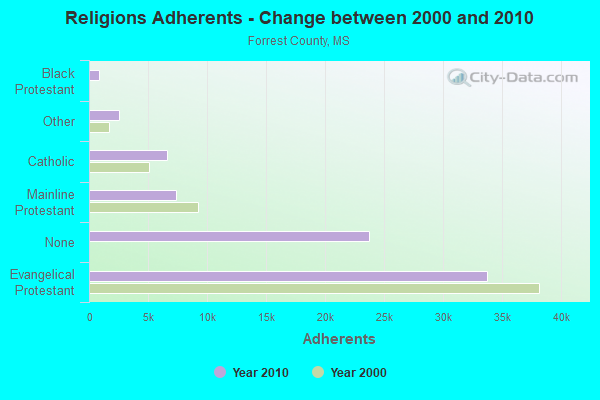
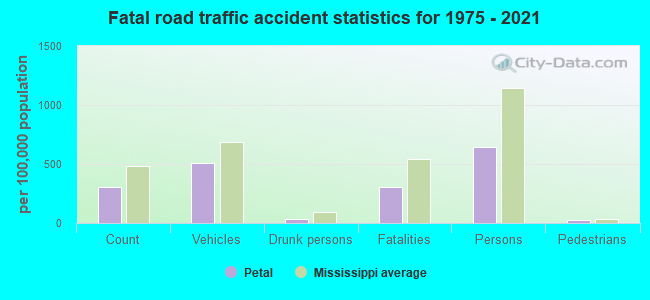
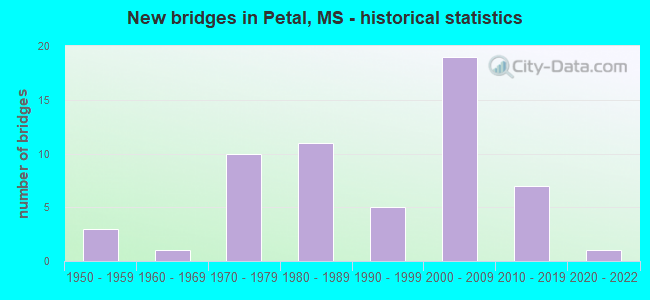
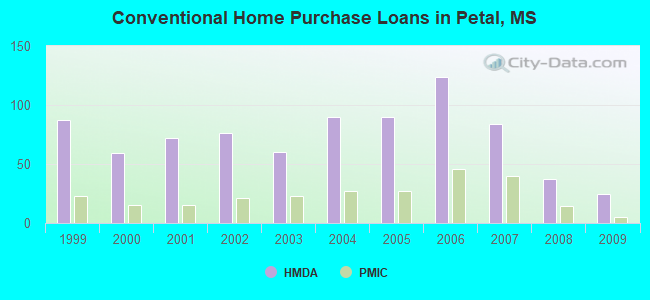
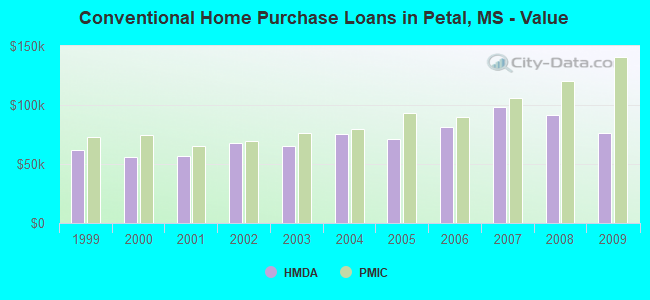
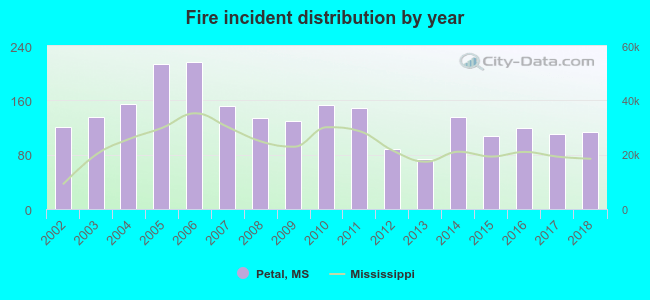 Based on the data from the years 2002 - 2018 the average number of fire incidents per year is 136. The highest number of fire incidents - 216 took place in 2006, and the least - 74 in 2013. The data has a declining trend.
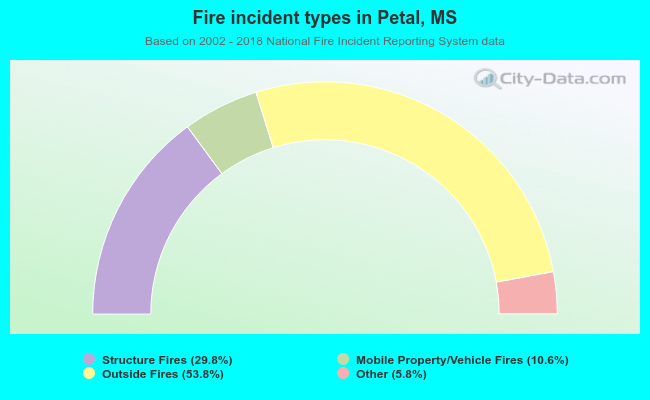 When looking into fire subcategories, the most reports belonged to: Outside Fires (53.8%), and Structure Fires (29.8%).