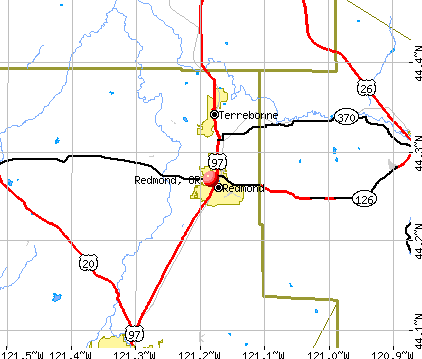
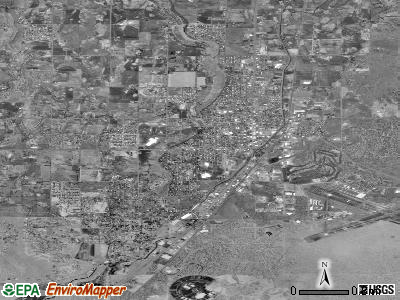
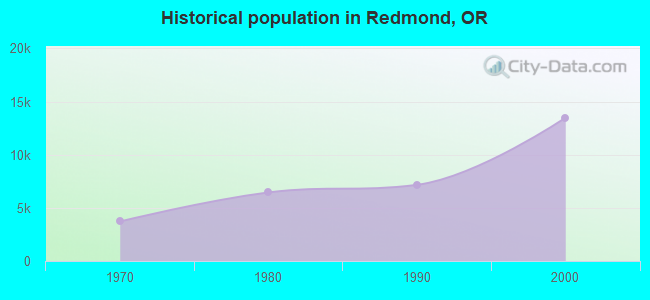
Redmond, Oregon
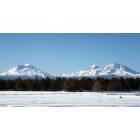
Redmond: The Three Sisters mountain range outside of Redmond
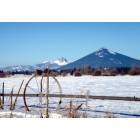
Redmond: Mount Jefferson behind a snow-covered field
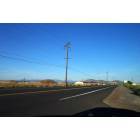
Redmond: A look at HWY 20 heading towards Sisters with the Baptist Church in the background as well as the mountains User comments: It is actually Hwy 126
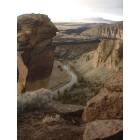
Redmond: Smith Rock State Park
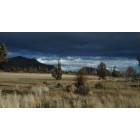
Redmond: Dramatic Skies
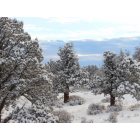
Redmond: Snowy Day in December 2010 in Redmond Oregon
- add
your
Submit your own pictures of this city and show them to the world
- OSM Map
- General Map
- Google Map
- MSN Map
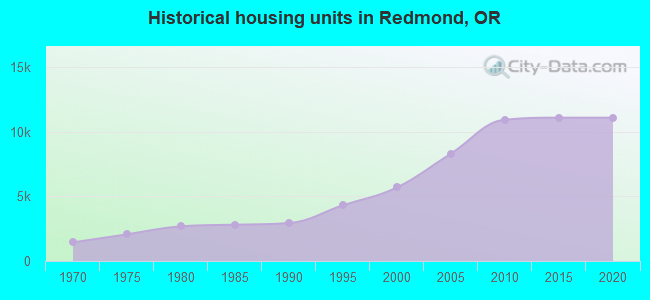
Population change since 2000: +170.1%
| Males: 16,979 | |
| Females: 19,430 |
| Median resident age: | 37.3 years |
| Oregon median age: | 40.5 years |
Zip codes: 97756.
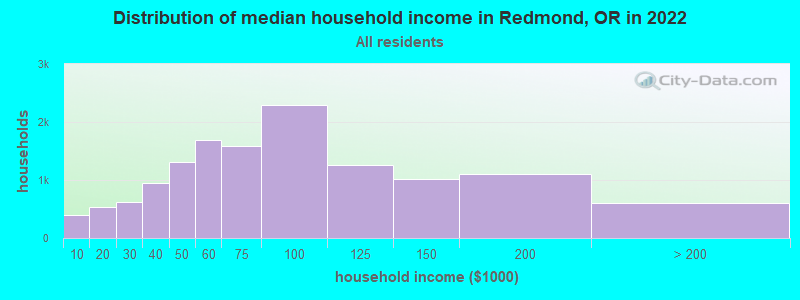
| Redmond: | $72,807 |
| OR: | $75,657 |
Estimated per capita income in 2022: $35,106 (it was $16,286 in 2000)
Redmond city income, earnings, and wages data
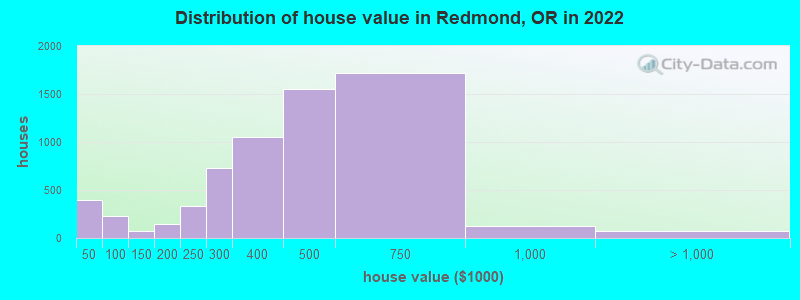
Estimated median house or condo value in 2022: $479,009 (it was $106,900 in 2000)
| Redmond: | $479,009 |
| OR: | $475,600 |
Mean prices in 2022: all housing units: $309,002; detached houses: $323,308; townhouses or other attached units: $316,301; mobile homes: $126,710
Median gross rent in 2022: $1,372.
(9.2% for White Non-Hispanic residents, 3.3% for Hispanic or Latino residents, 18.5% for American Indian residents, 1.8% for other race residents, 7.3% for two or more races residents)
Detailed information about poverty and poor residents in Redmond, OR


Compare current foreclosures in Redmond, OR:
| Photo | Address | Area | Beds / Baths | Price | Details |
|---|---|---|---|---|---|

|
#1
NE 45th St
Redmond, OR 97756
|
1,506 sq. feet
|
2 baths 3 beds |
show details | |

|
#2
NE Upas Ave
Redmond, OR 97756
|
950 sq. feet
|
2 baths 3 beds |
show details | |

|
#3
NW 9th Pl
Redmond, OR 97756
|
1,313 sq. feet
|
2 baths 3 beds |
show details | |

|
#4
NW Maple Ave
Redmond, OR 97756
|
2,128 sq. feet
|
2 baths 3 beds |
show details | |

|
#5
NW Elm Ave
Redmond, OR 97756
|
819 sq. feet
|
1 baths 2 beds |
show details | |

|
#6
SW Fissure Loop
Redmond, OR 97756
|
1,349 sq. feet
|
2 baths 3 beds |
show details | |

|
#7
NW 38th St
Redmond, OR 97756
|
1,144 sq. feet
|
2 baths 4 beds |
show details | |

|
#8
NW Larch Dr
Redmond, OR 97756
|
2,890 sq. feet
|
3 baths 4 beds |
show details | |

|
#9
NW 19th St
Redmond, OR 97756
|
1,264 sq. feet
|
2 baths 3 beds |
show details | |

|
#10
SW Glacier Ave
Redmond, OR 97756
|
1,008 sq. feet
|
1 baths 3 beds |
show details |
| Photo | Address | Area | Beds / Baths | Price | Details |
|---|---|---|---|---|---|

|
#11
NW Ivy Ave
Redmond, OR 97756
|
1,872 sq. feet
|
2 baths 4 beds |
show details | |

|
#12
SW Pumice Ave
Redmond, OR 97756
|
1,008 sq. feet
|
2 baths 3 beds |
show details | |

|
#13
NW Teak Ave
Redmond, OR 97756
|
1,210 sq. feet
|
2 baths 3 beds |
show details | |

|
#14
SW Wickiup Ave
Redmond, OR 97756
|
2,112 sq. feet
|
4 baths 7 beds |
show details | |

|
#15
SW Indian Pl
Redmond, OR 97756
|
1,608 sq. feet
|
2 baths 4 beds |
show details | |

|
#16
NE Shoshone Ct
Redmond, OR 97756
|
1,188 sq. feet
|
2 baths 3 beds |
show details | |

|
#17
NW 20th St
Redmond, OR 97756
|
2,580 sq. feet
|
2 baths 4 beds |
show details | |

|
#18
SW 26th St
Redmond, OR 97756
|
1,420 sq. feet
|
2 baths 3 beds |
show details | |

|
#19
Waite St
Eugene, OR 97402
|
1,456 sq. feet
|
1 baths 2 beds |
show details | |

|
#20
NW Kingwood Ave
Redmond, OR 97756
|
1,710 sq. feet
|
2 baths 3 beds |
show details |
| Photo | Address | Area | Beds / Baths | Price | Details |
|---|---|---|---|---|---|

|
#21
NW 9th Pl
Redmond, OR 97756
|
1,394 sq. feet
|
2 baths 3 beds |
show details | |

|
#22
NW Fir Ave
Redmond, OR 97756
|
968 sq. feet
|
1 baths 3 beds |
show details | |

|
#23
SW 35th St
Redmond, OR 97756
|
1,525 sq. feet
|
2 baths 3 beds |
show details | |

|
#24
NW 20th St
Redmond, OR 97756
|
1,983 sq. feet
|
2 baths 3 beds |
show details | |

|
#25
SW 31st St
Redmond, OR 97756
|
2,628 sq. feet
|
4 baths 4 beds |
show details | |

|
#26
NW 9th Ln
Redmond, OR 97756
|
1,428 sq. feet
|
2 baths 3 beds |
show details | |

|
#27
SW Cascade Mountain Ln
Redmond, OR 97756
|
2,802 sq. feet
|
3 baths 6 beds |
show details | |

|
#28
SW Volcano Cir
Redmond, OR 97756
|
1,384 sq. feet
|
2 baths 3 beds |
show details | |

|
#29
SW 29th St
Redmond, OR 97756
|
1,279 sq. feet
|
2 baths 3 beds |
show details | |

|
#30
SW Newberry Ave
Redmond, OR 97756
|
1,235 sq. feet
|
2 baths 3 beds |
show details |
| Photo | Address | Area | Beds / Baths | Price | Details |
|---|---|---|---|---|---|

|
#31
SW Rimrock Way
Redmond, OR 97756
|
2,464 sq. feet
|
4 baths 6 beds |
show details | |

|
#32
SW 30th St
Redmond, OR 97756
|
1,088 sq. feet
|
1 baths 3 beds |
show details | |

|
#33
SW Lava Ave
Redmond, OR 97756
|
1,008 sq. feet
|
2 baths 3 beds |
show details | |

|
#34
NW 19th St Unit 16
Redmond, OR 97756
|
1,476 sq. feet
|
2 baths 3 beds |
show details | |

|
#35
NW 24th Pl
Redmond, OR 97756
|
1,523 sq. feet
|
2 baths 3 beds |
show details | |

|
#36
NW 8th St
Redmond, OR 97756
|
- sq. feet
|
- baths - beds |
show details | |

|
#37
NW Canal Blvd Apt 9
Redmond, OR 97756
|
- sq. feet
|
- baths - beds |
show details | |

|
#38
SW Metolius Ave, Apt 244
Redmond, OR 97756
|
- sq. feet
|
- baths - beds |
show details | |

|
#39
SW 28th Ct
Redmond, OR 97756
|
- sq. feet
|
- baths - beds |
show details | |

|
#40
SW Mesa Way
Redmond, OR 97756
|
- sq. feet
|
- baths - beds |
show details |
| Photo | Address | Area | Beds / Baths | Price | Details |
|---|---|---|---|---|---|

|
#41
SW Lava Ave # 14
Redmond, OR 97756
|
- sq. feet
|
- baths - beds |
show details | |

|
#42
SW 30th St
Redmond, OR 97756
|
- sq. feet
|
- baths - beds |
show details | |

|
#43
SW Evergreen Ave
Redmond, OR 97756
|
- sq. feet
|
- baths - beds |
show details | |

|
#44
SW Indian Cir
Redmond, OR 97756
|
- sq. feet
|
- baths - beds |
show details | |

|
#45
SW Juniper Ave
Redmond, OR 97756
|
- sq. feet
|
- baths - beds |
show details | |

|
#46
NW Oasis Dr
Redmond, OR 97756
|
- sq. feet
|
- baths - beds |
show details | |

|
#47
SW 37th St, Apt 233
Redmond, OR 97756
|
- sq. feet
|
- baths - beds |
show details | |

|
#48
SW 37th St, Apt 328
Redmond, OR 97756
|
- sq. feet
|
- baths - beds |
show details | |

|
#49
SW Lava Ave, Apt 124
Redmond, OR 97756
|
- sq. feet
|
- baths - beds |
show details | |

|
Check over 1 million property listings on Foreclosure.com!
|
browse all offers | |||


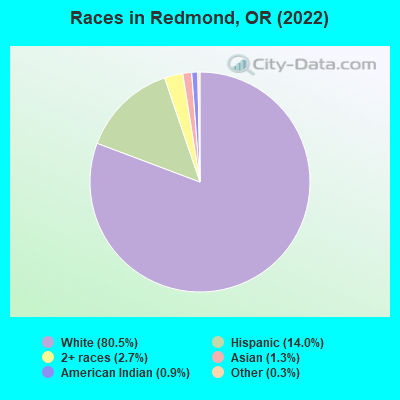
- 28,52080.5%White alone
- 4,95014.0%Hispanic
- 9422.7%Two or more races
- 4711.3%Asian alone
- 3120.9%American Indian alone
- 1080.3%Other race alone
- 300.08%Black alone
Races in Redmond detailed stats: ancestries, foreign born residents, place of birth
According to our research of Oregon and other state lists, there were 8 registered sex offenders living in Redmond, Oregon as of April 26, 2024.
The ratio of all residents to sex offenders in Redmond is 3,597 to 1.
The ratio of registered sex offenders to all residents in this city is lower than the state average.
Type |
2009 |
2010 |
2011 |
2012 |
2013 |
2014 |
2015 |
2016 |
2017 |
2018 |
2019 |
2020 |
2021 |
2022 |
|---|---|---|---|---|---|---|---|---|---|---|---|---|---|---|
| Murders (per 100,000) | 0 (0.0) | 0 (0.0) | 0 (0.0) | 0 (0.0) | 0 (0.0) | 0 (0.0) | 1 (3.5) | 1 (3.4) | 0 (0.0) | 0 (0.0) | 0 (0.0) | 0 (0.0) | 1 (2.8) | 0 (0.0) |
| Rapes (per 100,000) | 16 (61.9) | 17 (64.8) | 16 (60.4) | 12 (44.7) | 11 (40.5) | 17 (61.3) | 14 (49.3) | 13 (44.6) | 18 (60.3) | 18 (58.8) | 11 (34.9) | 16 (48.2) | 22 (62.4) | 8 (21.3) |
| Robberies (per 100,000) | 8 (30.9) | 12 (45.8) | 12 (45.3) | 14 (52.2) | 15 (55.2) | 24 (86.5) | 11 (38.8) | 9 (30.9) | 11 (36.8) | 14 (45.8) | 7 (22.2) | 10 (30.1) | 10 (28.4) | 7 (18.7) |
| Assaults (per 100,000) | 53 (205.0) | 60 (228.9) | 53 (200.0) | 66 (245.9) | 61 (224.7) | 50 (180.3) | 49 (172.6) | 58 (198.9) | 57 (190.8) | 43 (140.5) | 57 (180.6) | 64 (192.8) | 51 (144.8) | 47 (125.4) |
| Burglaries (per 100,000) | 175 (676.8) | 190 (724.8) | 218 (822.8) | 200 (745.3) | 158 (581.9) | 107 (385.8) | 128 (451.0) | 85 (291.5) | 115 (385.0) | 101 (330.1) | 87 (275.7) | 94 (283.1) | 63 (178.8) | 54 (144.1) |
| Thefts (per 100,000) | 888 (3,434) | 1,122 (4,280) | 1,181 (4,458) | 1,041 (3,879) | 877 (3,230) | 830 (2,993) | 859 (3,026) | 803 (2,753) | 757 (2,534) | 940 (3,072) | 960 (3,042) | 858 (2,584) | 703 (1,995) | 661 (1,764) |
| Auto thefts (per 100,000) | 49 (189.5) | 53 (202.2) | 53 (200.0) | 54 (201.2) | 43 (158.4) | 48 (173.1) | 60 (211.4) | 88 (301.7) | 79 (264.5) | 80 (261.5) | 73 (231.3) | 109 (328.3) | 107 (303.7) | 86 (229.5) |
| Arson (per 100,000) | 16 (61.9) | 30 (114.4) | 15 (56.6) | 19 (70.8) | 11 (40.5) | 11 (39.7) | 8 (28.2) | 7 (24.0) | 3 (10.0) | 10 (32.7) | 10 (31.7) | 6 (18.1) | 12 (34.1) | 7 (18.7) |
| City-Data.com crime index | 299.7 | 349.5 | 353.8 | 324.1 | 276.5 | 271.6 | 262.2 | 246.2 | 246.9 | 255.8 | 230.1 | 235.6 | 209.7 | 146.8 |
The City-Data.com crime index weighs serious crimes and violent crimes more heavily. Higher means more crime, U.S. average is 246.1. It adjusts for the number of visitors and daily workers commuting into cities.
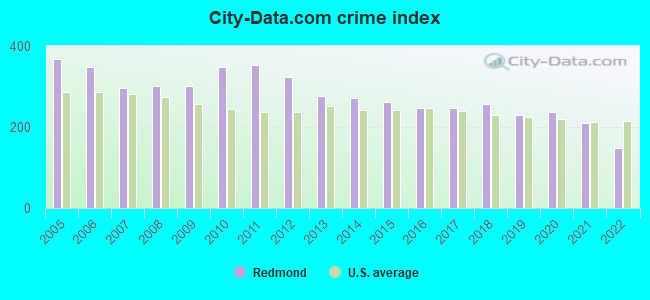
Crime rate in Redmond detailed stats: murders, rapes, robberies, assaults, burglaries, thefts, arson
Full-time law enforcement employees in 2021, including police officers: 62 (48 officers - 43 male; 5 female).
| Officers per 1,000 residents here: | 1.36 |
| Oregon average: | 1.48 |
 Recent articles from our blog. Our writers, many of them Ph.D. graduates or candidates, create easy-to-read articles on a wide variety of topics.

 | Bend vs Redmond (28 replies) |
| Can anyone recommend a job recruiter in Bend\Redmond? (5 replies) |
| Anyone Familiar With Redmond? (17 replies) |
| Overcrowded? Who is leaving and why? (113 replies) |
| Median Home Price Bend/Redmond (6 replies) |
| Redmond Home Values Summer-Fall 2014 (67 replies) |
Latest news from Redmond, OR collected exclusively by city-data.com from local newspapers, TV, and radio stations
Ancestries: English (13.6%), German (8.8%), American (7.7%), Irish (7.4%), European (6.9%), Norwegian (4.5%).
Current Local Time: PST time zone
Incorporated in 1910
Elevation: 2997 feet
Land area: 10.2 square miles.
Population density: 3,556 people per square mile (average).
2,020 residents are foreign born (4.6% Latin America, 0.6% Europe).
| This city: | 5.7% |
| Oregon: | 9.8% |
Median real estate property taxes paid for housing units with mortgages in 2022: $2,942 (0.6%)
Median real estate property taxes paid for housing units with no mortgage in 2022: $3,198 (0.6%)
Nearest city with pop. 50,000+: Bend, OR  (15.9 miles , pop. 52,029).
Nearest city with pop. 200,000+: Northwest Clackamas, OR (105.1 miles , pop. 224,220).
Nearest city with pop. 1,000,000+: Los Angeles, CA (720.1 miles , pop. 3,694,820).
Nearest cities:
), ), )Latitude: 44.27 N, Longitude: 121.18 W
Daytime population change due to commuting: +51 (+0.1%)
Workers who live and work in this city: 8,795 (50.7%)
Area code: 541
Property values in Redmond, OR
Redmond tourist attractions:
Redmond, Oregon accommodation & food services, waste management - Economy and Business Data
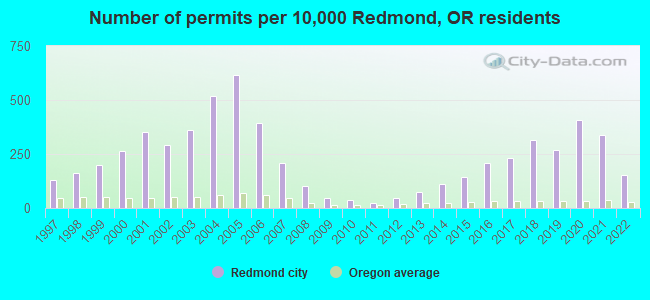
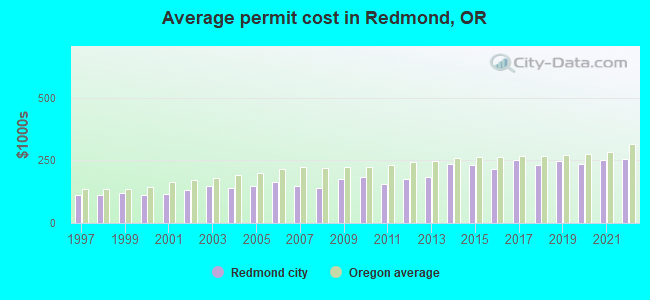
Single-family new house construction building permits:
- 2022: 207 buildings, average cost: $254,000
- 2021: 458 buildings, average cost: $251,800
- 2020: 551 buildings, average cost: $235,300
- 2019: 361 buildings, average cost: $247,300
- 2018: 422 buildings, average cost: $233,000
- 2017: 311 buildings, average cost: $250,100
- 2016: 279 buildings, average cost: $217,000
- 2015: 191 buildings, average cost: $233,100
- 2014: 148 buildings, average cost: $236,000
- 2013: 100 buildings, average cost: $185,200
- 2012: 62 buildings, average cost: $176,700
- 2011: 31 buildings, average cost: $156,600
- 2010: 52 buildings, average cost: $182,300
- 2009: 59 buildings, average cost: $177,000
- 2008: 140 buildings, average cost: $139,200
- 2007: 281 buildings, average cost: $147,700
- 2006: 529 buildings, average cost: $161,900
- 2005: 829 buildings, average cost: $149,000
- 2004: 699 buildings, average cost: $139,800
- 2003: 487 buildings, average cost: $146,400
- 2002: 392 buildings, average cost: $132,300
- 2001: 477 buildings, average cost: $116,200
- 2000: 358 buildings, average cost: $110,600
- 1999: 270 buildings, average cost: $118,200
- 1998: 216 buildings, average cost: $112,400
- 1997: 177 buildings, average cost: $112,300
| Here: | 4.9% |
| Oregon: | 3.9% |
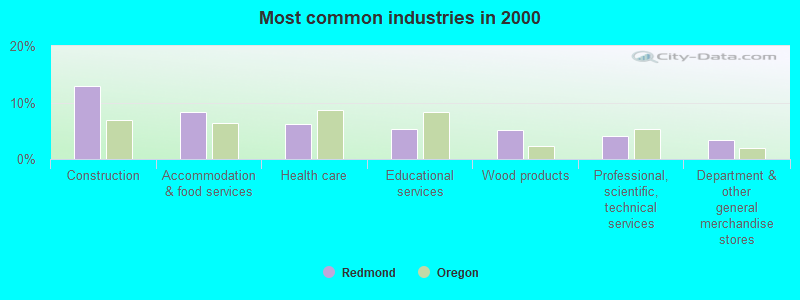
- Construction (13.0%)
- Accommodation & food services (8.2%)
- Health care (6.1%)
- Educational services (5.4%)
- Wood products (5.1%)
- Professional, scientific, technical services (4.1%)
- Department & other general merchandise stores (3.4%)
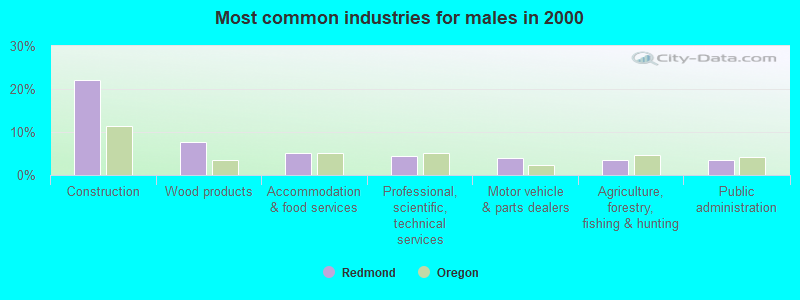
- Construction (22.2%)
- Wood products (7.7%)
- Accommodation & food services (5.1%)
- Professional, scientific, technical services (4.5%)
- Motor vehicle & parts dealers (3.9%)
- Agriculture, forestry, fishing & hunting (3.6%)
- Public administration (3.5%)
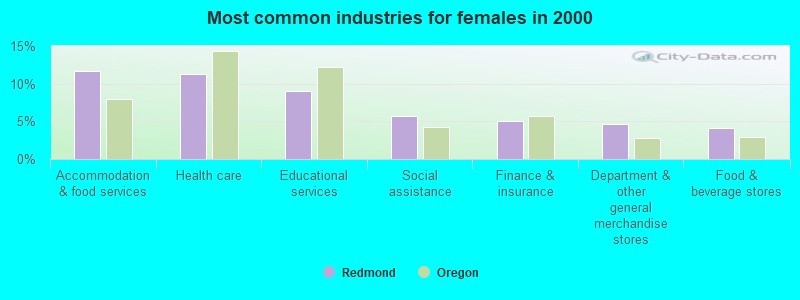
- Accommodation & food services (11.7%)
- Health care (11.3%)
- Educational services (9.0%)
- Social assistance (5.8%)
- Finance & insurance (5.1%)
- Department & other general merchandise stores (4.6%)
- Food & beverage stores (4.1%)
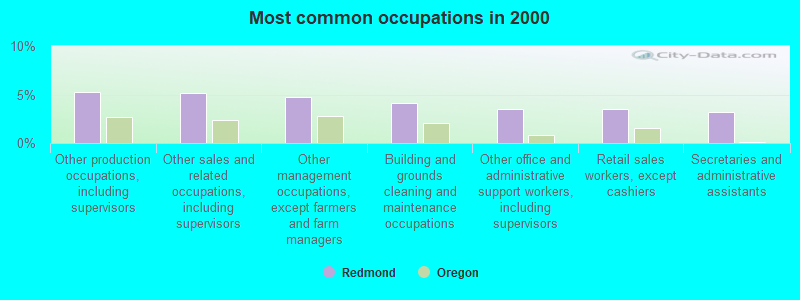
- Other production occupations, including supervisors (5.3%)
- Other sales and related occupations, including supervisors (5.2%)
- Other management occupations, except farmers and farm managers (4.7%)
- Building and grounds cleaning and maintenance occupations (4.1%)
- Other office and administrative support workers, including supervisors (3.5%)
- Retail sales workers, except cashiers (3.5%)
- Secretaries and administrative assistants (3.2%)
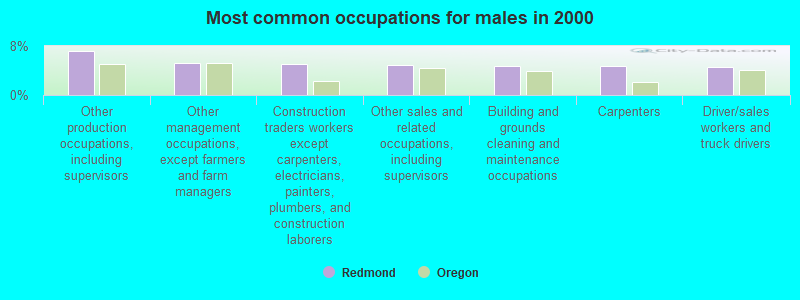
- Other production occupations, including supervisors (7.1%)
- Other management occupations, except farmers and farm managers (5.3%)
- Construction traders workers except carpenters, electricians, painters, plumbers, and construction laborers (5.1%)
- Other sales and related occupations, including supervisors (4.9%)
- Building and grounds cleaning and maintenance occupations (4.7%)
- Carpenters (4.7%)
- Driver/sales workers and truck drivers (4.6%)
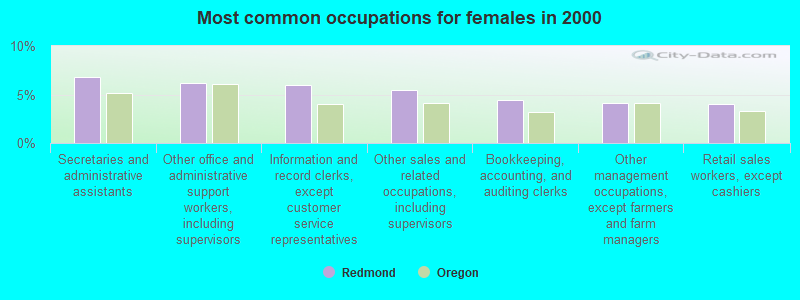
- Secretaries and administrative assistants (6.8%)
- Other office and administrative support workers, including supervisors (6.2%)
- Information and record clerks, except customer service representatives (6.0%)
- Other sales and related occupations, including supervisors (5.5%)
- Bookkeeping, accounting, and auditing clerks (4.4%)
- Other management occupations, except farmers and farm managers (4.1%)
- Retail sales workers, except cashiers (4.0%)
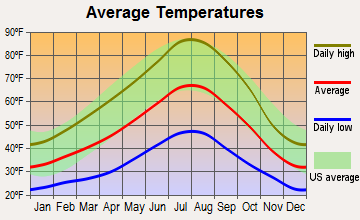
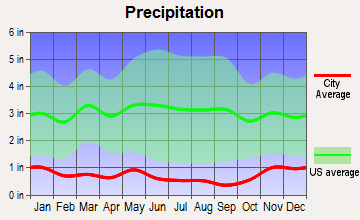
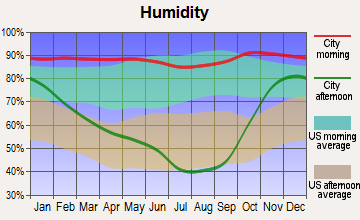
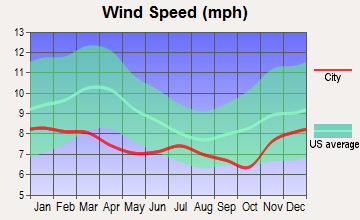
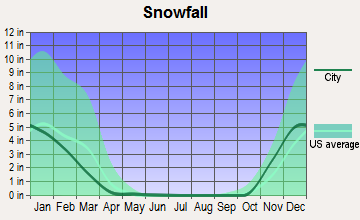
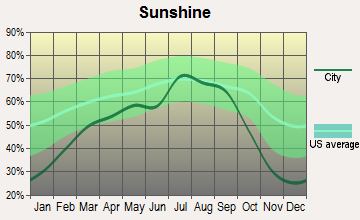
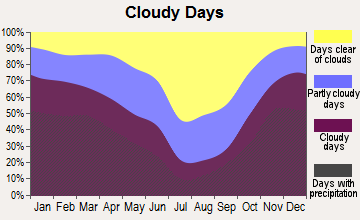
Average climate in Redmond, Oregon
Based on data reported by over 4,000 weather stations
|
|

(lower is better)
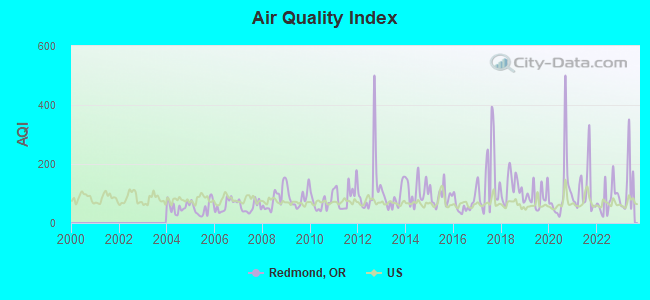
Air Quality Index (AQI) level in 2023 was 126. This is significantly worse than average.
| City: | 126 |
| U.S.: | 73 |
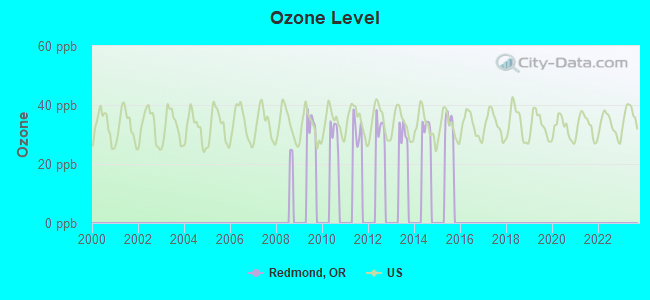
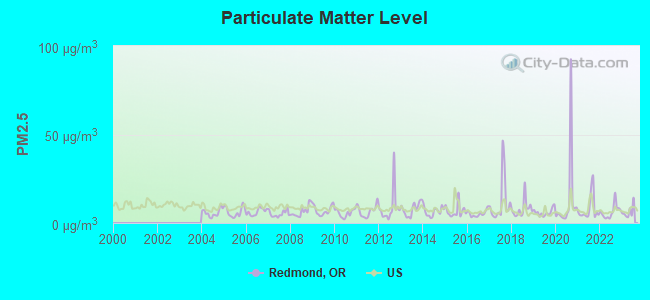
Particulate Matter (PM2.5) [µg/m3] level in 2023 was 6.32. This is better than average. Closest monitor was 15.6 miles away from the city center.
| City: | 6.32 |
| U.S.: | 8.11 |
Earthquake activity:
Redmond-area historical earthquake activity is significantly above Oregon state average. It is 2442% greater than the overall U.S. average.On 10/3/1915 at 06:52:48, a magnitude 7.6 (7.6 UK, Class: Major, Intensity: VIII - XII) earthquake occurred 321.4 miles away from Redmond center
On 1/31/1922 at 13:17:28, a magnitude 7.6 (7.6 UK) earthquake occurred 332.5 miles away from Redmond center
On 4/13/1949 at 19:55:42, a magnitude 7.0 (7.0 UK) earthquake occurred 215.7 miles away from Redmond center, causing $80,000,000 total damage
On 11/8/1980 at 10:27:34, a magnitude 7.2 (6.2 MB, 7.2 MS, 7.2 MW, 7.0 ML) earthquake occurred 269.9 miles away from Redmond center
On 2/28/2001 at 18:54:32, a magnitude 6.8 (6.5 MB, 6.6 MS, 6.8 MW, Class: Strong, Intensity: VII - IX) earthquake occurred 206.5 miles away from the city center, causing $2,000,000,000 total damage and $305,000,000 insured losses
On 2/28/2001 at 18:54:32, a magnitude 6.8 (6.8 MD, Depth: 32.2 mi) earthquake occurred 212.7 miles away from the city center
Magnitude types: body-wave magnitude (MB), duration magnitude (MD), local magnitude (ML), surface-wave magnitude (MS), moment magnitude (MW)
Natural disasters:
The number of natural disasters in Deschutes County (12) is smaller than the US average (15).Major Disasters (Presidential) Declared: 4
Emergencies Declared: 2
Causes of natural disasters: Fires: 5, Floods: 3, Winter Storms: 2, Drought: 1, Heavy Rain: 1, Hurricane: 1, Landslide: 1, Mudslide: 1, Storm: 1, Wind: 1, Other: 1 (Note: some incidents may be assigned to more than one category).
Hospitals and medical centers in Redmond:
- HOSPICE OF REDMOND, SISTERS AND GRANT COUNTY (732 S W 23RD STREET)
- ST CHARLES MEDICAL CENTER - REDMOND (Voluntary non-profit - Private, provides emergency services, 1253 N CANAL BLVD)
- REDMOND HEALTH CARE CTR (3025 SW RESERVOIR DRIVE)
- FRESENIUS MEDICAL CARE DIALYSIS SERVICES, OREGON, LLC (916 SW 17TH ST STE 100)
- CODH HOME HEALTH AGENCY (1253 NORTH CANAL BOULEVARD)
Airports and heliports located in Redmond:
- Roberts Field Airport (RDM) (Runways: 3, Commercial Ops: 4,557, Air Taxi Ops: 6,755, Itinerant Ops: 11,546, Local Ops: 22,138, Military Ops: 715)
- Cline Falls Air Park Airport (3OR8) (Runways: 1)
- River Run Ranch Airport (OR02) (Runways: 1)
- Cinder Butte Heliport (62OR)
Colleges/universities with over 2000 students nearest to Redmond:
- Central Oregon Community College (about 16 miles; Bend, OR; Full-time enrollment: 5,217)
- Lane Community College (about 94 miles; Eugene, OR; FT enrollment: 6,373)
- University of Oregon (about 96 miles; Eugene, OR; FT enrollment: 23,329)
- Linn-Benton Community College (about 98 miles; Albany, OR; FT enrollment: 4,511)
- Clackamas Community College (about 100 miles; Oregon City, OR; FT enrollment: 4,261)
- Chemeketa Community College (about 102 miles; Salem, OR; FT enrollment: 10,746)
- Willamette University (about 102 miles; Salem, OR; FT enrollment: 2,551)
Public high schools in Redmond:
- REDMOND HIGH SCHOOL (Students: 1,918, Location: 675 SW RIMROCK DR, Grades: 9-12)
- REDMOND PROFICIENCY ACADEMY (Location: 657 SW GLACIER, Grades: 6-12, Charter school)
- RIDGEVIEW HIGH SCHOOL (Location: 4555 SW ELKHORN RD, Grades: 9-12)
Private high school in Redmond:
Public elementary/middle schools in Redmond:
- OBSIDIAN MIDDLE SCHOOL (Students: 713, Location: 1335 SW OBSIDIAN AVE, Grades: 6-8)
- TOM MCCALL ELEMENTARY SCHOOL (Students: 601, Location: 1200 NW UPAS AVE, Grades: KG-5)
- ELTON GREGORY MIDDLE SCHOOL (Students: 561, Location: 1220 NW UPAS AVE, Grades: 6-8)
- VERN PATRICK ELEMENTARY SCHOOL (Students: 540, Location: 3001 SW OBSIDIAN, Grades: KG-5)
- JOHN TUCK ELEMENTARY SCHOOL (Students: 476, Location: 209 NW 10TH ST, Grades: KG-5)
- M A LYNCH ELEMENTARY SCHOOL (Students: 469, Location: 1314 SW KALAMA AVE, Grades: KG-5)
- SAGE ELEMENTARY SCHOOL (Location: 2790 SW WICKIUP, Grades: KG-5)
Private elementary/middle school in Redmond:
Points of interest:
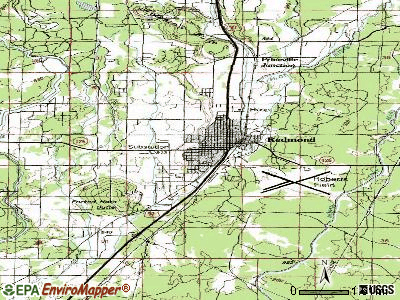
Notable locations in Redmond: Juniper Golf Course (A), Deschutes County Fairgrounds (B), Cascades East Transit Redmond Worksource Park and Ride (C), Sam Johnson City Park Outdoor Stage (D), Juniper Arena (E), American Legion Community Park Rotary Arts Pavilion (F), Redmond Water Treatment System (G), Redmond Water Pollution Control Facility (H), Sagebrush Arena (I), Deschutes County Fairgrounds (J), Redmond Fire and Rescue Station 403 Airport (K), Redmond City Hall (L), Redmond Fire and Rescue Station 401 Headquarters (M), Redmond Police Station (N), Three Sisters Conference Center (O), Redmond Public Library (P), Hooker Creek Event Center (Q), Deschutes County Justice Court Redmond (R), Redmond Public Works Main Facility (S), United States Forest Service Redmond Hotshots (T). Display/hide their locations on the map
Cemetery: Redmond Cemetery (1). Display/hide its location on the map
Lake: Lions Lake (A). Display/hide its location on the map
Parks in Redmond include: Fairhaven City Park (1), Spudbowl City Park (2), Valleyview City Park (3), Ray Johnson Park (4), Baker City Park (5), Bowlby City Park (6), Firemans Lake City Park (7), Hayden City Park (8), Kalama City Park (9). Display/hide their locations on the map
Tourist attractions: Petersen Rock Garden & Museum (Cultural Attractions- Events- & Facilities; 7930 Southwest 77th Street), Redmond Family Fun Center (Amusement & Theme Parks; 512 Southwest 6th Street), Obsidian Billiards & Darts (Amusement & Theme Parks; 1611 Southwest First Street), Joe's Custom Billiards (Amusement & Theme Parks; 2498 South Highway 97), Fountain Place Restaurant (3709 Southwest 21st Place).
Hotels: Budget Motel (517 Northwest Birch Avenue), Hub Motel (1128 Northwest 6th Street), Greenway Motel (517 Northwest Birch Avenue), Best Western Rama Inn (2630 Southwest 17th Place), Eagle Crest Resort (1522 Cline Falls Rd), Comfort Suites (2243 Southwest Yew Avenue), Redmond Super 8 Motel (3629 SW 21st Pl), Redmond Inn (1545 South Highway 97), City Center Motel (350 Northwest 6th Street).
Court: Deschutes County - Justice Court (737 Southwest Cascade Avenue).
Birthplace of: Maarty Leunen - College basketball player (Oregon Ducks).
Drinking water stations with addresses in Redmond and their reported violations in the past:
CLINE BUTTE WATER LLC (Population served: 950, Groundwater):Past monitoring violations:EAGLE CREST RESORT (Population served: 400, Groundwater):
- 2 routine major monitoring violations
Past health violations:HIDDEN VALLEY MBL ESTS IMP DIS (Population served: 240, Groundwater):Past monitoring violations:
- MCL, Monthly (TCR) - In MAY-2010, Contaminant: Coliform. Follow-up actions: St Compliance achieved (JUN-04-2010), St Public Notif requested (JUN-14-2010), St Violation/Reminder Notice (JUN-21-2010)
- 2 routine major monitoring violations
- 52 regular monitoring violations
Past health violations:DESERT MEADOWS HOA (Population served: 150, Purch groundwater):Past monitoring violations:
- MCL, Monthly (TCR) - In AUG-2010, Contaminant: Coliform. Follow-up actions: St Public Notif requested (SEP-22-2010), St Violation/Reminder Notice (SEP-27-2010), St Compliance achieved (SEP-30-2010), St Public Notif received (OCT-01-2010)
- MCL, Monthly (TCR) - In OCT-2009, Contaminant: Coliform. Follow-up actions: St Public Notif requested (NOV-16-2009), St Compliance achieved (NOV-19-2009), St Violation/Reminder Notice (NOV-23-2009)
- MCL, Monthly (TCR) - In SEP-2009, Contaminant: Coliform. Follow-up actions: St Public Notif requested (OCT-14-2009), St Violation/Reminder Notice (OCT-19-2009), St Compliance achieved (NOV-19-2009)
- MCL, Acute (TCR) - In AUG-2009, Contaminant: Coliform. Follow-up actions: St Public Notif requested (AUG-12-2009), St Violation/Reminder Notice (AUG-31-2009), St Compliance achieved (APR-28-2011)
- MCL, Monthly (TCR) - In AUG-2006, Contaminant: Coliform. Follow-up actions: St Compliance achieved (NOV-07-2006)
- Monitoring, Repeat Major (TCR) - In SEP-2006, Contaminant: Coliform (TCR). Follow-up actions: St Compliance achieved (DEC-04-2006)
- Follow-up Or Routine LCR Tap M/R - In JAN-01-2005, Contaminant: Lead and Copper Rule. Follow-up actions: St Compliance achieved (AUG-01-2007)
- One minor monitoring violation
Past monitoring violations:ROUND LAKE CHRISTIAN CAMP (Population served: 150, Groundwater):
- Initial Tap Sampling for Pb and Cu - In JAN-01-2014, Contaminant: Lead and Copper Rule. Follow-up actions: St Compliance achieved (APR-14-2014)
- Initial Tap Sampling for Pb and Cu - In JUL-01-2013, Contaminant: Lead and Copper Rule. Follow-up actions: St Compliance achieved (APR-14-2014)
Past health violations:MOUNTAIN BROOK HOMEOWNERS ASSOCIATION (Population served: 136, Purch groundwater):Past monitoring violations:
- MCL, Monthly (TCR) - Between JUL-2009 and SEP-2009, Contaminant: Coliform. Follow-up actions: St Public Notif received (SEP-25-2009), St Compliance achieved (OCT-13-2009), St Public Notif requested (OCT-14-2009), St Violation/Reminder Notice (OCT-19-2009)
- Monitoring, Source Water (GWR) - In NOV-06-2013, Contaminant: E. COLI
Past monitoring violations:LA CASA MIA (Population served: 135, Groundwater):
- 7 routine major monitoring violations
Past monitoring violations:FOUR SEASONS MHP (Population served: 100, Groundwater):
- One routine major monitoring violation
- 12 regular monitoring violations
Past health violations:Past monitoring violations:
- MCL, Monthly (TCR) - In JUL-2008, Contaminant: Coliform. Follow-up actions: St Compliance achieved (NOV-05-2008), St AO (w/o penalty) issued (MAY-07-2009)
- MCL, Monthly (TCR) - In JUN-2008, Contaminant: Coliform. Follow-up actions: St Compliance achieved (AUG-05-2008), St AO (w/o penalty) issued (MAY-07-2009)
- Follow-up Or Routine LCR Tap M/R - In JAN-01-2011, Contaminant: Lead and Copper Rule. Follow-up actions: St Violation/Reminder Notice (FEB-22-2011), St Compliance achieved (2 times from JAN-09-2012 to JAN-09-2012)
- Monitoring, Repeat Major (TCR) - In SEP-2008, Contaminant: Coliform (TCR). Follow-up actions: St Compliance achieved (DEC-09-2008), St AO (w/o penalty) issued (MAY-07-2009)
- Monitoring, Repeat Major (TCR) - In SEP-2005, Contaminant: Coliform (TCR). Follow-up actions: St Compliance achieved (OCT-10-2005)
- 6 routine major monitoring violations
- One minor monitoring violation
| This city: | 2.6 people |
| Oregon: | 2.5 people |
| This city: | 68.3% |
| Whole state: | 63.4% |
| This city: | 9.2% |
| Whole state: | 8.0% |
Likely homosexual households (counted as self-reported same-sex unmarried-partner households)
- Lesbian couples: 0.4% of all households
- Gay men: 0.2% of all households
People in group quarters in Redmond in 2010:
- 181 people in nursing facilities/skilled-nursing facilities
- 105 people in group homes intended for adults
- 14 people in other noninstitutional facilities
People in group quarters in Redmond in 2000:
- 49 people in nursing homes
- 45 people in other group homes
- 8 people in other noninstitutional group quarters
- 4 people in homes for the physically handicapped
- 3 people in other workers' dormitories
Banks with most branches in Redmond (2011 data):
- Columbia State Bank: South Redmond Branch at 1502 Sw Odem Medo Road, branch established on 2004/05/06; Redmond Branch at 434 North Fifth Street, branch established on 1987/10/05. Info updated 2011/08/09: Bank assets: $4,785.2 mil, Deposits: $3,892.8 mil, headquarters in Tacoma, WA, positive income, Commercial Lending Specialization, 104 total offices, Holding Company: Columbia Banking System, Inc.
- JPMorgan Chase Bank, National Association: Redmond Fm Financial Center Branch at 944 South West 9th Street, Suite 101, branch established on 1999/10/20; Redmond Branch at 568 Sw 5th Street, branch established on 1960/09/10. Info updated 2011/11/10: Bank assets: $1,811,678.0 mil, Deposits: $1,190,738.0 mil, headquarters in Columbus, OH, positive income, International Specialization, 5577 total offices, Holding Company: Jpmorgan Chase & Co.
- Wells Fargo Bank, National Association: Redmon In-Store Branch at 1705 South Highway 97, branch established on 1997/11/08; Redmond Branch at 617 South Sixth Street, branch established on 1978/10/16. Info updated 2011/04/05: Bank assets: $1,161,490.0 mil, Deposits: $905,653.0 mil, headquarters in Sioux Falls, SD, positive income, 6395 total offices, Holding Company: Wells Fargo & Company
- Bank of the Cascades: Redmond Branch at 154 Southwest 6th Street, branch established on 1999/03/08; South Redmond Branch at 2542 South Highway 97, branch established on 1992/06/01. Info updated 2007/01/18: Bank assets: $1,334.8 mil, Deposits: $1,087.3 mil, headquarters in Bend, OR, negative income in the last year, Commercial Lending Specialization, 35 total offices, Holding Company: Cascade Bancorp
- South Valley Bank & Trust: Redmond Branch at 855 Sw Veterans Way, branch established on 2005/05/11. Info updated 2010/07/27: Bank assets: $865.2 mil, Deposits: $771.3 mil, headquarters in Klamath Falls, OR, negative income in the last year, Commercial Lending Specialization, 26 total offices, Holding Company: South Valley Bancorp, Inc.
- PremierWest Bank: Nolan Town Center at 875 Sw Rimrock Way, branch established on 2006/10/16. Info updated 2011/05/20: Bank assets: $1,264.9 mil, Deposits: $1,128.9 mil, headquarters in Medford, OR, negative income in the last year, Commercial Lending Specialization, 46 total offices, Holding Company: Premierwest Bancorp
- Bank of America, National Association: Redmond Branch at 552 South Sixth Street, branch established on 1986/06/30. Info updated 2009/11/18: Bank assets: $1,451,969.3 mil, Deposits: $1,077,176.8 mil, headquarters in Charlotte, NC, positive income, 5782 total offices, Holding Company: Bank Of America Corporation
- Sterling Savings Bank: Redmond Branch at 948 Sw 9th Street, branch established on 2001/04/30. Info updated 2012/03/21: Bank assets: $9,207.8 mil, Deposits: $6,454.1 mil, headquarters in Spokane, WA, positive income, Commercial Lending Specialization, 192 total offices, Holding Company: Sterling Financial Corporation
- Home Federal Bank: Redmond Branch at 821 Sw 6th St., branch established on 2006/07/10. Info updated 2011/06/16: Bank assets: $1,098.5 mil, Deposits: $928.9 mil, headquarters in Nampa, ID, negative income in the last year, Commercial Lending Specialization, 28 total offices, Holding Company: Home Federal Bancorp, Inc.
- 2 other banks with 2 local branches
For population 15 years and over in Redmond:
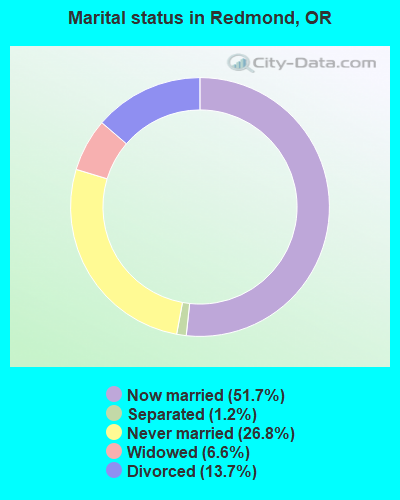
- Never married: 26.8%
- Now married: 51.7%
- Separated: 1.2%
- Widowed: 6.6%
- Divorced: 13.7%
For population 25 years and over in Redmond:
- High school or higher: 89.0%
- Bachelor's degree or higher: 24.8%
- Graduate or professional degree: 6.7%
- Unemployed: 5.3%
- Mean travel time to work (commute): 16.4 minutes
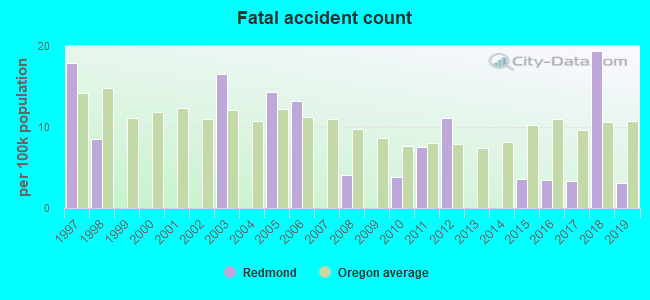
| Here: | 11.0 |
| Oregon average: | 11.6 |
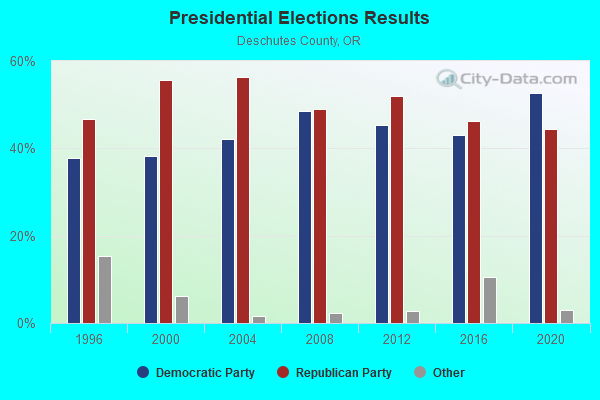
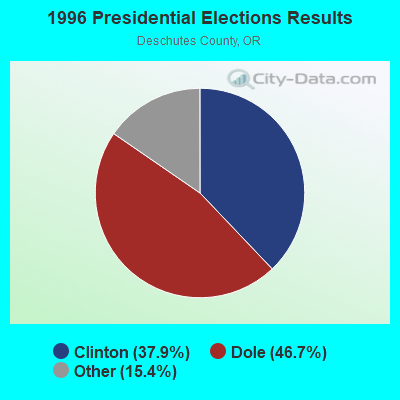

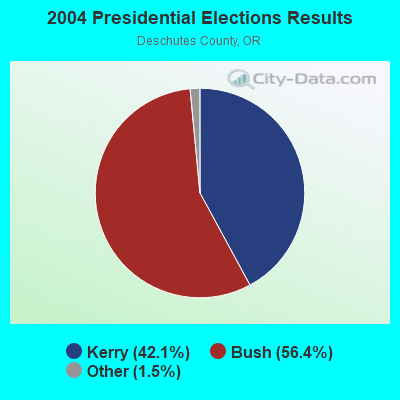
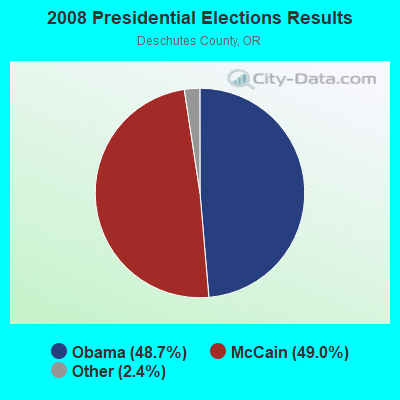
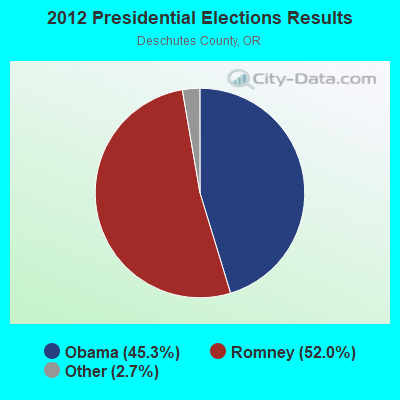
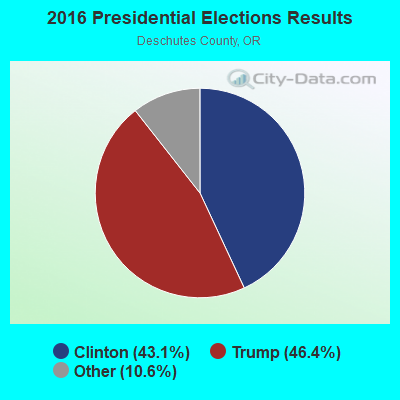
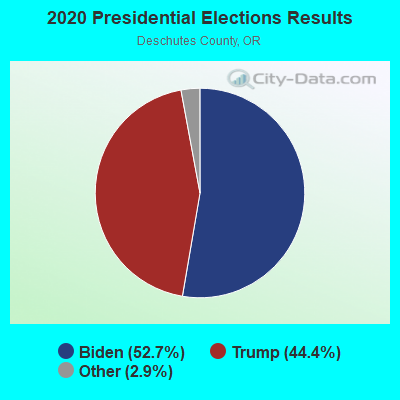
Graphs represent county-level data. Detailed 2008 Election Results
Religion statistics for Redmond, OR (based on Deschutes County data)
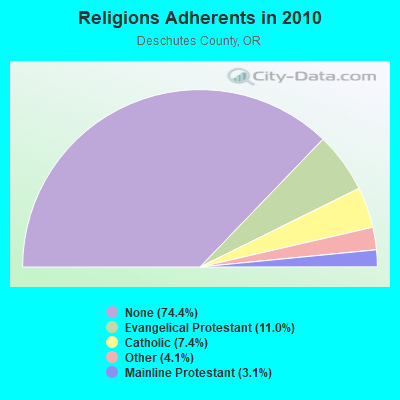
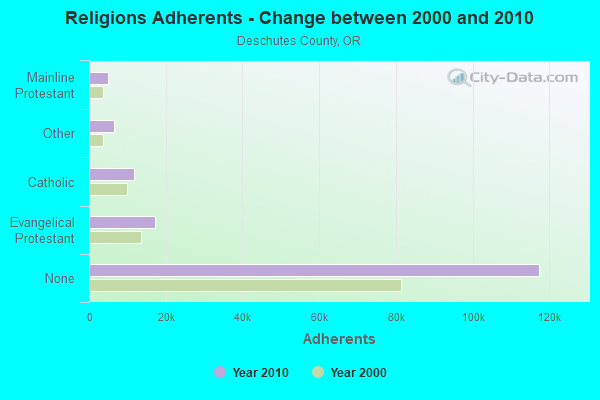
| Religion | Adherents | Congregations |
|---|---|---|
| Evangelical Protestant | 17,329 | 97 |
| Catholic | 11,643 | 5 |
| Other | 6,394 | 29 |
| Mainline Protestant | 4,922 | 14 |
| Orthodox | 26 | 1 |
| None | 117,419 | - |
Food Environment Statistics:
| Here: | 2.21 / 10,000 pop. |
| State: | 2.03 / 10,000 pop. |
| Deschutes County: | 0.33 / 10,000 pop. |
| State: | 0.33 / 10,000 pop. |
| Here: | 0.98 / 10,000 pop. |
| State: | 2.01 / 10,000 pop. |
| This county: | 2.02 / 10,000 pop. |
| Oregon: | 1.69 / 10,000 pop. |
| This county: | 12.48 / 10,000 pop. |
| Oregon: | 9.93 / 10,000 pop. |
| Deschutes County: | 5.8% |
| Oregon: | 7.4% |
| Deschutes County: | 17.3% |
| Oregon: | 25.6% |
| Deschutes County: | 9.6% |
| State: | 14.2% |
Health and Nutrition:
| This city: | 47.5% |
| State: | 49.6% |
| This city: | 43.9% |
| State: | 46.8% |
| Redmond: | 28.7 |
| Oregon: | 28.5 |
| Redmond: | 22.1% |
| Oregon: | 21.2% |
| Redmond: | 10.8% |
| State: | 10.1% |
| This city: | 6.8 |
| Oregon: | 6.8 |
| Redmond: | 33.1% |
| Oregon: | 33.3% |
| Redmond: | 54.7% |
| State: | 56.5% |
| Redmond: | 78.0% |
| Oregon: | 78.7% |
More about Health and Nutrition of Redmond, OR Residents
| Local government employment and payroll (March 2022) | |||||
| Function | Full-time employees | Monthly full-time payroll | Average yearly full-time wage | Part-time employees | Monthly part-time payroll |
|---|---|---|---|---|---|
| Police Protection - Officers | 49 | $392,990 | $96,242 | 3 | $4,172 |
| Airports | 28 | $154,444 | $66,190 | 0 | $0 |
| Streets and Highways | 22 | $132,916 | $72,500 | 0 | $0 |
| Financial Administration | 19 | $127,060 | $80,248 | 0 | $0 |
| Sewerage | 19 | $105,725 | $66,774 | 0 | $0 |
| Housing and Community Development (Local) | 18 | $114,694 | $76,463 | 1 | $1,918 |
| Parks and Recreation | 14 | $70,700 | $60,600 | 0 | $0 |
| Water Supply | 13 | $77,116 | $71,184 | 0 | $0 |
| Other Government Administration | 8 | $30,832 | $46,248 | 1 | $1,948 |
| Other and Unallocable | 5 | $37,254 | $89,410 | 0 | $0 |
| Totals for Government | 195 | $1,243,731 | $76,537 | 5 | $8,038 |
Redmond government finances - Expenditure in 2021 (per resident):
- Construction - Water Utilities: $11,439,000 ($314.18)
Air Transportation: $7,462,000 ($204.95)
Regular Highways: $2,127,000 ($58.42)
General - Other: $1,122,000 ($30.82)
Sewerage: $780,000 ($21.42)
Miscellaneous Commercial Activities - Other: $418,000 ($11.48)
Parks and Recreation: $375,000 ($10.30)
- Current Operations - Police Protection: $9,922,000 ($272.52)
Air Transportation: $7,630,000 ($209.56)
Housing and Community Development: $7,020,000 ($192.81)
Regular Highways: $7,014,000 ($192.64)
Sewerage: $5,823,000 ($159.93)
Water Utilities: $5,347,000 ($146.86)
Parks and Recreation: $4,597,000 ($126.26)
General - Other: $3,518,000 ($96.62)
Financial Administration: $1,900,000 ($52.18)
Central Staff Services: $37,000 ($1.02)
- General - Interest on Debt: $3,534,000 ($97.06)
- Other Capital Outlay - Regular Highways: $542,000 ($14.89)
Sewerage: $288,000 ($7.91)
Air Transportation: $270,000 ($7.42)
Parks and Recreation: $228,000 ($6.26)
Police Protection: $227,000 ($6.23)
Miscellaneous Commercial Activities - Other: $70,000 ($1.92)
Water Utilities: $44,000 ($1.21)
Protective Inspection and Regulation - Other: $26,000 ($0.71)
General - Other: $10,000 ($0.27)
- Total Salaries and Wages: $15,276,000 ($419.57)
Redmond government finances - Revenue in 2021 (per resident):
- Charges - Air Transportation: $10,560,000 ($290.04)
Sewerage: $7,599,000 ($208.71)
Parks and Recreation: $3,220,000 ($88.44)
Other: $2,679,000 ($73.58)
Regular Highways: $2,229,000 ($61.22)
- Federal Intergovernmental - Air Transportation: $7,049,000 ($193.61)
Other: $643,000 ($17.66)
Housing and Community Development: $280,000 ($7.69)
- Local Intergovernmental - General Local Government Support: $1,001,000 ($27.49)
- Miscellaneous - Donations From Private Sources: $9,576,000 ($263.01)
General Revenue - Other: $649,000 ($17.83)
Interest Earnings: $531,000 ($14.58)
Fines and Forfeits: $190,000 ($5.22)
Rents: $134,000 ($3.68)
Special Assessments: $82,000 ($2.25)
Sale of Property: $77,000 ($2.11)
- Revenue - Water Utilities: $7,128,000 ($195.78)
- State Intergovernmental - Highways: $3,254,000 ($89.37)
General Local Government Support: $1,060,000 ($29.11)
Other: $225,000 ($6.18)
- Tax - Property: $14,342,000 ($393.91)
Other License: $12,063,000 ($331.32)
Public Utilities Sales: $3,812,000 ($104.70)
Other Selective Sales: $1,116,000 ($30.65)
Occupation and Business License - Other: $131,000 ($3.60)
Redmond government finances - Debt in 2021 (per resident):
- Long Term Debt - Beginning Outstanding - Unspecified Public Purpose: $88,175,000 ($2421.79)
Outstanding Unspecified Public Purpose: $81,147,000 ($2228.76)
Retired Unspecified Public Purpose: $7,484,000 ($205.55)
Issue, Unspecified Public Purpose: $456,000 ($12.52)
Redmond government finances - Cash and Securities in 2021 (per resident):
- Bond Funds - Cash and Securities: $7,040,000 ($193.36)
- Other Funds - Cash and Securities: $87,162,000 ($2393.97)
- Sinking Funds - Cash and Securities: $1,231,000 ($33.81)
| Businesses in Redmond, OR | ||||
| Name | Count | Name | Count | |
|---|---|---|---|---|
| 7-Eleven | 1 | Lane Furniture | 1 | |
| AT&T | 1 | Little Caesars Pizza | 1 | |
| Albertsons | 1 | Lowe's | 1 | |
| Applebee's | 1 | MasterBrand Cabinets | 1 | |
| Arby's | 1 | McDonald's | 3 | |
| Baskin-Robbins | 1 | Motel 6 | 1 | |
| Best Western | 1 | Panda Express | 1 | |
| Blockbuster | 1 | RadioShack | 1 | |
| Budget Car Rental | 1 | Rite Aid | 1 | |
| Burger King | 1 | SONIC Drive-In | 1 | |
| Carl\s Jr. | 1 | Sleep Inn | 1 | |
| Circle K | 1 | Sprint Nextel | 1 | |
| Cold Stone Creamery | 1 | Starbucks | 3 | |
| Comfort Suites | 1 | Super 8 | 1 | |
| Dairy Queen | 1 | T-Mobile | 2 | |
| FedEx | 5 | Taco Bell | 1 | |
| Ford | 1 | True Value | 2 | |
| Goodwill | 2 | U-Haul | 2 | |
| H&R Block | 1 | U.S. Cellular | 2 | |
| Home Depot | 1 | UPS | 8 | |
| Jones New York | 1 | Verizon Wireless | 2 | |
| KFC | 1 | Vons | 1 | |
| Kroger | 2 | Walmart | 1 | |
Strongest AM radio stations in Redmond:
- KBND (1110 AM; 12 kW; BEND, OR; Owner: COMBINED COMMUNICATIONS, INC.)
- KICE (940 AM; 10 kW; BEND, OR; Owner: GCC BEND, LLC)
- KPOJ (620 AM; 50 kW; PORTLAND, OR; Owner: CITICASTERS LICENSES, L.P.)
- KRCO (690 AM; 1 kW; PRINEVILLE, OR; Owner: HORIZON BROADCASTING GROUP LLC)
- KXL (750 AM; 50 kW; PORTLAND, OR; Owner: ROSE CITY RADIO CORPORATION)
- KPNW (1120 AM; 50 kW; EUGENE, OR; Owner: CAPSTAR TX LIMITED PARTNERSHIP)
- KPAM (860 AM; 50 kW; TROUTDALE, OR; Owner: PAMPLIN BROADCASTING-OREGON, INC.)
- KEX (1190 AM; 50 kW; PORTLAND, OR; Owner: CITICASTERS LICENSES, L.P.)
- KOTK (1080 AM; 50 kW; PORTLAND, OR; Owner: FISHER BROADCASTING - PORTLAND RADIO, L.L.C.)
- KKSN (1520 AM; 50 kW; OREGON CITY, OR; Owner: ENTERCOM PORTLAND LICENSE, LLC)
- KKAD (1550 AM; 50 kW; VANCOUVER, WA; Owner: PAMPLIN BROADCASTING-WASHINGTON, INC)
- KDUN (1030 AM; 50 kW; REEDSPORT, OR; Owner: PAMPLIN BROADCASTING-OREGON, INC.)
- KGRV (700 AM; 25 kW; WINSTON, OR; Owner: PACIFIC CASCADE COMMUNICATIONS CORP.)
Strongest FM radio stations in Redmond:
- KSJJ (102.9 FM; REDMOND, OR; Owner: GCC BEND, LLC)
- KWRX (88.5 FM; REDMOND, OR; Owner: ST BD OF HIGHER ED FOR THE UN OF OR)
- K266AI (101.1 FM; BEND, OR; Owner: CALVARY CHAPEL OF TWIN FALLS, INC.)
- K205BJ (88.9 FM; BEND, OR; Owner: STATE OF OREGON(ACTING BY & THROUGH THE ST BD OF HIGHER EDU))
- KWPK-FM (104.1 FM; SISTERS, OR; Owner: THUNDEREGG WIRELESS, L.L.C.)
- KTWS (98.3 FM; BEND, OR; Owner: COMBINED COMMUNICATIONS, INC)
- KLRR (107.5 FM; REDMOND, OR; Owner: COMBINED COMMUNICATIONS, INC.)
- KQAK (105.7 FM; BEND, OR; Owner: HORIZON BROADCASTING GROUP, LLC)
- KOAB-FM (91.3 FM; BEND, OR; Owner: OREGON PUBLIC BROADCASTING)
- KMJZ-FM (95.1 FM; PRINEVILLE, OR; Owner: HORIZON BROADCASTING GROUP LLC)
- KVLB (90.5 FM; BEND, OR; Owner: EDUCATIONAL MEDIA FOUNDATION)
- KXIX (94.1 FM; BEND, OR; Owner: GCC BEND, LLC)
- K208CV (89.5 FM; TUMALO, OR; Owner: EDUCATIONAL MEDIA FOUNDATION)
- KNLR (97.5 FM; BEND, OR; Owner: TERRY A. COWAN)
- KMGX (100.7 FM; BEND, OR; Owner: GCC BEND, LLC)
- KMTK (99.7 FM; BEND, OR; Owner: COMBINED COMMUNICATIONS, INC.)
- KWLZ-FM (96.5 FM; WARM SPRINGS, OR; Owner: HORIZON BROADCASTING GROUP LLC)
- KWSO (91.9 FM; WARM SPRINGS, OR; Owner: CONFEDERATED TRIBES WARM SPRINGS REV)
TV broadcast stations around Redmond:
- KOAB-TV (Channel 3; BEND, OR; Owner: OREGON PUBLIC BROADCASTING)
- K05HO (Channel 5; RILEY, OR; Owner: NPG OF OREGON, INC.)
- K27DO (Channel 27; BEND, ETC., OR; Owner: MEREDITH CORPORATION)
- KTVZ (Channel 21; BEND, OR; Owner: NPG OF OREGON, INC.)
- K65AE (Channel 65; TERREBONNE, OR; Owner: EMMIS TELEVISION LICENSE CORPORATION)
- K29CI (Channel 29; PRINEVILLE, ETC., OR; Owner: FISHER BROADCASTING - PORTLAND TV, L.L.C.)
- K31CR (Channel 31; PRINEVILLE, ETC., OR; Owner: EMMIS TELEVISION LICENSE CORPORATION)
- KUBN-LP (Channel 50; BEND, OR; Owner: MEREDITH CORPORATION)
- K60BQ (Channel 60; TERREBONNE, OR; Owner: KING BROADCASTING COMPANY)
- K08KN (Channel 8; PRINEVILLE, ETC., OR; Owner: KING BROADCASTING COMPANY)
- KFXO-LP (Channel 39; BEND, OR; Owner: MEREDITH CORPORATION)
- National Bridge Inventory (NBI) Statistics
- 22Number of bridges
- 187ft / 56.7mTotal length
- $246,000Total costs
- 155,197Total average daily traffic
- 19,072Total average daily truck traffic
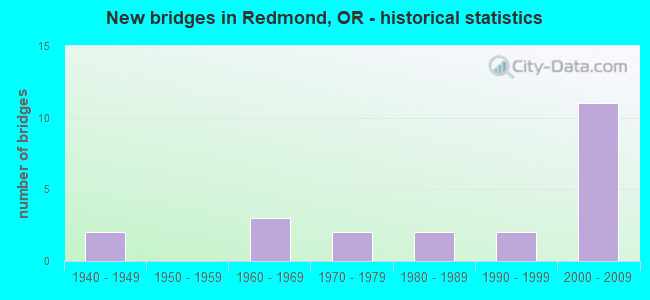
- New bridges - historical statistics
- 21940-1949
- 31960-1969
- 21970-1979
- 21980-1989
- 21990-1999
- 112000-2009
FCC Registered Antenna Towers: 147 (See the full list of FCC Registered Antenna Towers)
FCC Registered Broadcast Land Mobile Towers: 35 (See the full list of FCC Registered Broadcast Land Mobile Towers in Redmond, OR)
FCC Registered Microwave Towers: 71 (See the full list of FCC Registered Microwave Towers in this town)
FCC Registered Paging Towers: 4 (See the full list of FCC Registered Paging Towers)
FCC Registered Maritime Coast & Aviation Ground Towers: 13 (See the full list of FCC Registered Maritime Coast & Aviation Ground Towers)
FCC Registered Amateur Radio Licenses: 268 (See the full list of FCC Registered Amateur Radio Licenses in Redmond)
FAA Registered Aircraft: 100 (See the full list of FAA Registered Aircraft in Redmond)
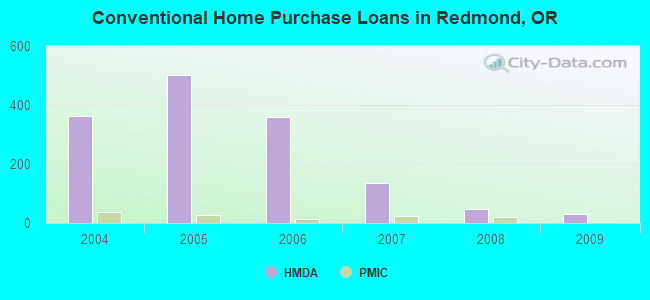
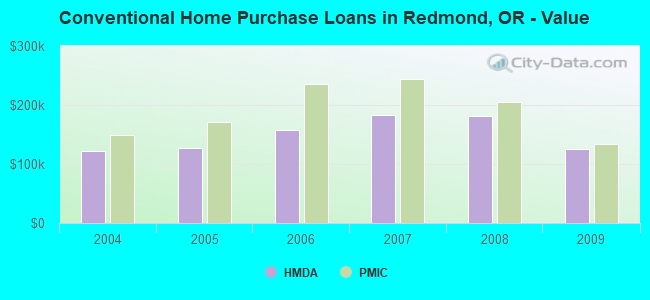
| Home Mortgage Disclosure Act Aggregated Statistics For Year 2009 (Based on 1 full and 1 partial tracts) | ||||||||||||
| A) FHA, FSA/RHS & VA Home Purchase Loans | B) Conventional Home Purchase Loans | C) Refinancings | D) Home Improvement Loans | F) Non-occupant Loans on < 5 Family Dwellings (A B C & D) | G) Loans On Manufactured Home Dwelling (A B C & D) | |||||||
|---|---|---|---|---|---|---|---|---|---|---|---|---|
| Number | Average Value | Number | Average Value | Number | Average Value | Number | Average Value | Number | Average Value | Number | Average Value | |
| LOANS ORIGINATED | 71 | $141,898 | 32 | $125,284 | 92 | $160,425 | 2 | $62,735 | 21 | $151,098 | 3 | $94,123 |
| APPLICATIONS APPROVED, NOT ACCEPTED | 11 | $137,161 | 4 | $188,888 | 23 | $200,890 | 1 | $9,330 | 4 | $193,695 | 1 | $41,180 |
| APPLICATIONS DENIED | 12 | $152,157 | 8 | $137,805 | 63 | $182,025 | 3 | $154,020 | 13 | $145,847 | 5 | $101,032 |
| APPLICATIONS WITHDRAWN | 9 | $128,319 | 8 | $97,979 | 47 | $171,997 | 1 | $10,980 | 8 | $122,996 | 2 | $98,010 |
| FILES CLOSED FOR INCOMPLETENESS | 1 | $151,820 | 1 | $49,420 | 6 | $127,458 | 0 | $0 | 0 | $0 | 1 | $110,500 |
Detailed HMDA statistics for the following Tracts: 9909.00 , 9910.00
| Private Mortgage Insurance Companies Aggregated Statistics For Year 2009 (Based on 1 full and 1 partial tracts) | ||||||
| A) Conventional Home Purchase Loans | B) Refinancings | C) Non-occupant Loans on < 5 Family Dwellings (A & B) | ||||
|---|---|---|---|---|---|---|
| Number | Average Value | Number | Average Value | Number | Average Value | |
| LOANS ORIGINATED | 1 | $134,530 | 3 | $155,943 | 1 | $64,240 |
| APPLICATIONS APPROVED, NOT ACCEPTED | 2 | $275,925 | 2 | $211,540 | 1 | $173,520 |
| APPLICATIONS DENIED | 0 | $0 | 2 | $115,035 | 0 | $0 |
| APPLICATIONS WITHDRAWN | 0 | $0 | 1 | $54,360 | 0 | $0 |
| FILES CLOSED FOR INCOMPLETENESS | 0 | $0 | 1 | $116,410 | 0 | $0 |
Detailed PMIC statistics for the following Tracts: 9909.00 , 9910.00
2002 - 2018 National Fire Incident Reporting System (NFIRS) incidents
- Fire incident types reported to NFIRS in Redmond, OR
- 1,21662.7%Outside Fires
- 44022.7%Structure Fires
- 24612.7%Mobile Property/Vehicle Fires
- 371.9%Other
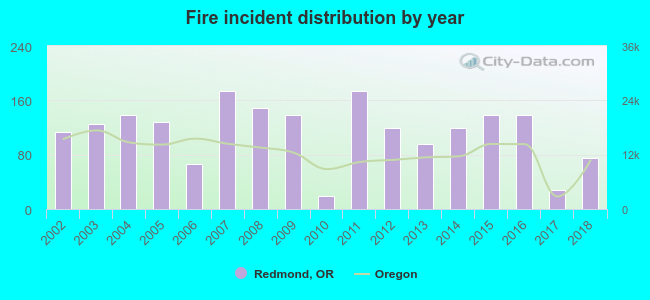 Based on the data from the years 2002 - 2018 the average number of fires per year is 114. The highest number of fire incidents - 174 took place in 2007, and the least - 19 in 2010. The data has a decreasing trend.
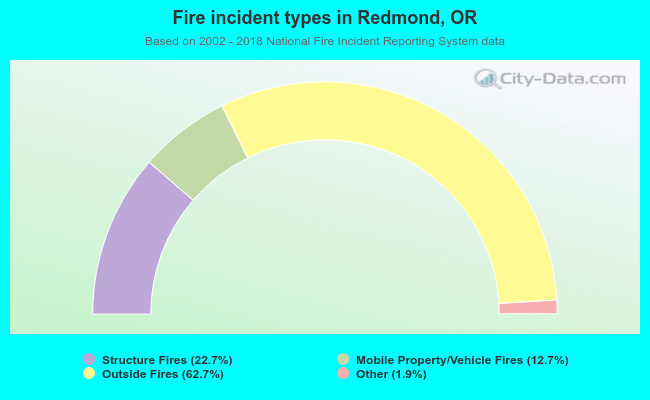 When looking into fire subcategories, the most incidents belonged to: Outside Fires (62.7%), and Structure Fires (22.7%).
Fire-safe hotels and motels in Redmond, Oregon:
- Best Western Rama Inn, 2630 SW 17th Pl, Redmond, Oregon 97756 , Phone: (541) 548-8080, Fax: (541) 548-3705
- Travelodge New Redmond Hotel, 521 South Sixth St, Redmond, Oregon 97756 , Phone: (541) 923-7378, Fax: (541) 923-3949
- The Lodge At Eagle Crest A Holiday Inn Resort, 1522 Cline Falls Rd, Redmond, Oregon 97756 , Phone: (541) 923-2453, Fax: (541) 923-1720
- Redmond Super 8, 3629 21st Pl South W, Redmond, Oregon 97756 , Phone: (541) 548-8881, Fax: (541) 504-8318
- Comfort Suites, 2243 SW Yew Ave, Redmond, Oregon 97756 , Phone: (541) 504-8900, Fax: (541) 504-1316
- Sleep Inn & Suites, 1847 N Hwy 97, Redmond, Oregon 97756 , Phone: (541) 504-1500, Fax: (541) 504-1511
| Most common first names in Redmond, OR among deceased individuals | ||
| Name | Count | Lived (average) |
|---|---|---|
| Robert | 103 | 73.1 years |
| John | 96 | 78.2 years |
| William | 94 | 76.0 years |
| James | 74 | 74.2 years |
| Mary | 66 | 80.1 years |
| Charles | 62 | 77.3 years |
| George | 48 | 78.3 years |
| Helen | 45 | 80.8 years |
| Donald | 41 | 72.0 years |
| Dorothy | 41 | 78.8 years |
| Most common last names in Redmond, OR among deceased individuals | ||
| Last name | Count | Lived (average) |
|---|---|---|
| Johnson | 55 | 74.3 years |
| Smith | 49 | 80.0 years |
| Brown | 34 | 80.2 years |
| Jones | 27 | 75.6 years |
| Miller | 27 | 78.1 years |
| Williams | 25 | 75.3 years |
| Taylor | 22 | 75.0 years |
| Anderson | 20 | 73.3 years |
| Davis | 18 | 75.1 years |
| Clark | 17 | 71.7 years |
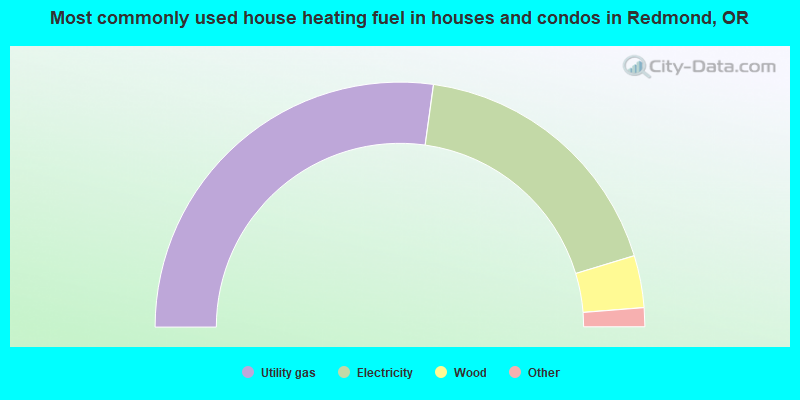
- 54.4%Utility gas
- 36.2%Electricity
- 6.9%Wood
- 1.3%Bottled, tank, or LP gas
- 0.6%Fuel oil, kerosene, etc.
- 0.5%Other fuel
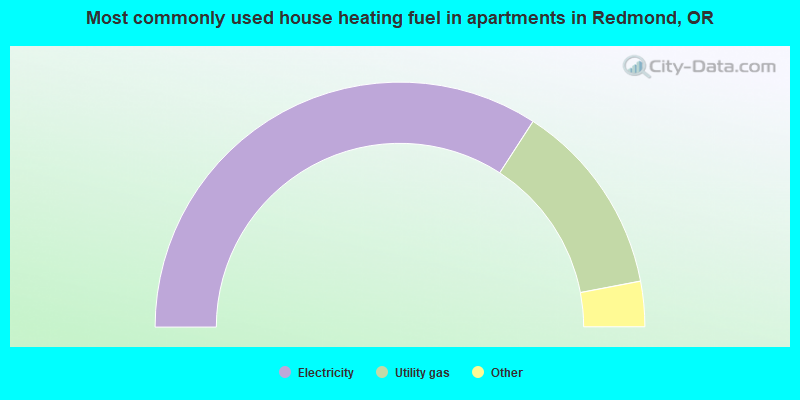
- 68.3%Electricity
- 25.7%Utility gas
- 3.6%Wood
- 2.1%Bottled, tank, or LP gas
- 0.3%No fuel used
Redmond compared to Oregon state average:
- Unemployed percentage below state average.
- Black race population percentage significantly below state average.
- Hispanic race population percentage above state average.
- Foreign-born population percentage above state average.
- House age significantly below state average.
Redmond on our top lists:
- #55 on the list of "Top 101 cities with largest percentage of females in occupations: arts, design, entertainment, sports, and media occupations (population 5,000+)"
- #69 on the list of "Top 101 cities with the largest city-data.com crime index per police officer (population 5,000+)"
- #100 on the list of "Top 101 cities with the largest percentage population increase from 2000 (population 5,000+)"
- #76 on the list of "Top 101 counties with the largest number of people moving in compared to moving out (pop. 50,000+)"
- #85 on the list of "Top 101 counties with the largest number of people without health insurance coverage in 2000 (pop. 50,000+)"

|
|
Total of 62 patent applications in 2008-2024.