South Portland, Maine Submit your own pictures of this city and show them to the world
OSM Map
General Map
Google Map
MSN Map
OSM Map
General Map
Google Map
MSN Map
OSM Map
General Map
Google Map
MSN Map
OSM Map
General Map
Google Map
MSN Map
Please wait while loading the map...
Population in 2022: 27,026 (100% urban, 0% rural). Population change since 2000: +15.9%Males: 13,002 Females: 14,024
March 2022 cost of living index in South Portland: 103.7 (near average, U.S. average is 100) Percentage of residents living in poverty in 2022: 5.2%for White Non-Hispanic residents , 1.0% for Black residents , 9.3% for Hispanic or Latino residents , 22.3% for other race residents , 9.2% for two or more races residents )
Profiles of local businesses
Business Search - 14 Million verified businesses
Data:
Median household income ($)
Median household income (% change since 2000)
Household income diversity
Ratio of average income to average house value (%)
Ratio of average income to average rent
Median household income ($) - White
Median household income ($) - Black or African American
Median household income ($) - Asian
Median household income ($) - Hispanic or Latino
Median household income ($) - American Indian and Alaska Native
Median household income ($) - Multirace
Median household income ($) - Other Race
Median household income for houses/condos with a mortgage ($)
Median household income for apartments without a mortgage ($)
Races - White alone (%)
Races - White alone (% change since 2000)
Races - Black alone (%)
Races - Black alone (% change since 2000)
Races - American Indian alone (%)
Races - American Indian alone (% change since 2000)
Races - Asian alone (%)
Races - Asian alone (% change since 2000)
Races - Hispanic (%)
Races - Hispanic (% change since 2000)
Races - Native Hawaiian and Other Pacific Islander alone (%)
Races - Native Hawaiian and Other Pacific Islander alone (% change since 2000)
Races - Two or more races (%)
Races - Two or more races (% change since 2000)
Races - Other race alone (%)
Races - Other race alone (% change since 2000)
Racial diversity
Unemployment (%)
Unemployment (% change since 2000)
Unemployment (%) - White
Unemployment (%) - Black or African American
Unemployment (%) - Asian
Unemployment (%) - Hispanic or Latino
Unemployment (%) - American Indian and Alaska Native
Unemployment (%) - Multirace
Unemployment (%) - Other Race
Population density (people per square mile)
Population - Males (%)
Population - Females (%)
Population - Males (%) - White
Population - Males (%) - Black or African American
Population - Males (%) - Asian
Population - Males (%) - Hispanic or Latino
Population - Males (%) - American Indian and Alaska Native
Population - Males (%) - Multirace
Population - Males (%) - Other Race
Population - Females (%) - White
Population - Females (%) - Black or African American
Population - Females (%) - Asian
Population - Females (%) - Hispanic or Latino
Population - Females (%) - American Indian and Alaska Native
Population - Females (%) - Multirace
Population - Females (%) - Other Race
Coronavirus confirmed cases (Apr 27, 2024)
Deaths caused by coronavirus (Apr 27, 2024)
Coronavirus confirmed cases (per 100k population) (Apr 27, 2024)
Deaths caused by coronavirus (per 100k population) (Apr 27, 2024)
Daily increase in number of cases (Apr 27, 2024)
Weekly increase in number of cases (Apr 27, 2024)
Cases doubled (in days) (Apr 27, 2024)
Hospitalized patients (Apr 18, 2022)
Negative test results (Apr 18, 2022)
Total test results (Apr 18, 2022)
COVID Vaccine doses distributed (per 100k population) (Sep 19, 2023)
COVID Vaccine doses administered (per 100k population) (Sep 19, 2023)
COVID Vaccine doses distributed (Sep 19, 2023)
COVID Vaccine doses administered (Sep 19, 2023)
Likely homosexual households (%)
Likely homosexual households (% change since 2000)
Likely homosexual households - Lesbian couples (%)
Likely homosexual households - Lesbian couples (% change since 2000)
Likely homosexual households - Gay men (%)
Likely homosexual households - Gay men (% change since 2000)
Cost of living index
Median gross rent ($)
Median contract rent ($)
Median monthly housing costs ($)
Median house or condo value ($)
Median house or condo value ($ change since 2000)
Mean house or condo value by units in structure - 1, detached ($)
Mean house or condo value by units in structure - 1, attached ($)
Mean house or condo value by units in structure - 2 ($)
Mean house or condo value by units in structure by units in structure - 3 or 4 ($)
Mean house or condo value by units in structure - 5 or more ($)
Mean house or condo value by units in structure - Boat, RV, van, etc. ($)
Mean house or condo value by units in structure - Mobile home ($)
Median house or condo value ($) - White
Median house or condo value ($) - Black or African American
Median house or condo value ($) - Asian
Median house or condo value ($) - Hispanic or Latino
Median house or condo value ($) - American Indian and Alaska Native
Median house or condo value ($) - Multirace
Median house or condo value ($) - Other Race
Median resident age
Resident age diversity
Median resident age - Males
Median resident age - Females
Median resident age - White
Median resident age - Black or African American
Median resident age - Asian
Median resident age - Hispanic or Latino
Median resident age - American Indian and Alaska Native
Median resident age - Multirace
Median resident age - Other Race
Median resident age - Males - White
Median resident age - Males - Black or African American
Median resident age - Males - Asian
Median resident age - Males - Hispanic or Latino
Median resident age - Males - American Indian and Alaska Native
Median resident age - Males - Multirace
Median resident age - Males - Other Race
Median resident age - Females - White
Median resident age - Females - Black or African American
Median resident age - Females - Asian
Median resident age - Females - Hispanic or Latino
Median resident age - Females - American Indian and Alaska Native
Median resident age - Females - Multirace
Median resident age - Females - Other Race
Commute - mean travel time to work (minutes)
Travel time to work - Less than 5 minutes (%)
Travel time to work - Less than 5 minutes (% change since 2000)
Travel time to work - 5 to 9 minutes (%)
Travel time to work - 5 to 9 minutes (% change since 2000)
Travel time to work - 10 to 19 minutes (%)
Travel time to work - 10 to 19 minutes (% change since 2000)
Travel time to work - 20 to 29 minutes (%)
Travel time to work - 20 to 29 minutes (% change since 2000)
Travel time to work - 30 to 39 minutes (%)
Travel time to work - 30 to 39 minutes (% change since 2000)
Travel time to work - 40 to 59 minutes (%)
Travel time to work - 40 to 59 minutes (% change since 2000)
Travel time to work - 60 to 89 minutes (%)
Travel time to work - 60 to 89 minutes (% change since 2000)
Travel time to work - 90 or more minutes (%)
Travel time to work - 90 or more minutes (% change since 2000)
Marital status - Never married (%)
Marital status - Now married (%)
Marital status - Separated (%)
Marital status - Widowed (%)
Marital status - Divorced (%)
Median family income ($)
Median family income (% change since 2000)
Median non-family income ($)
Median non-family income (% change since 2000)
Median per capita income ($)
Median per capita income (% change since 2000)
Median family income ($) - White
Median family income ($) - Black or African American
Median family income ($) - Asian
Median family income ($) - Hispanic or Latino
Median family income ($) - American Indian and Alaska Native
Median family income ($) - Multirace
Median family income ($) - Other Race
Median year house/condo built
Median year apartment built
Year house built - Built 2005 or later (%)
Year house built - Built 2000 to 2004 (%)
Year house built - Built 1990 to 1999 (%)
Year house built - Built 1980 to 1989 (%)
Year house built - Built 1970 to 1979 (%)
Year house built - Built 1960 to 1969 (%)
Year house built - Built 1950 to 1959 (%)
Year house built - Built 1940 to 1949 (%)
Year house built - Built 1939 or earlier (%)
Average household size
Household density (households per square mile)
Average household size - White
Average household size - Black or African American
Average household size - Asian
Average household size - Hispanic or Latino
Average household size - American Indian and Alaska Native
Average household size - Multirace
Average household size - Other Race
Occupied housing units (%)
Vacant housing units (%)
Owner occupied housing units (%)
Renter occupied housing units (%)
Vacancy status - For rent (%)
Vacancy status - For sale only (%)
Vacancy status - Rented or sold, not occupied (%)
Vacancy status - For seasonal, recreational, or occasional use (%)
Vacancy status - For migrant workers (%)
Vacancy status - Other vacant (%)
Residents with income below the poverty level (%)
Residents with income below 50% of the poverty level (%)
Children below poverty level (%)
Poor families by family type - Married-couple family (%)
Poor families by family type - Male, no wife present (%)
Poor families by family type - Female, no husband present (%)
Poverty status for native-born residents (%)
Poverty status for foreign-born residents (%)
Poverty among high school graduates not in families (%)
Poverty among people who did not graduate high school not in families (%)
Residents with income below the poverty level (%) - White
Residents with income below the poverty level (%) - Black or African American
Residents with income below the poverty level (%) - Asian
Residents with income below the poverty level (%) - Hispanic or Latino
Residents with income below the poverty level (%) - American Indian and Alaska Native
Residents with income below the poverty level (%) - Multirace
Residents with income below the poverty level (%) - Other Race
Air pollution - Air Quality Index (AQI)
Air pollution - CO
Air pollution - NO2
Air pollution - SO2
Air pollution - Ozone
Air pollution - PM10
Air pollution - PM25
Air pollution - Pb
Crime - Murders per 100,000 population
Crime - Rapes per 100,000 population
Crime - Robberies per 100,000 population
Crime - Assaults per 100,000 population
Crime - Burglaries per 100,000 population
Crime - Thefts per 100,000 population
Crime - Auto thefts per 100,000 population
Crime - Arson per 100,000 population
Crime - City-data.com crime index
Crime - Violent crime index
Crime - Property crime index
Crime - Murders per 100,000 population (5 year average)
Crime - Rapes per 100,000 population (5 year average)
Crime - Robberies per 100,000 population (5 year average)
Crime - Assaults per 100,000 population (5 year average)
Crime - Burglaries per 100,000 population (5 year average)
Crime - Thefts per 100,000 population (5 year average)
Crime - Auto thefts per 100,000 population (5 year average)
Crime - Arson per 100,000 population (5 year average)
Crime - City-data.com crime index (5 year average)
Crime - Violent crime index (5 year average)
Crime - Property crime index (5 year average)
1996 Presidential Elections Results (%) - Democratic Party (Clinton)
1996 Presidential Elections Results (%) - Republican Party (Dole)
1996 Presidential Elections Results (%) - Other
2000 Presidential Elections Results (%) - Democratic Party (Gore)
2000 Presidential Elections Results (%) - Republican Party (Bush)
2000 Presidential Elections Results (%) - Other
2004 Presidential Elections Results (%) - Democratic Party (Kerry)
2004 Presidential Elections Results (%) - Republican Party (Bush)
2004 Presidential Elections Results (%) - Other
2008 Presidential Elections Results (%) - Democratic Party (Obama)
2008 Presidential Elections Results (%) - Republican Party (McCain)
2008 Presidential Elections Results (%) - Other
2012 Presidential Elections Results (%) - Democratic Party (Obama)
2012 Presidential Elections Results (%) - Republican Party (Romney)
2012 Presidential Elections Results (%) - Other
2016 Presidential Elections Results (%) - Democratic Party (Clinton)
2016 Presidential Elections Results (%) - Republican Party (Trump)
2016 Presidential Elections Results (%) - Other
2020 Presidential Elections Results (%) - Democratic Party (Biden)
2020 Presidential Elections Results (%) - Republican Party (Trump)
2020 Presidential Elections Results (%) - Other
Ancestries Reported - Arab (%)
Ancestries Reported - Czech (%)
Ancestries Reported - Danish (%)
Ancestries Reported - Dutch (%)
Ancestries Reported - English (%)
Ancestries Reported - French (%)
Ancestries Reported - French Canadian (%)
Ancestries Reported - German (%)
Ancestries Reported - Greek (%)
Ancestries Reported - Hungarian (%)
Ancestries Reported - Irish (%)
Ancestries Reported - Italian (%)
Ancestries Reported - Lithuanian (%)
Ancestries Reported - Norwegian (%)
Ancestries Reported - Polish (%)
Ancestries Reported - Portuguese (%)
Ancestries Reported - Russian (%)
Ancestries Reported - Scotch-Irish (%)
Ancestries Reported - Scottish (%)
Ancestries Reported - Slovak (%)
Ancestries Reported - Subsaharan African (%)
Ancestries Reported - Swedish (%)
Ancestries Reported - Swiss (%)
Ancestries Reported - Ukrainian (%)
Ancestries Reported - United States (%)
Ancestries Reported - Welsh (%)
Ancestries Reported - West Indian (%)
Ancestries Reported - Other (%)
Educational Attainment - No schooling completed (%)
Educational Attainment - Less than high school (%)
Educational Attainment - High school or equivalent (%)
Educational Attainment - Less than 1 year of college (%)
Educational Attainment - 1 or more years of college (%)
Educational Attainment - Associate degree (%)
Educational Attainment - Bachelor's degree (%)
Educational Attainment - Master's degree (%)
Educational Attainment - Professional school degree (%)
Educational Attainment - Doctorate degree (%)
School Enrollment - Nursery, preschool (%)
School Enrollment - Kindergarten (%)
School Enrollment - Grade 1 to 4 (%)
School Enrollment - Grade 5 to 8 (%)
School Enrollment - Grade 9 to 12 (%)
School Enrollment - College undergrad (%)
School Enrollment - Graduate or professional (%)
School Enrollment - Not enrolled in school (%)
School enrollment - Public schools (%)
School enrollment - Private schools (%)
School enrollment - Not enrolled (%)
Median number of rooms in houses and condos
Median number of rooms in apartments
Housing units lacking complete plumbing facilities (%)
Housing units lacking complete kitchen facilities (%)
Density of houses
Urban houses (%)
Rural houses (%)
Households with people 60 years and over (%)
Households with people 65 years and over (%)
Households with people 75 years and over (%)
Households with one or more nonrelatives (%)
Households with no nonrelatives (%)
Population in households (%)
Family households (%)
Nonfamily households (%)
Population in families (%)
Family households with own children (%)
Median number of bedrooms in owner occupied houses
Mean number of bedrooms in owner occupied houses
Median number of bedrooms in renter occupied houses
Mean number of bedrooms in renter occupied houses
Median number of vehichles in owner occupied houses
Mean number of vehichles in owner occupied houses
Median number of vehichles in renter occupied houses
Mean number of vehichles in renter occupied houses
Mortgage status - with mortgage (%)
Mortgage status - with second mortgage (%)
Mortgage status - with home equity loan (%)
Mortgage status - with both second mortgage and home equity loan (%)
Mortgage status - without a mortgage (%)
Average family size
Average family size - White
Average family size - Black or African American
Average family size - Asian
Average family size - Hispanic or Latino
Average family size - American Indian and Alaska Native
Average family size - Multirace
Average family size - Other Race
Geographical mobility - Same house 1 year ago (%)
Geographical mobility - Moved within same county (%)
Geographical mobility - Moved from different county within same state (%)
Geographical mobility - Moved from different state (%)
Geographical mobility - Moved from abroad (%)
Place of birth - Born in state of residence (%)
Place of birth - Born in other state (%)
Place of birth - Native, outside of US (%)
Place of birth - Foreign born (%)
Housing units in structures - 1, detached (%)
Housing units in structures - 1, attached (%)
Housing units in structures - 2 (%)
Housing units in structures - 3 or 4 (%)
Housing units in structures - 5 to 9 (%)
Housing units in structures - 10 to 19 (%)
Housing units in structures - 20 to 49 (%)
Housing units in structures - 50 or more (%)
Housing units in structures - Mobile home (%)
Housing units in structures - Boat, RV, van, etc. (%)
House/condo owner moved in on average (years ago)
Renter moved in on average (years ago)
Year householder moved into unit - Moved in 1999 to March 2000 (%)
Year householder moved into unit - Moved in 1995 to 1998 (%)
Year householder moved into unit - Moved in 1990 to 1994 (%)
Year householder moved into unit - Moved in 1980 to 1989 (%)
Year householder moved into unit - Moved in 1970 to 1979 (%)
Year householder moved into unit - Moved in 1969 or earlier (%)
Means of transportation to work - Drove car alone (%)
Means of transportation to work - Carpooled (%)
Means of transportation to work - Public transportation (%)
Means of transportation to work - Bus or trolley bus (%)
Means of transportation to work - Streetcar or trolley car (%)
Means of transportation to work - Subway or elevated (%)
Means of transportation to work - Railroad (%)
Means of transportation to work - Ferryboat (%)
Means of transportation to work - Taxicab (%)
Means of transportation to work - Motorcycle (%)
Means of transportation to work - Bicycle (%)
Means of transportation to work - Walked (%)
Means of transportation to work - Other means (%)
Working at home (%)
Industry diversity
Most Common Industries - Agriculture, forestry, fishing and hunting, and mining (%)
Most Common Industries - Agriculture, forestry, fishing and hunting (%)
Most Common Industries - Mining, quarrying, and oil and gas extraction (%)
Most Common Industries - Construction (%)
Most Common Industries - Manufacturing (%)
Most Common Industries - Wholesale trade (%)
Most Common Industries - Retail trade (%)
Most Common Industries - Transportation and warehousing, and utilities (%)
Most Common Industries - Transportation and warehousing (%)
Most Common Industries - Utilities (%)
Most Common Industries - Information (%)
Most Common Industries - Finance and insurance, and real estate and rental and leasing (%)
Most Common Industries - Finance and insurance (%)
Most Common Industries - Real estate and rental and leasing (%)
Most Common Industries - Professional, scientific, and management, and administrative and waste management services (%)
Most Common Industries - Professional, scientific, and technical services (%)
Most Common Industries - Management of companies and enterprises (%)
Most Common Industries - Administrative and support and waste management services (%)
Most Common Industries - Educational services, and health care and social assistance (%)
Most Common Industries - Educational services (%)
Most Common Industries - Health care and social assistance (%)
Most Common Industries - Arts, entertainment, and recreation, and accommodation and food services (%)
Most Common Industries - Arts, entertainment, and recreation (%)
Most Common Industries - Accommodation and food services (%)
Most Common Industries - Other services, except public administration (%)
Most Common Industries - Public administration (%)
Occupation diversity
Most Common Occupations - Management, business, science, and arts occupations (%)
Most Common Occupations - Management, business, and financial occupations (%)
Most Common Occupations - Management occupations (%)
Most Common Occupations - Business and financial operations occupations (%)
Most Common Occupations - Computer, engineering, and science occupations (%)
Most Common Occupations - Computer and mathematical occupations (%)
Most Common Occupations - Architecture and engineering occupations (%)
Most Common Occupations - Life, physical, and social science occupations (%)
Most Common Occupations - Education, legal, community service, arts, and media occupations (%)
Most Common Occupations - Community and social service occupations (%)
Most Common Occupations - Legal occupations (%)
Most Common Occupations - Education, training, and library occupations (%)
Most Common Occupations - Arts, design, entertainment, sports, and media occupations (%)
Most Common Occupations - Healthcare practitioners and technical occupations (%)
Most Common Occupations - Health diagnosing and treating practitioners and other technical occupations (%)
Most Common Occupations - Health technologists and technicians (%)
Most Common Occupations - Service occupations (%)
Most Common Occupations - Healthcare support occupations (%)
Most Common Occupations - Protective service occupations (%)
Most Common Occupations - Fire fighting and prevention, and other protective service workers including supervisors (%)
Most Common Occupations - Law enforcement workers including supervisors (%)
Most Common Occupations - Food preparation and serving related occupations (%)
Most Common Occupations - Building and grounds cleaning and maintenance occupations (%)
Most Common Occupations - Personal care and service occupations (%)
Most Common Occupations - Sales and office occupations (%)
Most Common Occupations - Sales and related occupations (%)
Most Common Occupations - Office and administrative support occupations (%)
Most Common Occupations - Natural resources, construction, and maintenance occupations (%)
Most Common Occupations - Farming, fishing, and forestry occupations (%)
Most Common Occupations - Construction and extraction occupations (%)
Most Common Occupations - Installation, maintenance, and repair occupations (%)
Most Common Occupations - Production, transportation, and material moving occupations (%)
Most Common Occupations - Production occupations (%)
Most Common Occupations - Transportation occupations (%)
Most Common Occupations - Material moving occupations (%)
People in Group quarters - Institutionalized population (%)
People in Group quarters - Correctional institutions (%)
People in Group quarters - Federal prisons and detention centers (%)
People in Group quarters - Halfway houses (%)
People in Group quarters - Local jails and other confinement facilities (including police lockups) (%)
People in Group quarters - Military disciplinary barracks (%)
People in Group quarters - State prisons (%)
People in Group quarters - Other types of correctional institutions (%)
People in Group quarters - Nursing homes (%)
People in Group quarters - Hospitals/wards, hospices, and schools for the handicapped (%)
People in Group quarters - Hospitals/wards and hospices for chronically ill (%)
People in Group quarters - Hospices or homes for chronically ill (%)
People in Group quarters - Military hospitals or wards for chronically ill (%)
People in Group quarters - Other hospitals or wards for chronically ill (%)
People in Group quarters - Hospitals or wards for drug/alcohol abuse (%)
People in Group quarters - Mental (Psychiatric) hospitals or wards (%)
People in Group quarters - Schools, hospitals, or wards for the mentally retarded (%)
People in Group quarters - Schools, hospitals, or wards for the physically handicapped (%)
People in Group quarters - Institutions for the deaf (%)
People in Group quarters - Institutions for the blind (%)
People in Group quarters - Orthopedic wards and institutions for the physically handicapped (%)
People in Group quarters - Wards in general hospitals for patients who have no usual home elsewhere (%)
People in Group quarters - Wards in military hospitals for patients who have no usual home elsewhere (%)
People in Group quarters - Juvenile institutions (%)
People in Group quarters - Long-term care (%)
People in Group quarters - Homes for abused, dependent, and neglected children (%)
People in Group quarters - Residential treatment centers for emotionally disturbed children (%)
People in Group quarters - Training schools for juvenile delinquents (%)
People in Group quarters - Short-term care, detention or diagnostic centers for delinquent children (%)
People in Group quarters - Type of juvenile institution unknown (%)
People in Group quarters - Noninstitutionalized population (%)
People in Group quarters - College dormitories (includes college quarters off campus) (%)
People in Group quarters - Military quarters (%)
People in Group quarters - On base (%)
People in Group quarters - Barracks, unaccompanied personnel housing (UPH), (Enlisted/Officer), ;and similar group living quarters for military personnel (%)
People in Group quarters - Transient quarters for temporary residents (%)
People in Group quarters - Military ships (%)
People in Group quarters - Group homes (%)
People in Group quarters - Homes or halfway houses for drug/alcohol abuse (%)
People in Group quarters - Homes for the mentally ill (%)
People in Group quarters - Homes for the mentally retarded (%)
People in Group quarters - Homes for the physically handicapped (%)
People in Group quarters - Other group homes (%)
People in Group quarters - Religious group quarters (%)
People in Group quarters - Dormitories (%)
People in Group quarters - Agriculture workers' dormitories on farms (%)
People in Group quarters - Job Corps and vocational training facilities (%)
People in Group quarters - Other workers' dormitories (%)
People in Group quarters - Crews of maritime vessels (%)
People in Group quarters - Other nonhousehold living situations (%)
People in Group quarters - Other noninstitutional group quarters (%)
Residents speaking English at home (%)
Residents speaking English at home - Born in the United States (%)
Residents speaking English at home - Native, born elsewhere (%)
Residents speaking English at home - Foreign born (%)
Residents speaking Spanish at home (%)
Residents speaking Spanish at home - Born in the United States (%)
Residents speaking Spanish at home - Native, born elsewhere (%)
Residents speaking Spanish at home - Foreign born (%)
Residents speaking other language at home (%)
Residents speaking other language at home - Born in the United States (%)
Residents speaking other language at home - Native, born elsewhere (%)
Residents speaking other language at home - Foreign born (%)
Class of Workers - Employee of private company (%)
Class of Workers - Self-employed in own incorporated business (%)
Class of Workers - Private not-for-profit wage and salary workers (%)
Class of Workers - Local government workers (%)
Class of Workers - State government workers (%)
Class of Workers - Federal government workers (%)
Class of Workers - Self-employed workers in own not incorporated business and Unpaid family workers (%)
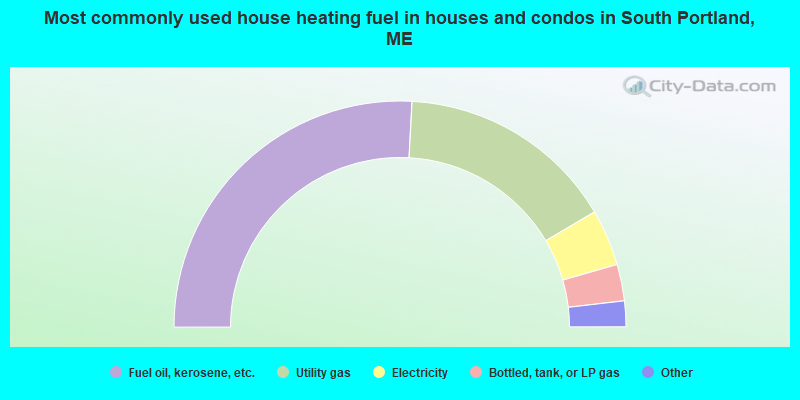
House heating fuel used in houses and condos - Utility gas (%)
House heating fuel used in houses and condos - Bottled, tank, or LP gas (%)
House heating fuel used in houses and condos - Electricity (%)
House heating fuel used in houses and condos - Fuel oil, kerosene, etc. (%)
House heating fuel used in houses and condos - Coal or coke (%)
House heating fuel used in houses and condos - Wood (%)
House heating fuel used in houses and condos - Solar energy (%)
House heating fuel used in houses and condos - Other fuel (%)
House heating fuel used in houses and condos - No fuel used (%)
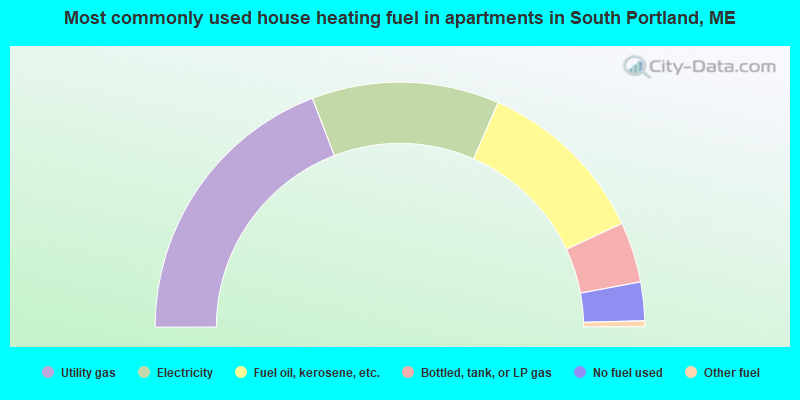
House heating fuel used in apartments - Utility gas (%)
House heating fuel used in apartments - Bottled, tank, or LP gas (%)
House heating fuel used in apartments - Electricity (%)
House heating fuel used in apartments - Fuel oil, kerosene, etc. (%)
House heating fuel used in apartments - Coal or coke (%)
House heating fuel used in apartments - Wood (%)
House heating fuel used in apartments - Solar energy (%)
House heating fuel used in apartments - Other fuel (%)
House heating fuel used in apartments - No fuel used (%)
Armed forces status - In Armed Forces (%)
Armed forces status - Civilian (%)
Armed forces status - Civilian - Veteran (%)
Armed forces status - Civilian - Nonveteran (%)
Fatal accidents locations in years 2005-2021
Fatal accidents locations in 2005
Fatal accidents locations in 2006
Fatal accidents locations in 2007
Fatal accidents locations in 2008
Fatal accidents locations in 2009
Fatal accidents locations in 2010
Fatal accidents locations in 2011
Fatal accidents locations in 2012
Fatal accidents locations in 2013
Fatal accidents locations in 2014
Fatal accidents locations in 2015
Fatal accidents locations in 2016
Fatal accidents locations in 2017
Fatal accidents locations in 2018
Fatal accidents locations in 2019
Fatal accidents locations in 2020
Fatal accidents locations in 2021
Alcohol use - People drinking some alcohol every month (%)
Alcohol use - People not drinking at all (%)
Alcohol use - Average days/month drinking alcohol
Alcohol use - Average drinks/week
Alcohol use - Average days/year people drink much
Audiometry - Average condition of hearing (%)
Audiometry - People that can hear a whisper from across a quiet room (%)
Audiometry - People that can hear normal voice from across a quiet room (%)
Audiometry - Ears ringing, roaring, buzzing (%)
Audiometry - Had a job exposure to loud noise (%)
Audiometry - Had off-work exposure to loud noise (%)
Blood Pressure & Cholesterol - Has high blood pressure (%)
Blood Pressure & Cholesterol - Checking blood pressure at home (%)
Blood Pressure & Cholesterol - Frequently checking blood cholesterol (%)
Blood Pressure & Cholesterol - Has high cholesterol level (%)
Consumer Behavior - Money monthly spent on food at supermarket/grocery store
Consumer Behavior - Money monthly spent on food at other stores
Consumer Behavior - Money monthly spent on eating out
Consumer Behavior - Money monthly spent on carryout/delivered foods
Consumer Behavior - Income spent on food at supermarket/grocery store (%)
Consumer Behavior - Income spent on food at other stores (%)
Consumer Behavior - Income spent on eating out (%)
Consumer Behavior - Income spent on carryout/delivered foods (%)
Current Health Status - General health condition (%)
Current Health Status - Blood donors (%)
Current Health Status - Has blood ever tested for HIV virus (%)
Current Health Status - Left-handed people (%)
Dermatology - People using sunscreen (%)
Diabetes - Diabetics (%)
Diabetes - Had a blood test for high blood sugar (%)
Diabetes - People taking insulin (%)
Diet Behavior & Nutrition - Diet health (%)
Diet Behavior & Nutrition - Milk product consumption (# of products/month)
Diet Behavior & Nutrition - Meals not home prepared (#/week)
Diet Behavior & Nutrition - Meals from fast food or pizza place (#/week)
Diet Behavior & Nutrition - Ready-to-eat foods (#/month)
Diet Behavior & Nutrition - Frozen meals/pizza (#/month)
Drug Use - People that ever used marijuana or hashish (%)
Drug Use - Ever used hard drugs (%)
Drug Use - Ever used any form of cocaine (%)
Drug Use - Ever used heroin (%)
Drug Use - Ever used methamphetamine (%)
Health Insurance - People covered by health insurance (%)
Kidney Conditions-Urology - Avg. # of times urinating at night
Medical Conditions - People with asthma (%)
Medical Conditions - People with anemia (%)
Medical Conditions - People with psoriasis (%)
Medical Conditions - People with overweight (%)
Medical Conditions - Elderly people having difficulties in thinking or remembering (%)
Medical Conditions - People who ever received blood transfusion (%)
Medical Conditions - People having trouble seeing even with glass/contacts (%)
Medical Conditions - People with arthritis (%)
Medical Conditions - People with gout (%)
Medical Conditions - People with congestive heart failure (%)
Medical Conditions - People with coronary heart disease (%)
Medical Conditions - People with angina pectoris (%)
Medical Conditions - People who ever had heart attack (%)
Medical Conditions - People who ever had stroke (%)
Medical Conditions - People with emphysema (%)
Medical Conditions - People with thyroid problem (%)
Medical Conditions - People with chronic bronchitis (%)
Medical Conditions - People with any liver condition (%)
Medical Conditions - People who ever had cancer or malignancy (%)
Mental Health - People who have little interest in doing things (%)
Mental Health - People feeling down, depressed, or hopeless (%)
Mental Health - People who have trouble sleeping or sleeping too much (%)
Mental Health - People feeling tired or having little energy (%)
Mental Health - People with poor appetite or overeating (%)
Mental Health - People feeling bad about themself (%)
Mental Health - People who have trouble concentrating on things (%)
Mental Health - People moving or speaking slowly or too fast (%)
Mental Health - People having thoughts they would be better off dead (%)
Oral Health - Average years since last visit a dentist
Oral Health - People embarrassed because of mouth (%)
Oral Health - People with gum disease (%)
Oral Health - General health of teeth and gums (%)
Oral Health - Average days a week using dental floss/device
Oral Health - Average days a week using mouthwash for dental problem
Oral Health - Average number of teeth
Pesticide Use - Households using pesticides to control insects (%)
Pesticide Use - Households using pesticides to kill weeds (%)
Physical Activity - People doing vigorous-intensity work activities (%)
Physical Activity - People doing moderate-intensity work activities (%)
Physical Activity - People walking or bicycling (%)
Physical Activity - People doing vigorous-intensity recreational activities (%)
Physical Activity - People doing moderate-intensity recreational activities (%)
Physical Activity - Average hours a day doing sedentary activities
Physical Activity - Average hours a day watching TV or videos
Physical Activity - Average hours a day using computer
Physical Functioning - People having limitations keeping them from working (%)
Physical Functioning - People limited in amount of work they can do (%)
Physical Functioning - People that need special equipment to walk (%)
Physical Functioning - People experiencing confusion/memory problems (%)
Physical Functioning - People requiring special healthcare equipment (%)
Prescription Medications - Average number of prescription medicines taking
Preventive Aspirin Use - Adults 40+ taking low-dose aspirin (%)
Reproductive Health - Vaginal deliveries (%)
Reproductive Health - Cesarean deliveries (%)
Reproductive Health - Deliveries resulted in a live birth (%)
Reproductive Health - Pregnancies resulted in a delivery (%)
Reproductive Health - Women breastfeeding newborns (%)
Reproductive Health - Women that had a hysterectomy (%)
Reproductive Health - Women that had both ovaries removed (%)
Reproductive Health - Women that have ever taken birth control pills (%)
Reproductive Health - Women taking birth control pills (%)
Reproductive Health - Women that have ever used Depo-Provera or injectables (%)
Reproductive Health - Women that have ever used female hormones (%)
Sexual Behavior - People 18+ that ever had sex (vaginal, anal, or oral) (%)
Sexual Behavior - Males 18+ that ever had vaginal sex with a woman (%)
Sexual Behavior - Males 18+ that ever performed oral sex on a woman (%)
Sexual Behavior - Males 18+ that ever had anal sex with a woman (%)
Sexual Behavior - Males 18+ that ever had any sex with a man (%)
Sexual Behavior - Females 18+ that ever had vaginal sex with a man (%)
Sexual Behavior - Females 18+ that ever performed oral sex on a man (%)
Sexual Behavior - Females 18+ that ever had anal sex with a man (%)
Sexual Behavior - Females 18+ that ever had any kind of sex with a woman (%)
Sexual Behavior - Average age people first had sex
Sexual Behavior - Average number of female sex partners in lifetime (males 18+)
Sexual Behavior - Average number of female vaginal sex partners in lifetime (males 18+)
Sexual Behavior - Average age people first performed oral sex on a woman (18+)
Sexual Behavior - Average number of woman performed oral sex on in lifetime (18+)
Sexual Behavior - Average number of male sex partners in lifetime (males 18+)
Sexual Behavior - Average number of male anal sex partners in lifetime (males 18+)
Sexual Behavior - Average age people first performed oral sex on a man (18+)
Sexual Behavior - Average number of male oral sex partners in lifetime (18+)
Sexual Behavior - People using protection when performing oral sex (%)
Sexual Behavior - Average number of times people have vaginal or anal sex a year
Sexual Behavior - People having sex without condom (%)
Sexual Behavior - Average number of male sex partners in lifetime (females 18+)
Sexual Behavior - Average number of male vaginal sex partners in lifetime (females 18+)
Sexual Behavior - Average number of female sex partners in lifetime (females 18+)
Sexual Behavior - Circumcised males 18+ (%)
Sleep Disorders - Average hours sleeping at night
Sleep Disorders - People that has trouble sleeping (%)
Smoking-Cigarette Use - People smoking cigarettes (%)
Taste & Smell - People 40+ having problems with smell (%)
Taste & Smell - People 40+ having problems with taste (%)
Taste & Smell - People 40+ that ever had wisdom teeth removed (%)
Taste & Smell - People 40+ that ever had tonsils teeth removed (%)
Taste & Smell - People 40+ that ever had a loss of consciousness because of a head injury (%)
Taste & Smell - People 40+ that ever had a broken nose or other serious injury to face or skull (%)
Taste & Smell - People 40+ that ever had two or more sinus infections (%)
Weight - Average height (inches)
Weight - Average weight (pounds)
Weight - Average BMI
Weight - People that are obese (%)
Weight - People that ever were obese (%)
Weight - People trying to lose weight (%)
According to our research of Maine and other state lists, there were 17 registered sex offenders living in South Portland, Maine as of April 27, 2024 . The ratio of all residents to sex offenders in South Portland is 1,514 to 1.The ratio of registered sex offenders to all residents in this city is much lower than the state average.
Officers per 1,000 residents here:
1.88Maine average:
1.71
Latest news from South Portland, ME collected exclusively by city-data.com from local newspapers, TV, and radio stations
South Portland, ME City Guides: Ancestries: English (14.1%), Irish (11.6%), French (8.2%), American (7.9%), French Canadian (4.8%), Italian (4.8%).
Current Local Time:
Incorporated on 03/15/1895
Land area: 12.0 square miles.
Population density: 2,253 people per square mile (low).
2,684 residents are foreign born (5.3% Africa , 2.0% Asia , 1.1% Latin America , 1.0% Europe ).
Median real estate property taxes paid for housing units with mortgages in 2022: $3,794 (0.9%)Median real estate property taxes paid for housing units with no mortgage in 2022: $4,306 (1.0%)
Nearest city with pop. 50,000+: Portland, ME
Nearest city with pop. 200,000+: Boston, MA
Nearest city with pop. 1,000,000+: Bronx, NY
Nearest cities:
Latitude: 43.63 N, Longitude: 70.27 W
Daytime population change due to commuting: +6,060 (+22.4%)Workers who live and work in this city: 6,597 (41.3%)
Area code commonly used in this area: 207
South Portland tourist attractions:
Single-family new house construction building permits:
2022: 17 buildings , average cost: $372,2002021: 22 buildings , average cost: $227,9002020: 15 buildings , average cost: $210,3002019: 18 buildings , average cost: $156,8002018: 22 buildings , average cost: $169,7002017: 40 buildings , average cost: $167,3002016: 13 buildings , average cost: $133,2002015: 27 buildings , average cost: $129,0002014: 31 buildings , average cost: $145,8002013: 26 buildings , average cost: $139,4002012: 21 buildings , average cost: $130,6002011: 17 buildings , average cost: $175,7002010: 32 buildings , average cost: $126,8002009: 32 buildings , average cost: $142,6002008: 34 buildings , average cost: $136,7002007: 41 buildings , average cost: $100,5002006: 70 buildings , average cost: $104,2002005: 88 buildings , average cost: $151,4002004: 60 buildings , average cost: $147,7002003: 127 buildings , average cost: $99,3002002: 71 buildings , average cost: $103,0002001: 34 buildings , average cost: $118,3002000: 74 buildings , average cost: $90,7001999: 71 buildings , average cost: $86,5001998: 72 buildings , average cost: $78,6001997: 53 buildings , average cost: $68,500Unemployment in December 2023:
Most common occupations in South Portland, ME (%)
Both Males Females
Other office and administrative support workers, including supervisors (5.0%)
Other sales and related occupations, including supervisors (4.8%)
Other management occupations, except farmers and farm managers (4.7%)
Retail sales workers, except cashiers (3.8%)
Material recording, scheduling, dispatching, and distributing workers (3.6%)
Secretaries and administrative assistants (3.2%)
Building and grounds cleaning and maintenance occupations (3.0%)
Other sales and related occupations, including supervisors (5.8%)
Other management occupations, except farmers and farm managers (5.8%)
Computer specialists (4.2%)
Retail sales workers, except cashiers (4.2%)
Electrical equipment mechanics and other installation, maintenance, and repair workers, including supervisors (4.2%)
Material recording, scheduling, dispatching, and distributing workers (4.1%)
Driver/sales workers and truck drivers (4.0%)
Other office and administrative support workers, including supervisors (7.4%)
Secretaries and administrative assistants (6.1%)
Registered nurses (5.0%)
Information and record clerks, except customer service representatives (4.2%)
Other sales and related occupations, including supervisors (3.7%)
Health technologists and technicians (3.7%)
Other management occupations, except farmers and farm managers (3.6%)
Tornado activity:
South Portland-area historical tornado activity is above Maine state average. It is 78% smaller than the overall U.S. average.
On 10/10/1966, a category F2 (max. wind speeds 113-157 mph) tornado 29.0 miles away from the South Portland city center caused between $5000 and $50,000 in damages.
On 5/14/1963, a category F2 tornado 37.5 miles away from the city center caused between $5000 and $50,000 in damages.
Earthquake activity:
South Portland-area historical earthquake activity is significantly above Maine state average. It is 75% smaller than the overall U.S. average. On 10/16/2012 at 23:12:25, a magnitude 4.7 (4.7 ML, Depth: 10.0 mi, Class: Light, Intensity: IV - V) earthquake occurred 19.3 miles away from South Portland center On 4/20/2002 at 10:50:47, a magnitude 5.3 (5.3 ML, Depth: 3.0 mi, Class: Moderate, Intensity: VI - VII) earthquake occurred 180.7 miles away from South Portland center On 1/19/1982 at 00:14:42, a magnitude 4.7 (4.5 MB, 4.7 MD, 4.5 LG) earthquake occurred 67.1 miles away from the city center On 4/20/2002 at 10:50:47, a magnitude 5.2 (5.2 MB, 4.2 MS, 5.2 MW, 5.0 MW) earthquake occurred 181.2 miles away from South Portland center On 10/7/1983 at 10:18:46, a magnitude 5.3 (5.1 MB, 5.3 LG, 5.1 ML) earthquake occurred 204.4 miles away from South Portland center On 8/21/1996 at 07:54:14, a magnitude 3.8 (3.8 LG, 3.6 LG, Depth: 6.2 mi, Class: Light, Intensity: II - III) earthquake occurred 66.0 miles away from the city center Magnitude types: regional Lg-wave magnitude (LG), body-wave magnitude (MB), duration magnitude (MD), local magnitude (ML), surface-wave magnitude (MS), moment magnitude (MW) Natural disasters: The number of natural disasters in Cumberland County (33) is a lot greater than the US average (15).Major Disasters (Presidential) Declared: 22Emergencies Declared: 10Floods: 19, Storms: 13, Snows: 7, Winter Storms: 6, Heavy Rains: 3, Hurricanes: 3, Winds: 3, Blizzard: 1, Ice Storm: 1, Mudslide: 1, Snowfall: 1, Snowstorm: 1, Tornado: 1, Other: 2 (Note: some incidents may be assigned to more than one category). Main business address for: FAIRCHILD SEMICONDUCTOR INTERNATIONAL INC SEMICONDUCTORS & RELATED DEVICES ), Wright Express CORP SERVICES-AUTOMOTIVE REPAIR, SERVICES & PARKING ).
Hospitals and medical centers near South Portland: INTERIM HEALTHCARE OF PORTLAND, MAINE (Home Health Center, about 1 miles away; SO PORTLAND, ME)
BEACON HOSPICE (Hospital, about 1 miles away; SO PORTLAND, ME)
SOUTH PORTLAND NURSING HOME (Nursing Home, about 1 miles away; SO PORTLAND, ME)
MAINE MEDICAL CENTER (about 2 miles away; PORTLAND, ME)
MERCY HOSPITAL (about 2 miles away; PORTLAND, ME)
AMEDISYS HOME HEALTH (Home Health Center, about 2 miles away; PORTLAND, ME)
HILLSIDE REST AND NURSING HOME (Nursing Home, about 3 miles away; PORTLAND, ME)
Amtrak stations near South Portland: 2 miles: PORTLAND (100 THOMPSON POINT ROAD) Services: ticket office, enclosed waiting area, public restrooms, public payphones, ATM.
10 miles: OLD ORCHARD BEACH (11 FIRST ST.) - Seasonal Station Services: ticket office, public payphones.
13 miles: SACO (130 MAIN ST.) Services: ticket office.
Colleges/Universities in South Portland: Southern Maine Community College Full-time enrollment: 4,666; Location: 2 Fort Road; Public; Website: www.smccME.edu)
InterCoast Career Institute-South Portland Full-time enrollment: 486; Location: 207 Gannett Dr; Private, for-profit; Website: www.intercoast.edu)
Other colleges/universities with over 2000 students near South Portland:
University of Southern Maine (about 3 miles; Portland, ME ; Full-time enrollment: 6,647)
University of New England (about 14 miles; Biddeford, ME ; FT enrollment: 4,539)
Saint Joseph's College of Maine (about 18 miles; Standish, ME ; FT enrollment: 2,010)
University of New Hampshire-Main Campus (about 48 miles; Durham, NH ; FT enrollment: 15,243)
University of Maine at Augusta (about 55 miles; Augusta, ME ; FT enrollment: 3,204)
NHTI-Concord's Community College (about 70 miles; Concord, NH ; FT enrollment: 2,865)
Northern Essex Community College (about 70 miles; Haverhill, MA ; FT enrollment: 4,737)
Public high schools in South Portland:
Private high schools in South Portland: GREATER PORTLAND CHRISTIAN SCHOOL Students: 134, Location: 1338 BROADWAY, Grades: PK-12)
SPURWINK SCHOOL--S PORTLAND Students: 22, Location: 341 PINE ST, Grades: 2-10)
Public elementary/middle schools in South Portland: DANIEL F. MAHONEY MIDDLE SCHOOL Students: 348, Location: 240 OCEAN STREET, Grades: 6-8)DORA L SMALL ELEMENTARY SCHOOL Students: 277, Location: 87 THOMPSON STREET, Grades: KG-5)FRANK I BROWN ELEMENTARY SCHOOL Students: 272, Location: 37 HIGHLAND AVENUE, Grades: KG-5)DYER ELEMENTARY SCHOOL Students: 217, Location: 52 ALFRED STREET, Grades: KG-5)WALDO T SKILLIN ELEMENTARY SCHOOL Location: 180 WESCOTT ROAD, Grades: PK-5)MEMORIAL MIDDLE SCHOOL Location: 120 WESCOTT ROAD, Grades: 6-8)JAMES OTIS KALER ELEMENTARY SCHOOL Location: 165 KELSEY STREET, Grades: PK-5)Private elementary/middle school in South Portland: HOLY CROSS SCHOOL Students: 163, Location: 436 BROADWAY, Grades: PK-8)
See full list of schools located in South Portland Library in South Portland: SOUTH PORTLAND PUBLIC LIBRARY Operating income: $760,586; Location: 482 BROADWAY; 109,367 books ; 4,423 audio materials ; 5,148 video materials ; 52 other licensed databases ; 80 print serial subscriptions )
Notable locations in South Portland: (A) , South Portland Municipal Golf Course (B) , Sable Oaks Golf Club (C) , Marineast (D) , Marine Shipyard (E) , Channel Crossing Marina (F) , Centerboard Yacht Club (G) , Pleasantdale Hose Company Engine 3 (H) , South Portland Fire Department Thornton Heights (I) , South Portland Fire Department Ferry Village (J) , South Portland Fire Department Willard Square (K) , American Medical Response (L) , Northeast Mobile Health Service (M) , Maine Youth Center Library (N) , Memorial Branch South Portland Public Library (O) , South Portland Fire Department Central (P) , South Portland Public Library (Q) , South Portland Fire Department Cash Corner (R) , South Portland Fire Department West End (S) . Display/hide their locations on the map
Shopping Centers: (1) , Cornerbrook Shopping Center (2) , Maine Mall (3) . Display/hide their locations on the map
Main business address in South Portland include: (A) , Wright Express CORP (B) . Display/hide their locations on the map
Churches in South Portland include: (A) , Holy Cross Church (B) , Greater Grace Bible Church (C) , Greater Portland Church of Christ (D) , Saint Johns Church (E) , Peoples United Methodist Church (F) , Cape Elizabeth Methodist Church (G) , Cape Shore Assembly of God Church (H) , Holy Nativity Orthodox Church (I) . Display/hide their locations on the map
Cemeteries: (1) , Mount Pleasant Cemetery (2) , Highland Memorial Gardens (3) , Forest City Cemetery (4) . Display/hide their locations on the map
Reservoir: (A) . Display/hide its location on the map
Streams, rivers, and creeks: (A) , Barberry Creek (B) , Kimball Brook (C) , Trout Brook (D) , Red Brook (E) , Long Creek (F) . Display/hide their locations on the map
Parks in South Portland include: (1) , Mill Creek Park (2) , Hinckley Park (3) . Display/hide their locations on the map
Tourist attractions: (1) , South Portland City - Libraries (Cultural Attractions- Events- & Facilities; 482 Broadway) (2) , Dream Machine The (Arcades & Amusements; Maine Mall Rd) (3) . Display/hide their approximate locations on the map
Hotels: (1) , Hampton Inn Portland-Airport (171 Philbrook Avenue) (2) , Hampton Inn (171 Philbrook Avenue) (3) , Maine Motel (606 Maine Street) (4) , Anchor Motel (715 Main Street) (5) , Coastline Inn South Portland (80 John Roberts Road) (6) , Comfort Inn (90 Maine Mall Rd) (7) , Portland-Days Inn South Portland (461 Maine Mall Rd) (8) , Sheraton South Portland Hotel (363 Maine Mall Road) (9) . Display/hide their approximate locations on the map
Birthplace of: Robert Crowley (Survivor contestant) - Schoolteacher, Peter Buck (restaurateur) - Restaurateur, Chris Markwood - College basketball player (Maine Black Bears), Ed McAleney - Football player.
Cumberland County has a predicted average indoor radon screening level greater than 4 pCi/L (pico curies per liter) - Highest Potential Drinking water stations with addresses in South Portland and their reported violations in the past:
CAMP PONDICHERRY #1-SITE WELL (Population served: 150, Groundwater):
Past health violations:
MCL, Monthly (TCR) - In MAY-2005, Contaminant: Coliform. Follow-up actions: St Public Notif requested (MAY-31-2005), St Violation/Reminder Notice (MAY-31-2005), St Public Notif received (2 times from JUN-27-2005 to JUN-27-2005), St Compliance achieved (JAN-19-2007)
Past monitoring violations:
4 routine major monitoring violations
One regular monitoring violation
Population served: 150, Groundwater):
Past monitoring violations:
One routine major monitoring violation
Population served: 100, Groundwater):
Past monitoring violations:
One routine major monitoring violation
One regular monitoring violation
Population served: 100, Groundwater):
Past monitoring violations:
2 routine major monitoring violations
Population served: 80, Groundwater):
Past health violations:
MCL, Monthly (TCR) - In AUG-2013, Contaminant: Coliform. Follow-up actions: St Public Notif requested (SEP-03-2013), St Formal NOV issued (SEP-03-2013), St Public Notif received (SEP-23-2013)
MCL, Monthly (TCR) - In JUL-2013, Contaminant: Coliform. Follow-up actions: St Public Notif requested (JUL-25-2013), St Formal NOV issued (JUL-25-2013), St Public Notif received (JUL-29-2013)
MCL, Monthly (TCR) - In JUN-2010, Contaminant: Coliform. Follow-up actions: St Public Notif requested (JUL-06-2010), St Formal NOV issued (JUL-06-2010), St Compliance achieved (JUL-21-2010), St Public Notif received (JUL-23-2010)
Past monitoring violations:
2 routine major monitoring violations
Population served: 25, Groundwater):
Past monitoring violations:
One routine major monitoring violation
One regular monitoring violation
Average household size: This city:
2.2 peopleMaine:
2.3 people
Percentage of family households: This city:
57.0%Whole state:
62.9%
Percentage of households with unmarried partners: This city:
9.9%Whole state:
9.4%
Likely homosexual households (counted as self-reported same-sex unmarried-partner households)
Lesbian couples: 1.2% of all households Gay men: 0.5% of all households
People in group quarters in South Portland in 2010:
385 people in college/university student housing
116 people in correctional facilities intended for juveniles
73 people in nursing facilities/skilled-nursing facilities
20 people in residential treatment centers for adults
17 people in group homes intended for adults
9 people in military barracks and dormitories (nondisciplinary)
6 people in other noninstitutional facilities
4 people in workers' group living quarters and job corps centers
3 people in group homes for juveniles (non-correctional)
3 people in residential treatment centers for juveniles (non-correctional)
People in group quarters in South Portland in 2000:
179 people in training schools for juvenile delinquents
113 people in college dormitories (includes college quarters off campus)
64 people in nursing homes
45 people in other noninstitutional group quarters
41 people in other group homes
31 people in homes for the mentally retarded
13 people in military barracks, etc.
11 people in wards in general hospitals for patients who have no usual home elsewhere
10 people in homes for the mentally ill
9 people in military ships
5 people in homes for abused, dependent, and neglected children
Banks with most branches in South Portland (2011 data):
TD Bank, National Association: Market Street, Mall Plaza Branch, South Portland Branch. Info updated 2010/10/04: Bank assets: $188,912.6 mil, Deposits: $153,149.8 mil, headquarters in Wilmington, DE, positive income , 1314 total offices , Holding Company: Toronto-Dominion Bank, The
KeyBank National Association: Mill Creek Financial Center at 25 Market Street, branch established on 1955/10/31; Maine Mall Branch at 445 Gorham Road, branch established on 1974/01/31. Info updated 2008/03/03: Bank assets: $86,198.8 mil, Deposits: $64,214.8 mil, headquarters in Cleveland, OH, positive income , Commercial Lending Specialization, 1067 total offices , Holding Company: Keycorp
Bank of America, National Association: Mill Creek Shopping Center Branch at 50 Market Street, branch established on 1955/06/22; Maine Mall Branch at 425 Philbrook Avenue, branch established on 1985/09/30. Info updated 2009/11/18: Bank assets: $1,451,969.3 mil, Deposits: $1,077,176.8 mil, headquarters in Charlotte, NC, positive income , 5782 total offices , Holding Company: Bank Of America Corporation
Bath Savings Institution: South Portland Branch at 225 Ocean Street, branch established on 2012/02/27. Info updated 2006/11/03: Bank assets: $636.7 mil, Deposits: $486.8 mil, headquarters in Bath, ME, positive income , Commercial Lending Specialization, 11 total offices
Norway Savings Bank: Waterman Drive Branch at 207 Waterman Drive, branch established on 2002/02/07. Info updated 2006/11/03: Bank assets: $958.8 mil, Deposits: $711.3 mil, headquarters in Norway, ME, positive income , Commercial Lending Specialization, 20 total offices , Holding Company: Norway Bancorp, Mhc
Gorham Savings Bank: South Portland Branch at 395 Gorham Road, branch established on 2003/09/29. Info updated 2008/07/29: Bank assets: $912.7 mil, Deposits: $640.1 mil, headquarters in Gorham, ME, positive income , Commercial Lending Specialization, 11 total offices , Holding Company: Gorham Bancorp, Mhc
Saco & Biddeford Savings Institution: South Portland Branch at 601 Broadway, branch established on 2000/03/06. Info updated 2009/03/09: Bank assets: $759.8 mil, Deposits: $521.1 mil, headquarters in Saco, ME, positive income , Mortgage Lending Specialization, 6 total offices
Bangor Savings Bank: South Portland Branch at 180 Waterman Drive, branch established on 2007/01/22. Info updated 2008/12/02: Bank assets: $2,556.3 mil, Deposits: $1,940.3 mil, headquarters in Bangor, ME, positive income , Commercial Lending Specialization, 58 total offices , Holding Company: Bangor Bancorp, Mhc
People's United Bank: South Portland Branch at 15 Hinckley Drive, branch established on 1992/06/05. Info updated 2012/02/16: Bank assets: $27,319.3 mil, Deposits: $20,835.4 mil, headquarters in Bridgeport, CT, positive income , Commercial Lending Specialization, 374 total offices
For population 15 years and over in South Portland:
Never married: 36.2%Now married: 45.4%Separated: 0.6%Widowed: 4.9%Divorced: 12.8% For population 25 years and over in South Portland:
High school or higher: 96.2%Bachelor's degree or higher: 49.1%Graduate or professional degree: 17.1%Unemployed: 3.3%Mean travel time to work (commute): 15.3 minutes
Education Gini index (Inequality in education) Here:
9.6Maine average:
10.3
Religion statistics for South Portland, ME (based on Cumberland County data)
Religion Adherents Congregations Catholic 38,243 19 Mainline Protestant 22,030 96 Evangelical Protestant 12,007 85 Other 7,187 44 Orthodox 500 1 Black Protestant 285 2 None 201,422 -
Source: Clifford Grammich, Kirk Hadaway, Richard Houseal, Dale E.Jones, Alexei Krindatch, Richie Stanley and Richard H.Taylor. 2012. 2010 U.S.Religion Census: Religious Congregations & Membership Study. Association of Statisticians of American Religious Bodies. Jones, Dale E., et al. 2002. Congregations and Membership in the United States 2000. Nashville, TN: Glenmary Research Center. Graphs represent county-level data
Food Environment Statistics: Number of grocery stores : 72Here :
2.62 / 10,000 pop.Maine :
2.80 / 10,000 pop.
Number of supercenters and club stores : 3Cumberland County :
0.11 / 10,000 pop.Maine :
0.14 / 10,000 pop.
Number of convenience stores (no gas) : 67Cumberland County :
2.44 / 10,000 pop.Maine :
2.20 / 10,000 pop.
Number of convenience stores (with gas) : 105Cumberland County :
3.82 / 10,000 pop.Maine :
5.75 / 10,000 pop.
Number of full-service restaurants : 330This county :
12.01 / 10,000 pop.Maine :
11.02 / 10,000 pop.
Adult diabetes rate : Cumberland County :
7.1%Maine :
8.2%
Adult obesity rate : This county :
19.5%State :
25.0%
Health and Nutrition: Healthy diet rate : This city:
56.0%Maine:
53.9%
Average overall health of teeth and gums : South Portland:
56.6%Maine:
52.9%
People feeling badly about themselves : This city:
19.1%Maine:
19.9%
People not drinking alcohol at all : Average hours sleeping at night : Overweight people : This city:
34.0%State:
34.3%
General health condition : Average condition of hearing : This city:
81.1%Maine:
79.6%
More about Health and Nutrition of South Portland, ME Residents
Local government employment and payroll (March 2022)
Function
Full-time employees
Monthly full-time payroll
Average yearly full-time wage
Part-time employees
Monthly part-time payroll
Elementary and Secondary - Instruction
463 $1,228,953 $31,852 59 $61,178 Elementary and Secondary - Other Total
147 $561,126 $45,806 46 $57,699 Firefighters
69 $387,943 $67,468 18 $4,973 Police Protection - Officers
51 $364,237 $85,703 0 $0 Parks and Recreation
31 $135,855 $52,589 57 $44,786 Other Government Administration
27 $156,373 $69,499 11 $13,590 Financial Administration
25 $143,242 $68,756 1 $2,059 Other and Unallocable
24 $150,337 $75,169 1 $2,068 Sewerage
23 $131,613 $68,668 0 $0 Streets and Highways
17 $117,977 $83,278 0 $0 Transit
14 $66,367 $56,886 0 $0 Local Libraries
9 $44,272 $59,029 8 $10,558 Health
8 $34,698 $52,047 2 $4,322 Welfare
3 $15,473 $61,892 0 $0 Solid Waste Management
2 $13,277 $79,662 0 $0 Police - Other
1 $4,840 $58,080 6 $5,407 Fire - Other
1 $6,523 $78,276 0 $0
Totals for Government
915 $3,563,106 $46,729 209 $206,641
South Portland government finances - Expenditure in 2021 (per resident):
Construction - Elementary and Secondary Education: $6,026,000 ($222.97)
Local Fire Protection: $5,449,000 ($201.62)Sewerage: $3,122,000 ($115.52)General - Other: $1,828,000 ($67.64)Central Staff Services: $292,000 ($10.80)Police Protection: $252,000 ($9.32)General Public Buildings: $159,000 ($5.88)Regular Highways: $149,000 ($5.51)Parks and Recreation: $86,000 ($3.18)Current Operations - Elementary and Secondary Education: $55,335,000 ($2047.47)
General - Other: $14,291,000 ($528.79)Police Protection: $5,886,000 ($217.79)Local Fire Protection: $5,647,000 ($208.95)Sewerage: $4,365,000 ($161.51)Regular Highways: $2,904,000 ($107.45)Parks and Recreation: $2,234,000 ($82.66)Solid Waste Management: $1,817,000 ($67.23)Central Staff Services: $1,639,000 ($60.65)Transit Utilities: $1,347,000 ($49.84)Financial Administration: $1,093,000 ($40.44)Housing and Community Development: $954,000 ($35.30)General Public Buildings: $737,000 ($27.27)Public Welfare - Other: $736,000 ($27.23)Libraries: $658,000 ($24.35)Protective Inspection and Regulation - Other: $475,000 ($17.58)Parking Facilities: $274,000 ($10.14)Miscellaneous Commercial Activities - Other: $234,000 ($8.66)Judicial and Legal Services: $119,000 ($4.40)Sea and Inland Port Facilities: $58,000 ($2.15)Natural Resources - Other: $54,000 ($2.00)General - Interest on Debt: $1,763,000 ($65.23)
Intergovernmental to Local - Other - Elementary and Secondary Education: $3,000 ($0.11)
Other Capital Outlay - Elementary and Secondary Education: $524,000 ($19.39)
Transit Utilities: $38,000 ($1.41)General - Other: $20,000 ($0.74)Total Salaries and Wages: $34,037,000 ($1259.42)
South Portland government finances - Revenue in 2021 (per resident):
Charges - Sewerage: $6,269,000 ($231.96)
Other: $2,946,000 ($109.01)Parks and Recreation: $946,000 ($35.00)Solid Waste Management: $170,000 ($6.29)Regular Highways: $76,000 ($2.81)Elementary and Secondary Education - Other: $14,000 ($0.52)Elementary and Secondary Education School Lunch: $10,000 ($0.37)Elementary and Secondary Education School Tuition and Transportation: $2,000 ($0.07)Federal Intergovernmental - Other: $1,165,000 ($43.11)
Housing and Community Development: $664,000 ($24.57)Health and Hospitals: $122,000 ($4.51)Local Intergovernmental - Education: $356,000 ($13.17)
Other: $288,000 ($10.66)Miscellaneous - General Revenue - Other: $1,030,000 ($38.11)
Interest Earnings: $340,000 ($12.58)Rents: $202,000 ($7.47)Donations From Private Sources: $147,000 ($5.44)Revenue - Transit Utilities: $120,000 ($4.44)
State Intergovernmental - Education: $14,953,000 ($553.28)
Other: $7,376,000 ($272.92)General Local Government Support: $2,592,000 ($95.91)Public Welfare: $451,000 ($16.69)Highways: $253,000 ($9.36)Health and Hospitals: $154,000 ($5.70)Tax - Property: $79,282,000 ($2933.55)
Other License: $1,302,000 ($48.18)Public Utilities Sales: $100,000 ($3.70)
South Portland government finances - Debt in 2021 (per resident):
Long Term Debt - Outstanding Unspecified Public Purpose: $48,050,000 ($1777.92)
Beginning Outstanding - Unspecified Public Purpose: $44,074,000 ($1630.80)Issue, Unspecified Public Purpose: $7,950,000 ($294.16)Retired Unspecified Public Purpose: $3,974,000 ($147.04)
South Portland government finances - Cash and Securities in 2021 (per resident):
Bond Funds - Cash and Securities: $3,521,000 ($130.28)
Other Funds - Cash and Securities: $61,080,000 ($2260.05)
Businesses in South Portland, ME
Name Count Name Count
7-Eleven 1 HomeTown Buffet 1 ALDO 1 Honda 1 AT&T 1 Howard Johnson 1 Abercrombie & Fitch 1 J. Jill 1 Aeropostale 1 JCPenney 1 American Eagle Outfitters 1 Johnny Rockets 1 Ann Taylor 1 Jones New York 1 Apple Store 1 Journeys 1 Applebee's 1 Justice 1 Arby's 1 Knights Inn 1 Ashley Furniture 1 Lane Bryant 1 Banana Republic 1 LensCrafters 1 Bath & Body Works 1 Macy's 1 Bed Bath & Beyond 1 McDonald's 1 Best Western 1 Men's Wearhouse 1 Brookstone 1 Motherhood Maternity 2 Buffalo Wild Wings 1 New Balance 1 Burlington Coat Factory 1 Nike 4 CVS 1 Nissan 1 Cache 1 Old Navy 1 Chevrolet 1 Olive Garden 1 Chico's 1 Outback 1 Chipotle 1 Outback Steakhouse 1 Chuck E. Cheese's 1 Pac Sun 1 Circle K 2 Panera Bread 1 Cold Stone Creamery 1 Papa John's Pizza 1 Coldwater Creek 1 Payless 2 Comfort Inn 1 Pizza Hut 1 Cracker Barrel 1 Quiznos 1 Dairy Queen 1 Rite Aid 1 Days Inn 1 Ruby Tuesday 1 Domino's Pizza 1 Sephora 1 Dunkin Donuts 4 Shaw's 1 Econo Lodge 1 Spencer Gifts 1 Express 1 Sprint Nextel 1 Famous Footwear 1 Staples 1 FedEx 8 Starbucks 2 Foot Locker 1 Subaru 1 Ford 1 Subway 1 Forever 21 1 T-Mobile 1 GNC 2 Taco Bell 1 GameStop 2 Talbots 2 Gap 1 Target 1 Goodwill 1 Toys"R"Us 2 Gymboree 1 True Value 2 H&M 1 U.S. Cellular 4 H&R Block 2 UPS 13 Hilton 1 Vans 3 Holiday Inn 1 Verizon Wireless 3
Strongest AM radio stations in South Portland:
WZAN (970 AM; 5 kW; PORTLAND, ME; Owner: SAGA COMMUNICATIONS OF NEW ENGLAND, LLC)
WGAN (560 AM; 5 kW; PORTLAND, ME; Owner: SAGA COMMUNICATIONS OF NEW ENGLAND, LLC)
WLOB (1310 AM; 5 kW; PORTLAND, ME; Owner: ATLANTIC COAST RADIO, LLC)
WBAE (1490 AM; 1 kW; PORTLAND, ME; Owner: SAGA COMMUNICATIONS OF NEW ENGLAND, LLC)
WJAE (1440 AM; 5 kW; WESTBROOK, ME; Owner: ALTANTIC COAST RADIO, LLC)
WMTW (870 AM; 10 kW; GORHAM, ME; Owner: RADIO PARTNERS OF MAINE, L.P.)
WRKO (680 AM; 50 kW; BOSTON, MA; Owner: ENTERCOM BOSTON LICENSE, LLC)
WGIN (930 AM; 10 kW; ROCHESTER, NH; Owner: CAPSTAR TX LIMITED PARTNERSHIP)
WEEI (850 AM; 50 kW; BOSTON, MA; Owner: ENTERCOM BOSTON LICENSE, LLC)
WBZ (1030 AM; 50 kW; BOSTON, MA; Owner: INFINITY BROADCASTING OPERATIONS, INC.)
WLAM (1470 AM; 5 kW; LEWISTON, ME; Owner: RADIO PARTNERS OF MAINE, L.P.)
WCRN (830 AM; 50 kW; WORCESTER, MA; Owner: CARTER BROADCASTING CORPORATION)
WWZN (1510 AM; 50 kW; BOSTON, MA; Owner: ROSE CITY RADIO CORPORATION)
Strongest FM radio stations in South Portland:
W245AA (96.9 FM; PORTLAND, ME; Owner: RADIO PARTNERS OF MAINE, L.P.)
WMGX (93.1 FM; PORTLAND, ME; Owner: SAGA COMMUNICATIONS OF NEW ENGLAND, LLC)
WPOR (101.9 FM; PORTLAND, ME; Owner: SAGA COMMUNICATIONS OF NEW ENGLAND, LLC)
WBQW (106.3 FM; SCARBOROUGH, ME; Owner: MARINER BROADCASTING LIMITED PARTNER)
WCYY (94.3 FM; BIDDEFORD, ME; Owner: CITADEL BROADCASTING COMPANY)
WMSJ (89.3 FM; FREEPORT, ME; Owner: DOWNEAST CHRISTIAN COMMUNICATIONS)
WRED (95.9 FM; SACO, ME; Owner: ATLANTIC COAST RADIO, LLC)
WMEA (90.1 FM; PORTLAND, ME; Owner: MAINE PUBLIC BROADCASTING CORPORATION)
WJBQ (97.9 FM; PORTLAND, ME; Owner: CITADEL BROADCASTING COMPANY)
WBLM (102.9 FM; PORTLAND, ME; Owner: CITADEL BROADCASTING COMPANY)
WYNZ (100.9 FM; WESTBROOK, ME; Owner: SAGA COMMUNICATIONS OF NEW ENGLAND, LLC)
WMTW-FM (106.7 FM; NORTH WINDHAM, ME; Owner: RADIO PARTNERS OF MAINE, L.P.)
WTHT (107.5 FM; LEWISTON, ME; Owner: RADIO PARTNERS OF MAINE, L.P.)
WPKQ (103.7 FM; NORTH CONWAY, NH; Owner: CITADEL BROADCASTING COMPANY)
WHOM (94.9 FM; MT. WASHINGTON, NH; Owner: CITADEL BROADCASTING COMPANY)
WMPG (90.9 FM; GORHAM, ME; Owner: UNIVERSITY OF MAINE SYSTEM)
WSCY (106.9 FM; MOULTONBOROUGH, NH; Owner: NORTHEAST COMMUNICATIONS CORPORATION)
WMEK-FM (99.9 FM; AUBURN, ME; Owner: RADIO PARTNERS OF MAINE, L.P.)
WYFP (91.9 FM; HARPSWELL, ME; Owner: BIBLE BROADCASTING NETWORK, INC.)
W281AC (104.1 FM; PORTLAND, ME; Owner: UNIVERSITY OF MAINE SYSTEM)
TV broadcast stations around South Portland:
WGME-TV (Channel 13; PORTLAND, ME; Owner: WGME LICENSEE, LLC)
WLLB-LP (Channel 15; PORTLAND, ME; Owner: CARTER BROADCASTING CORPORATION)
WMTW-TV (Channel 8; POLAND SPRING, ME; Owner: WMTW BROADCAST GROUP, LLC)
WPXT (Channel 51; PORTLAND, ME; Owner: HMW, INC.)
WPME (Channel 35; LEWISTON, ME; Owner: KB PRIME MEDIA LLC)
WMEA-TV (Channel 26; BIDDEFORD, ME; Owner: MAINE PUBLIC BROADCASTING CORP.)
WCSH (Channel 6; PORTLAND, ME; Owner: PACIFIC AND SOUTHERN COMPANY, INC.)
W32CA (Channel 32; PORTLAND, ME; Owner: NATIONAL MINORITY T.V., INC.)
W58CM (Channel 58; BANGOR, ME; Owner: MS COMMUNICATIONS, LLC)
W57AP (Channel 57; FALMOUTH, ME; Owner: SHERWOOD H. CRAIG)
Home Mortgage Disclosure Act Aggregated Statistics For Year 2009(Based on 6 full tracts) A) FHA, FSA/RHS & VA B) Conventional C) Refinancings D) Home Improvement Loans E) Loans on Dwellings For 5+ Families F) Non-occupant Loans on G) Loans On Manufactured Number Average Value Number Average Value Number Average Value Number Average Value Number Average Value Number Average Value Number Average Value
LOANS ORIGINATED 131 $182,511 147 $172,463 727 $176,142 99 $74,687 1 $572,000 51 $168,686 0 $0 APPLICATIONS APPROVED, NOT ACCEPTED 5 $142,400 19 $253,316 54 $207,000 6 $64,667 2 $1,528,000 5 $223,600 0 $0 APPLICATIONS DENIED 24 $197,000 21 $175,143 216 $210,421 30 $46,767 1 $14,875,000 21 $182,857 1 $62,000 APPLICATIONS WITHDRAWN 12 $187,500 7 $146,000 126 $191,921 3 $54,667 2 $1,317,500 3 $161,000 0 $0 FILES CLOSED FOR INCOMPLETENESS 1 $160,000 0 $0 21 $203,810 2 $25,000 0 $0 3 $238,333 0 $0
Aggregated Statistics For Year 2008(Based on 6 full tracts) A) FHA, FSA/RHS & VA B) Conventional C) Refinancings D) Home Improvement Loans E) Loans on Dwellings For 5+ Families F) Non-occupant Loans on Number Average Value Number Average Value Number Average Value Number Average Value Number Average Value Number Average Value
LOANS ORIGINATED 60 $196,783 191 $174,759 354 $170,085 158 $60,342 6 $240,167 66 $172,697 APPLICATIONS APPROVED, NOT ACCEPTED 2 $155,500 30 $171,433 66 $177,348 11 $60,909 0 $0 10 $162,600 APPLICATIONS DENIED 9 $171,444 35 $198,429 174 $201,408 39 $46,667 1 $800,000 22 $138,818 APPLICATIONS WITHDRAWN 5 $154,600 15 $206,400 93 $187,204 11 $140,636 0 $0 5 $138,200 FILES CLOSED FOR INCOMPLETENESS 0 $0 2 $165,500 10 $208,400 0 $0 0 $0 1 $216,000
Aggregated Statistics For Year 2007(Based on 6 full tracts) A) FHA, FSA/RHS & VA B) Conventional C) Refinancings D) Home Improvement Loans E) Loans on Dwellings For 5+ Families F) Non-occupant Loans on G) Loans On Manufactured Number Average Value Number Average Value Number Average Value Number Average Value Number Average Value Number Average Value Number Average Value
LOANS ORIGINATED 33 $198,758 365 $176,422 432 $162,734 177 $57,870 6 $165,000 67 $173,836 1 $34,000 APPLICATIONS APPROVED, NOT ACCEPTED 3 $229,000 48 $195,104 77 $143,494 11 $25,636 0 $0 8 $185,375 2 $211,500 APPLICATIONS DENIED 4 $207,500 59 $171,085 205 $186,298 52 $64,673 1 $440,000 22 $171,364 2 $50,000 APPLICATIONS WITHDRAWN 2 $190,500 21 $186,143 74 $179,919 10 $85,800 3 $340,667 5 $149,200 1 $25,000 FILES CLOSED FOR INCOMPLETENESS 0 $0 4 $169,000 35 $214,429 2 $126,500 0 $0 3 $154,667 0 $0
Aggregated Statistics For Year 2006(Based on 6 full tracts) A) FHA, FSA/RHS & VA B) Conventional C) Refinancings D) Home Improvement Loans E) Loans on Dwellings For 5+ Families F) Non-occupant Loans on G) Loans On Manufactured Number Average Value Number Average Value Number Average Value Number Average Value Number Average Value Number Average Value Number Average Value
LOANS ORIGINATED 35 $205,057 453 $166,603 551 $148,539 216 $46,579 9 $610,667 92 $178,598 0 $0 APPLICATIONS APPROVED, NOT ACCEPTED 1 $241,000 48 $180,396 81 $140,531 17 $39,588 0 $0 15 $148,467 0 $0 APPLICATIONS DENIED 3 $178,333 70 $144,814 262 $170,569 44 $50,295 1 $400,000 16 $233,125 1 $138,000 APPLICATIONS WITHDRAWN 1 $229,000 33 $171,091 201 $155,433 10 $98,000 0 $0 11 $158,818 1 $120,000 FILES CLOSED FOR INCOMPLETENESS 0 $0 1 $35,000 34 $189,588 1 $38,000 1 $461,000 1 $150,000 0 $0
Aggregated Statistics For Year 2005(Based on 6 full tracts) A) FHA, FSA/RHS & VA B) Conventional C) Refinancings D) Home Improvement Loans E) Loans on Dwellings For 5+ Families F) Non-occupant Loans on G) Loans On Manufactured Number Average Value Number Average Value Number Average Value Number Average Value Number Average Value Number Average Value Number Average Value
LOANS ORIGINATED 33 $196,970 587 $169,419 764 $159,071 229 $53,384 3 $702,000 118 $181,195 1 $26,000 APPLICATIONS APPROVED, NOT ACCEPTED 1 $148,000 37 $175,811 77 $149,273 21 $69,286 1 $620,000 10 $282,300 2 $30,500 APPLICATIONS DENIED 3 $190,667 76 $155,671 200 $169,165 46 $65,652 1 $595,000 20 $135,750 4 $98,250 APPLICATIONS WITHDRAWN 2 $197,000 72 $142,375 232 $152,629 22 $164,455 3 $286,000 12 $148,417 1 $20,000 FILES CLOSED FOR INCOMPLETENESS 0 $0 27 $105,037 35 $156,286 2 $26,500 0 $0 2 $170,000 0 $0
Aggregated Statistics For Year 2004(Based on 6 full tracts) A) FHA, FSA/RHS & VA B) Conventional C) Refinancings D) Home Improvement Loans E) Loans on Dwellings For 5+ Families F) Non-occupant Loans on G) Loans On Manufactured Number Average Value Number Average Value Number Average Value Number Average Value Number Average Value Number Average Value Number Average Value
LOANS ORIGINATED 42 $175,619 497 $161,314 847 $138,772 263 $46,730 6 $462,333 106 $158,736 1 $60,000 APPLICATIONS APPROVED, NOT ACCEPTED 3 $203,667 26 $155,577 98 $143,133 21 $57,714 0 $0 10 $146,500 1 $13,000 APPLICATIONS DENIED 2 $165,000 42 $152,214 195 $138,200 33 $70,818 3 $155,667 17 $178,882 0 $0 APPLICATIONS WITHDRAWN 4 $178,750 36 $180,250 243 $133,510 23 $71,696 1 $320,000 9 $183,222 0 $0 FILES CLOSED FOR INCOMPLETENESS 0 $0 3 $150,667 25 $149,800 6 $53,000 0 $0 2 $126,500 0 $0
Aggregated Statistics For Year 2003(Based on 6 full tracts) A) FHA, FSA/RHS & VA B) Conventional C) Refinancings D) Home Improvement Loans E) Loans on Dwellings For 5+ Families F) Non-occupant Loans on Number Average Value Number Average Value Number Average Value Number Average Value Number Average Value Number Average Value
LOANS ORIGINATED 41 $160,634 411 $154,015 1,754 $123,258 238 $41,147 4 $1,402,250 147 $130,293 APPLICATIONS APPROVED, NOT ACCEPTED 2 $148,000 30 $166,867 185 $126,730 10 $44,400 0 $0 15 $158,467 APPLICATIONS DENIED 3 $164,000 40 $173,575 247 $124,126 33 $32,455 0 $0 21 $130,476 APPLICATIONS WITHDRAWN 0 $0 34 $164,853 266 $124,173 6 $27,167 0 $0 14 $148,429 FILES CLOSED FOR INCOMPLETENESS 0 $0 5 $238,800 27 $126,370 1 $77,000 0 $0 1 $266,000
Aggregated Statistics For Year 2002(Based on 6 full tracts) A) FHA, FSA/RHS & VA B) Conventional C) Refinancings D) Home Improvement Loans E) Loans on Dwellings For 5+ Families F) Non-occupant Loans on Number Average Value Number Average Value Number Average Value Number Average Value Number Average Value Number Average Value
LOANS ORIGINATED 51 $138,235 358 $140,053 1,096 $114,194 167 $31,491 7 $310,857 96 $117,875 APPLICATIONS APPROVED, NOT ACCEPTED 7 $133,143 38 $174,316 106 $111,000 12 $32,833 0 $0 13 $117,769 APPLICATIONS DENIED 5 $163,600 31 $136,677 223 $108,924 25 $33,320 2 $392,500 19 $132,421 APPLICATIONS WITHDRAWN 5 $129,400 18 $147,167 170 $112,506 6 $36,500 1 $250,000 4 $129,500 FILES CLOSED FOR INCOMPLETENESS 1 $157,000 5 $148,600 27 $114,370 0 $0 0 $0 0 $0
Aggregated Statistics For Year 2001(Based on 6 full tracts) A) FHA, FSA/RHS & VA B) Conventional C) Refinancings D) Home Improvement Loans E) Loans on Dwellings For 5+ Families F) Non-occupant Loans on Number Average Value Number Average Value Number Average Value Number Average Value Number Average Value Number Average Value
LOANS ORIGINATED 93 $122,430 373 $120,928 816 $106,605 116 $24,853 2 $120,000 71 $106,366 APPLICATIONS APPROVED, NOT ACCEPTED 2 $127,000 30 $130,533 81 $95,988 16 $22,375 0 $0 8 $118,875 APPLICATIONS DENIED 6 $124,833 29 $129,379 157 $101,038 35 $15,229 0 $0 15 $122,733 APPLICATIONS WITHDRAWN 4 $137,000 17 $123,647 133 $107,090 7 $19,857 0 $0 6 $204,167 FILES CLOSED FOR INCOMPLETENESS 0 $0 2 $139,000 30 $94,033 3 $20,000 0 $0 3 $89,000
Aggregated Statistics For Year 2000(Based on 6 full tracts) A) FHA, FSA/RHS & VA B) Conventional C) Refinancings D) Home Improvement Loans E) Loans on Dwellings For 5+ Families F) Non-occupant Loans on Number Average Value Number Average Value Number Average Value Number Average Value Number Average Value Number Average Value
LOANS ORIGINATED 99 $108,919 327 $108,930 208 $78,125 84 $24,429 1 $100,000 49 $90,571 APPLICATIONS APPROVED, NOT ACCEPTED 4 $87,500 25 $105,040 32 $78,312 21 $25,571 0 $0 1 $95,000 APPLICATIONS DENIED 9 $136,111 35 $95,971 105 $55,667 28 $30,679 0 $0 12 $73,333 APPLICATIONS WITHDRAWN 6 $121,000 23 $97,391 99 $71,747 5 $33,800 0 $0 3 $90,667 FILES CLOSED FOR INCOMPLETENESS 0 $0 3 $93,333 17 $81,412 1 $25,000 0 $0 1 $127,000
Aggregated Statistics For Year 1999(Based on 6 full and 1 partial tracts) A) FHA, FSA/RHS & VA B) Conventional C) Refinancings D) Home Improvement Loans E) Loans on Dwellings For 5+ Families F) Non-occupant Loans on Number Average Value Number Average Value Number Average Value Number Average Value Number Average Value Number Average Value
LOANS ORIGINATED 152 $101,459 282 $98,154 350 $80,279 94 $20,203 5 $381,592 46 $81,383 APPLICATIONS APPROVED, NOT ACCEPTED 5 $102,418 21 $94,800 54 $79,045 13 $26,395 0 $0 8 $78,418 APPLICATIONS DENIED 2 $108,035 33 $83,355 123 $64,025 36 $21,297 0 $0 8 $87,908 APPLICATIONS WITHDRAWN 6 $119,593 26 $107,662 111 $74,502 5 $14,792 2 $98,500 7 $130,250 FILES CLOSED FOR INCOMPLETENESS 1 $100,910 3 $160,527 13 $71,618 0 $0 0 $0 1 $64,130
Detailed HMDA statistics for the following Tracts:
0030.00
, 0031.00 , 0032.00 , 0033.00 , 0034.00 , 0035.00
Private Mortgage Insurance Companies Aggregated Statistics For Year 2009(Based on 6 full tracts) A) Conventional B) Refinancings Number Average Value Number Average Value
LOANS ORIGINATED 26 $194,462 24 $200,792 APPLICATIONS APPROVED, NOT ACCEPTED 6 $228,833 12 $197,000 APPLICATIONS DENIED 2 $253,000 10 $285,700 APPLICATIONS WITHDRAWN 1 $189,000 1 $243,000 FILES CLOSED FOR INCOMPLETENESS 0 $0 1 $153,000
Aggregated Statistics For Year 2008(Based on 6 full tracts) A) Conventional B) Refinancings C) Non-occupant Loans on Number Average Value Number Average Value Number Average Value
LOANS ORIGINATED 64 $190,641 40 $229,850 6 $227,833 APPLICATIONS APPROVED, NOT ACCEPTED 23 $200,739 14 $248,071 3 $293,333 APPLICATIONS DENIED 11 $212,364 1 $200,000 2 $324,500 APPLICATIONS WITHDRAWN 7 $173,143 0 $0 0 $0 FILES CLOSED FOR INCOMPLETENESS 4 $180,250 0 $0 0 $0
Aggregated Statistics For Year 2007(Based on 6 full tracts) A) Conventional B) Refinancings C) Non-occupant Loans on Number Average Value Number Average Value Number Average Value
LOANS ORIGINATED 105 $199,638 48 $230,708 7 $172,714 APPLICATIONS APPROVED, NOT ACCEPTED 10 $184,700 10 $203,300 1 $351,000 APPLICATIONS DENIED 0 $0 1 $172,000 1 $172,000 APPLICATIONS WITHDRAWN 5 $166,400 4 $230,000 0 $0 FILES CLOSED FOR INCOMPLETENESS 0 $0 0 $0 0 $0
Aggregated Statistics For Year 2006(Based on 6 full tracts) A) Conventional B) Refinancings C) Non-occupant Loans on Number Average Value Number Average Value Number Average Value
LOANS ORIGINATED 83 $207,699 19 $207,158 6 $227,500 APPLICATIONS APPROVED, NOT ACCEPTED 9 $275,444 6 $179,333 0 $0 APPLICATIONS DENIED 0 $0 0 $0 0 $0 APPLICATIONS WITHDRAWN 0 $0 0 $0 0 $0 FILES CLOSED FOR INCOMPLETENESS 1 $162,000 0 $0 0 $0
Aggregated Statistics For Year 2005(Based on 6 full tracts) A) Conventional B) Refinancings C) Non-occupant Loans on Number Average Value Number Average Value Number Average Value
LOANS ORIGINATED 79 $205,038 21 $211,143 7 $168,714 APPLICATIONS APPROVED, NOT ACCEPTED 9 $203,778 8 $173,500 2 $161,500 APPLICATIONS DENIED 3 $205,667 0 $0 1 $198,000 APPLICATIONS WITHDRAWN 2 $216,500 0 $0 0 $0 FILES CLOSED FOR INCOMPLETENESS 0 $0 0 $0 0 $0
Aggregated Statistics For Year 2004(Based on 6 full tracts) A) Conventional B) Refinancings C) Non-occupant Loans on Number Average Value Number Average Value Number Average Value
LOANS ORIGINATED 103 $182,680 33 $179,000 8 $173,500 APPLICATIONS APPROVED, NOT ACCEPTED 13 $172,154 9 $164,778 2 $140,000 APPLICATIONS DENIED 4 $194,750 0 $0 0 $0 APPLICATIONS WITHDRAWN 3 $132,333 4 $199,750 2 $157,500 FILES CLOSED FOR INCOMPLETENESS 0 $0 2 $216,500 0 $0
Aggregated Statistics For Year 2003(Based on 6 full tracts) A) Conventional B) Refinancings C) Non-occupant Loans on Number Average Value Number Average Value Number Average Value
LOANS ORIGINATED 131 $164,947 73 $147,904 13 $131,923 APPLICATIONS APPROVED, NOT ACCEPTED 13 $175,462 11 $174,909 2 $216,000 APPLICATIONS DENIED 3 $165,333 2 $148,500 1 $113,000 APPLICATIONS WITHDRAWN 6 $165,000 7 $130,429 1 $123,000 FILES CLOSED FOR INCOMPLETENESS 0 $0 1 $158,000 0 $0
Aggregated Statistics For Year 2002(Based on 6 full tracts) A) Conventional B) Refinancings C) Non-occupant Loans on Number Average Value Number Average Value Number Average Value
LOANS ORIGINATED 115 $147,896 53 $140,340 5 $137,000 APPLICATIONS APPROVED, NOT ACCEPTED 21 $160,905 18 $152,667 3 $156,333 APPLICATIONS DENIED 2 $137,500 1 $172,000 0 $0 APPLICATIONS WITHDRAWN 1 $176,000 3 $139,667 0 $0 FILES CLOSED FOR INCOMPLETENESS 0 $0 0 $0 0 $0
Aggregated Statistics For Year 2001(Based on 6 full tracts) A) Conventional B) Refinancings C) Non-occupant Loans on Number Average Value Number Average Value Number Average Value
LOANS ORIGINATED 140 $127,329 57 $132,298 7 $126,286 APPLICATIONS APPROVED, NOT ACCEPTED 19 $138,632 11 $158,636 1 $146,000 APPLICATIONS DENIED 3 $130,667 3 $98,333 1 $146,000 APPLICATIONS WITHDRAWN 1 $77,000 0 $0 0 $0 FILES CLOSED FOR INCOMPLETENESS 1 $119,000 0 $0 0 $0
Aggregated Statistics For Year 2000(Based on 6 full tracts) A) Conventional B) Refinancings C) Non-occupant Loans on Number Average Value Number Average Value Number Average Value
LOANS ORIGINATED 125 $112,544 19 $120,105 8 $97,375 APPLICATIONS APPROVED, NOT ACCEPTED 6 $128,167 2 $114,500 1 $131,000 APPLICATIONS DENIED 11 $115,818 0 $0 0 $0 APPLICATIONS WITHDRAWN 3 $183,000 2 $116,500 0 $0 FILES CLOSED FOR INCOMPLETENESS 0 $0 0 $0 0 $0
Aggregated Statistics For Year 1999(Based on 6 full and 1 partial tracts) A) Conventional B) Refinancings C) Non-occupant Loans on Number Average Value Number Average Value Number Average Value
LOANS ORIGINATED 118 $112,962 44 $100,824 7 $82,700 APPLICATIONS APPROVED, NOT ACCEPTED 11 $116,225 10 $118,639 1 $193,370 APPLICATIONS DENIED 6 $83,363 1 $102,530 2 $86,930 APPLICATIONS WITHDRAWN 1 $107,580 0 $0 0 $0 FILES CLOSED FOR INCOMPLETENESS 0 $0 0 $0 0 $0
Detailed PMIC statistics for the following Tracts:
0030.00
, 0031.00 , 0032.00 , 0033.00 , 0034.00 , 0035.00 Fire-safe hotels and motels in South Portland, Maine:
Econo Lodge South Portland, 80 John Roberts Rd, South Portland, Maine 04106 Phone: (207) 772-3838, Fax: (207) 772-4238
Marriott Hotel, 200 Sable Oaks Dr, South Portland, Maine 04106 Phone: (207) 871-8000, Fax: (207) 871-7971
Comfort Inn, 90 Maine Mall Rd, South Portland, Maine 04106 Phone: (207) 775-0409, Fax: (207) 775-1755
Best Western Merry Manor Inn, 700 Main St, South Portland, Maine 04106 Phone: (207) 774-6151, Fax: (207) 871-0537
Holiday Inn Express Hotel And Suites, 303 Sable Oaks Dr, South Portland, Maine 04106 Phone: (207) 775-3900, Fax: (207) 775-3993
Doubletree By Hilton, 363 Maine Mall Rd, South Portland, Maine 04106 Phone: (207) 775-6161, Fax: (207) 756-6622
Homewood Suites By Hilton, 200 Southborough Dr, South Portland, Maine 04106 Phone: (207) 775-2700, Fax: (207) 775-3103
Courtyard By Marriott Portland Airport, 100 Southborough Dr, South Portland, Maine 04106 Phone: (207) 253-5005, Fax: (207) 253-5099
5 other hotels and motels
All 13 fire-safe hotels and motels in South Portland, Maine
Most common first names in South Portland, ME among deceased individuals Name Count Lived (average)
Mary 222 79.4 years John 212 76.0 years William 142 75.1 years Robert 122 71.6 years Margaret 121 79.3 years Charles 119 75.3 years James 117 71.8 years George 111 76.1 years Dorothy 104 77.9 years Helen 93 80.3 years
Most common last names in South Portland, ME among deceased individuals Last name Count Lived (average)
Smith 65 77.8 years Brown 54 76.1 years Davis 53 77.2 years Johnson 42 81.0 years Anderson 38 78.0 years Libby 37 76.2 years Jordan 36 79.8 years Murphy 35 76.1 years Thompson 30 79.9 years Adams 29 73.7 years
South Portland compared to Maine state average:
Unemployed percentage significantly below state average. Black race population percentage significantly above state average. Foreign-born population percentage significantly above state average. Length of stay since moving in significantly above state average. Percentage of population with a bachelor's degree or higher above state average. South Portland on our top lists :
#12 on the list of "Top 101 cities with the biggest property tax revenues per resident (population 10,000+)"
#22 on the list of "Top 101 cities with the largest percentage of likely lesbian couples (counted as self-reported female-female unmarried-partner households) (population 5,000+)"
#53 on the list of "Top 101 cities with the largest percentage of people in military ships (population 1,000+)"
#70 on the list of "Top 101 cities with the largest percentage of people in training schools for juvenile delinquents (population 1,000+)"
#73 on the list of "Top 101 cities with the largest percentage of likely homosexual households (counted as self-reported same-sex unmarried-partner households) (population 5,000+)"
#28 on the list of "Top 101 counties with the highest percentage of residents that exercised in the past month"
#30 on the list of "Top 101 counties with the best general health status score of residents (1-5), 3 years of data"
#40 on the list of "Top 101 counties with the highest percentage of residents that visited a dentist within the past year"
#43 on the list of "Top 101 counties with the highest Nitrogen Dioxide air pollution readings in 2012 (ppm)"
#49 on the list of "Top 101 counties with the lowest number of births per 1000 residents 2007-2013"
Top Patent Applicants
David Allen Elsemore (18)
Robert Yaw Gyamfi Andoh (9)
Marlies Betka (4)
Manikandan Sasidharan (4)
Charles H. Warner (4)
Tony Cheng Han Lee (3)
Stephen Martin (3)
Kwabena Osei (3)
Christopher S. Hersey (3)
Volkhard Lindner (3)
Total of 102 patent applications in 2008-2024.
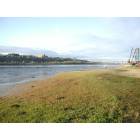


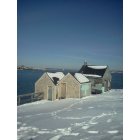


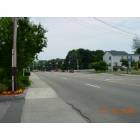
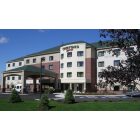

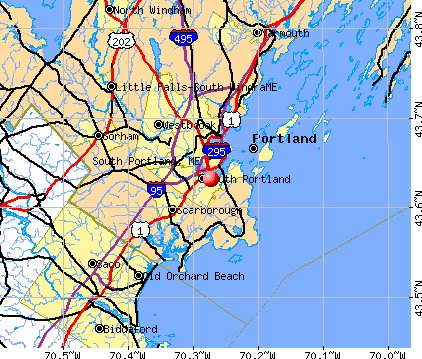


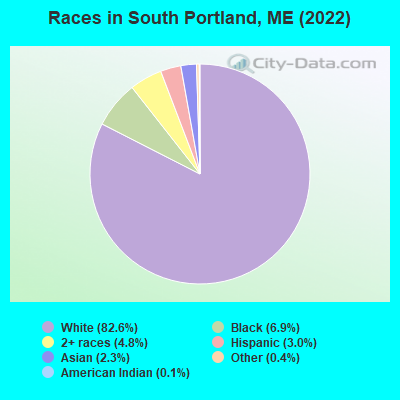
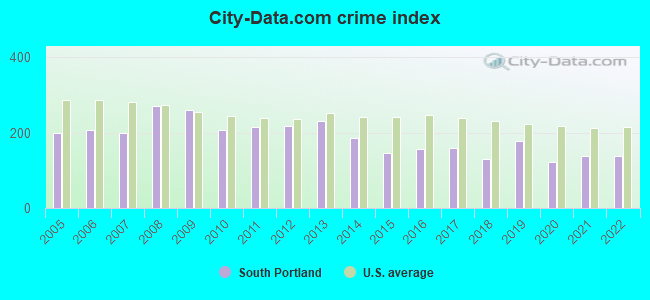
 Recent articles from our blog. Our writers, many of them Ph.D. graduates or candidates, create easy-to-read articles on a wide variety of topics.

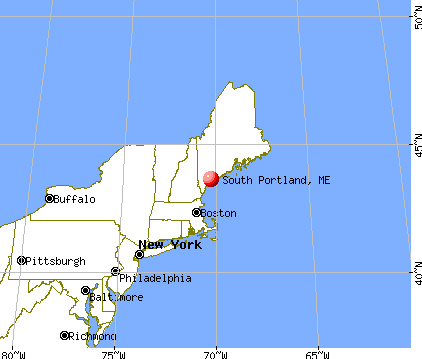
 (2.3 miles
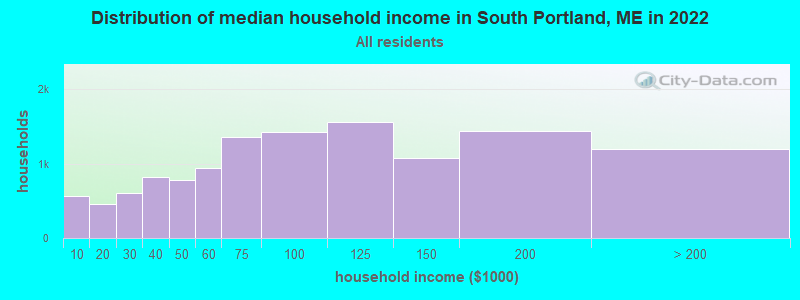
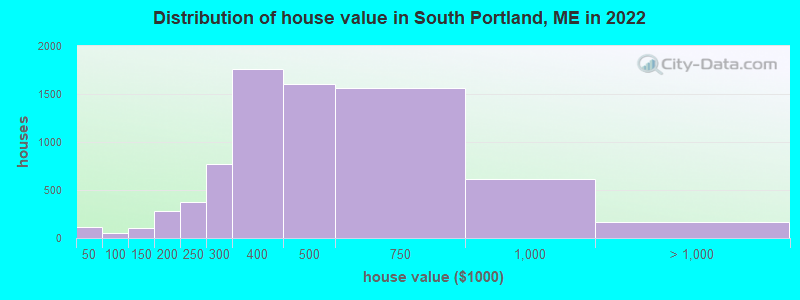
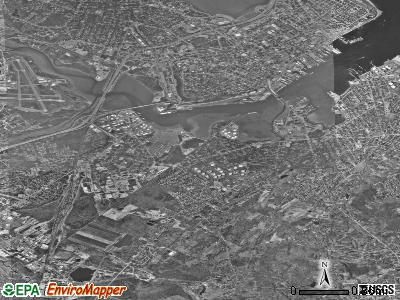
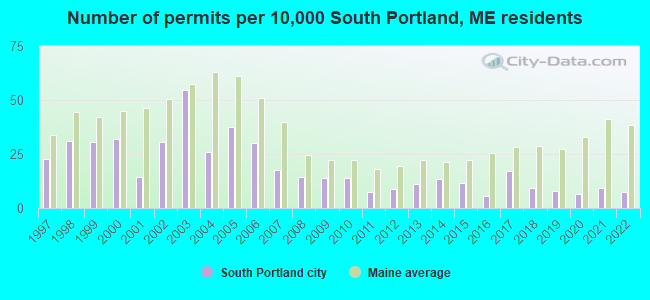
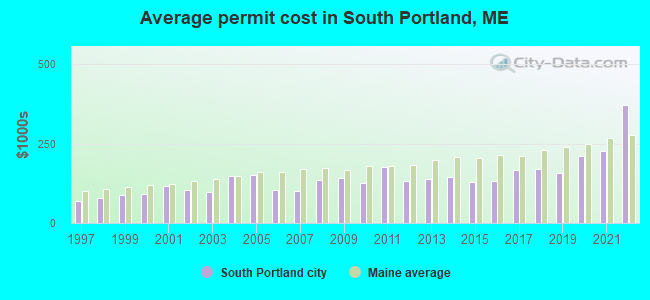
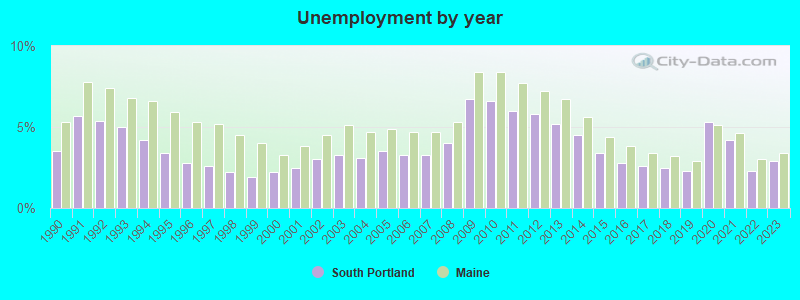
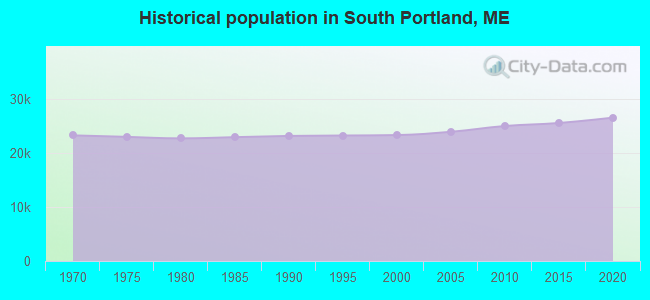
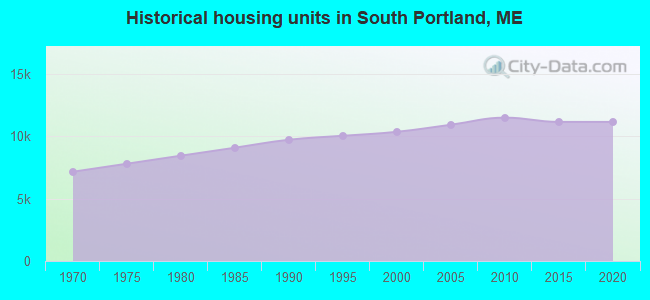
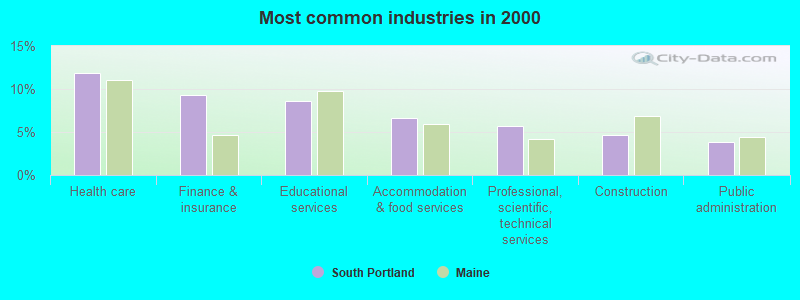
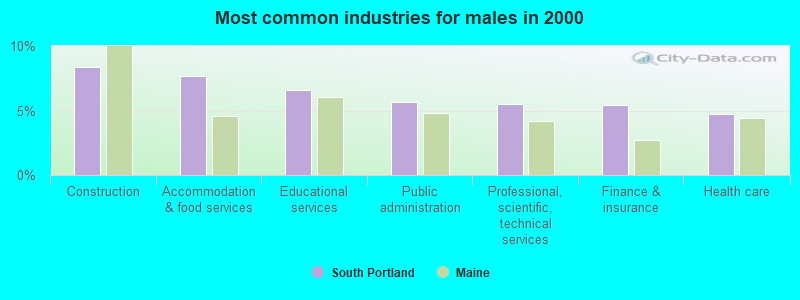
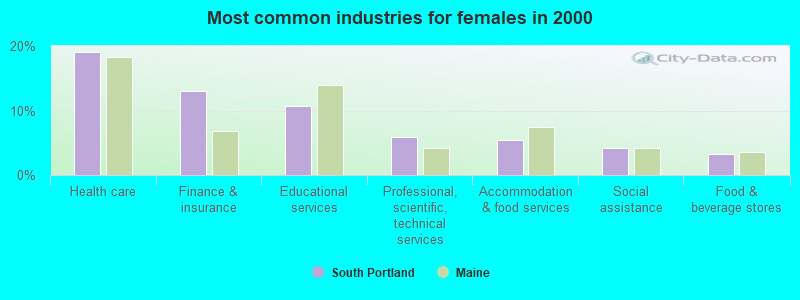
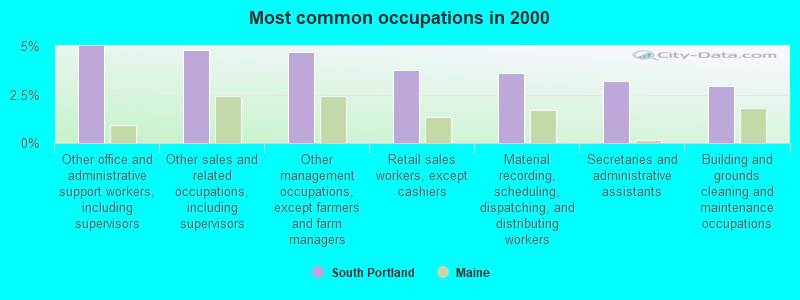
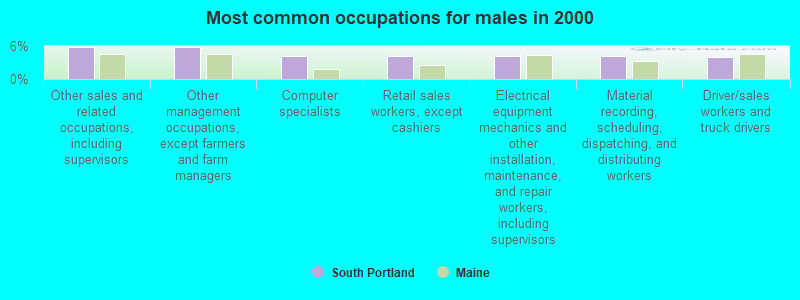
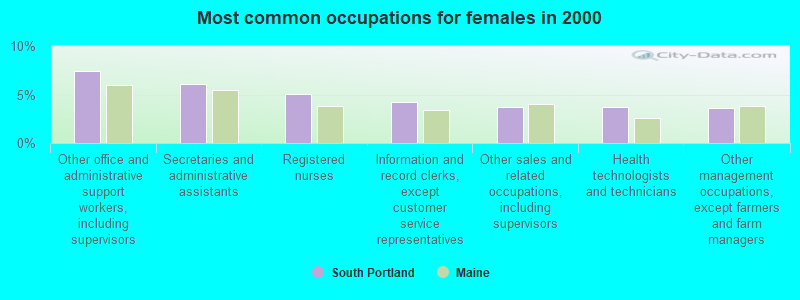
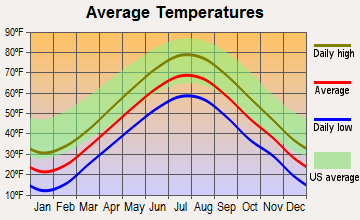
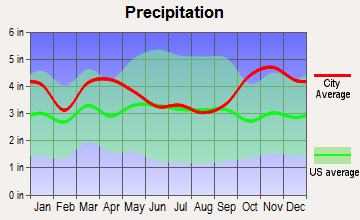
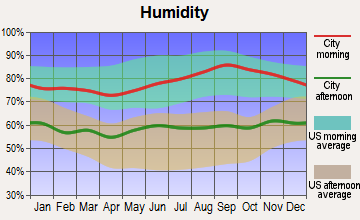
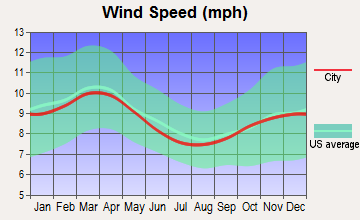
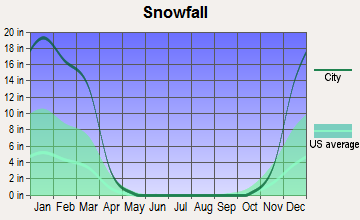
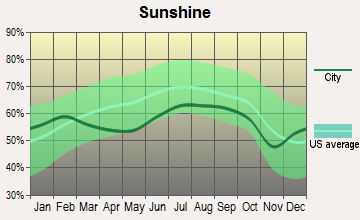
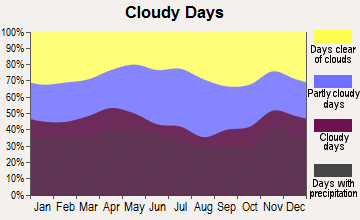


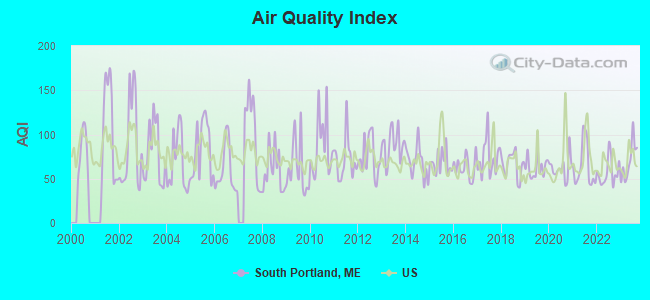
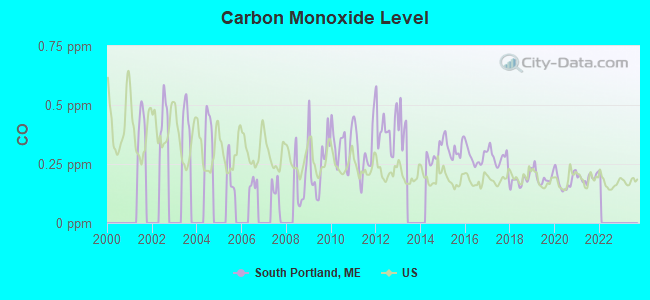
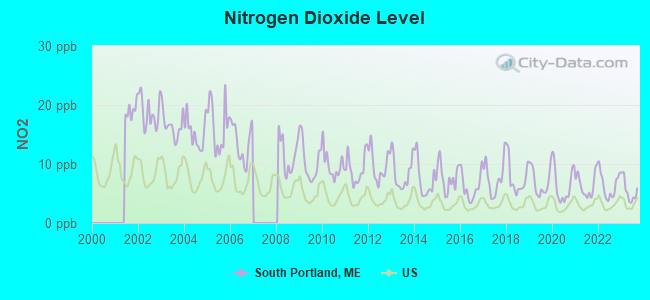
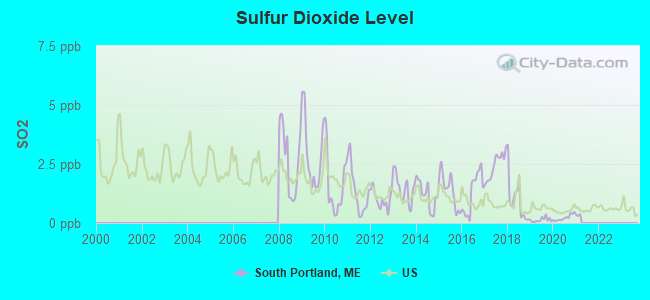
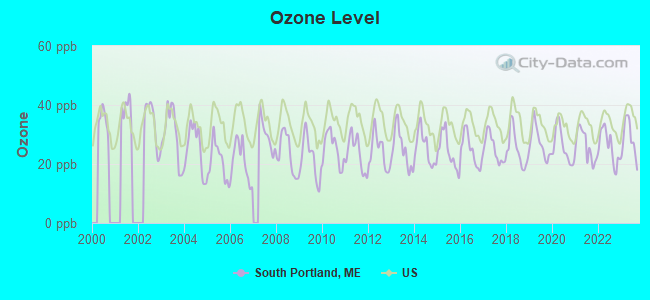
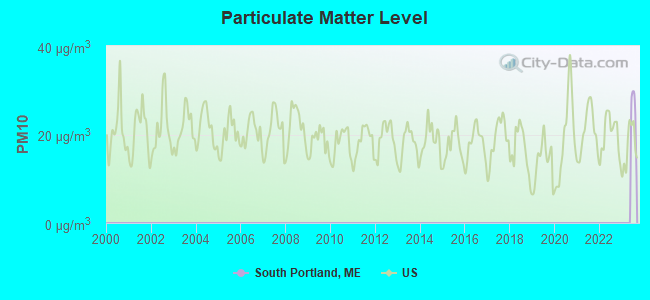
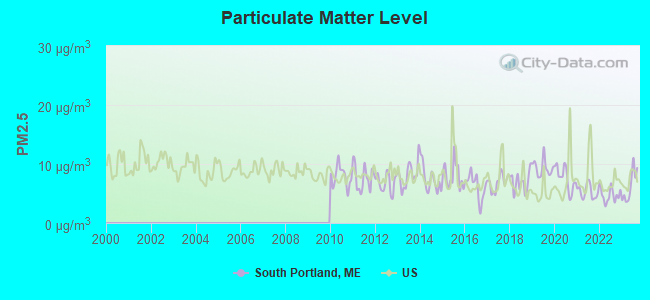

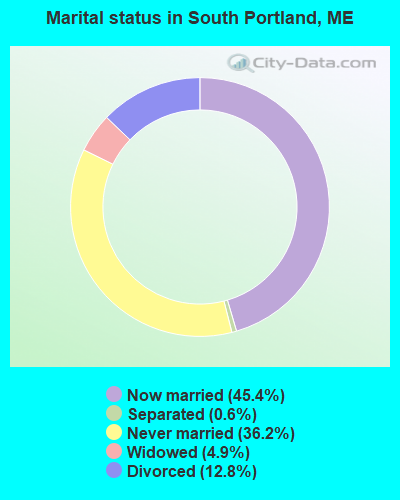
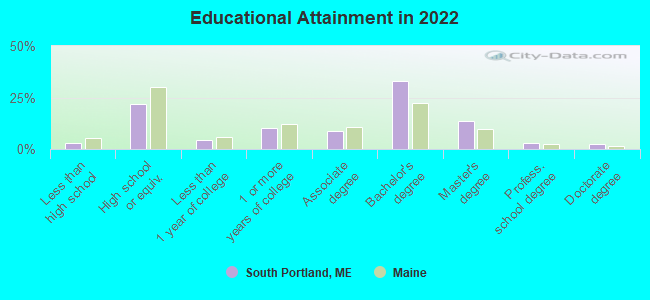
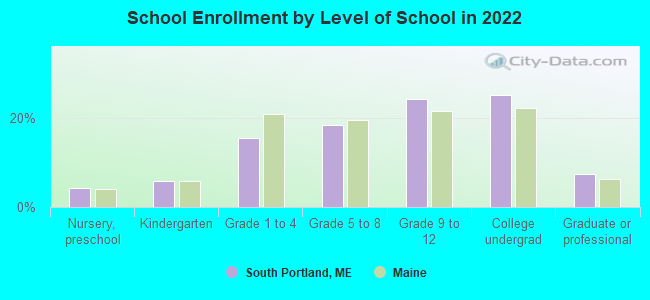
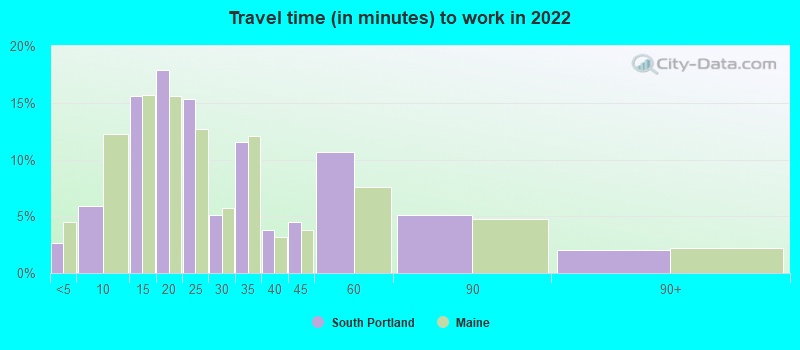
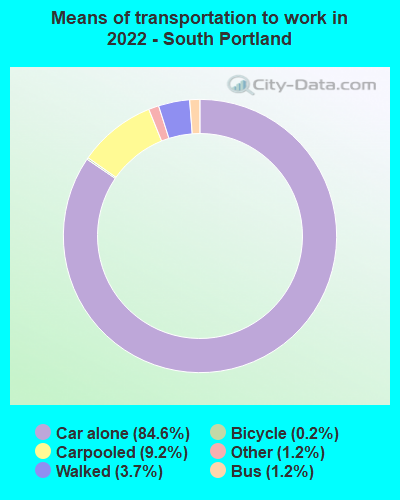
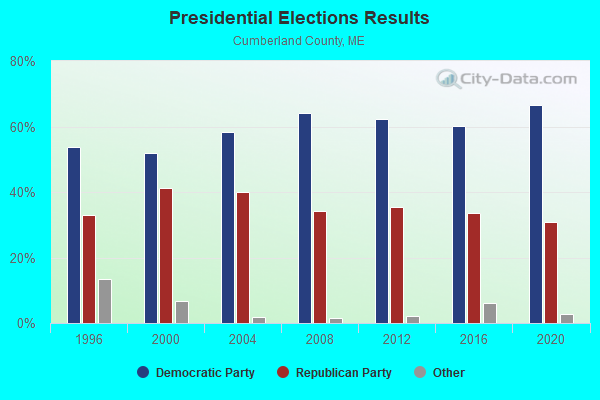
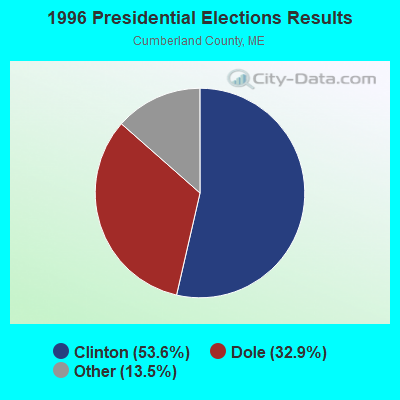
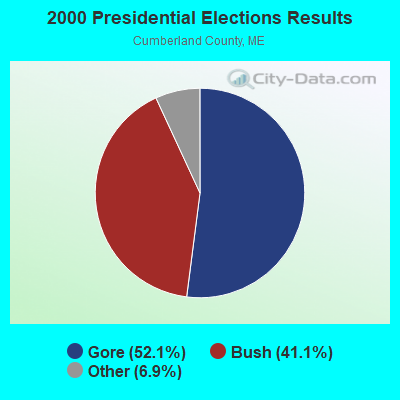
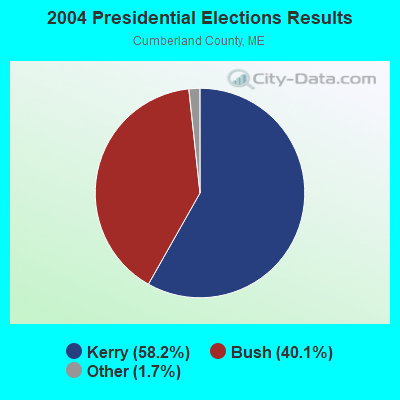
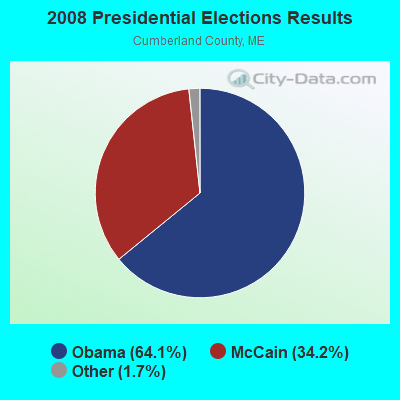
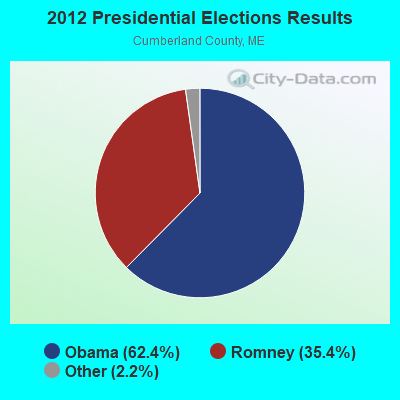
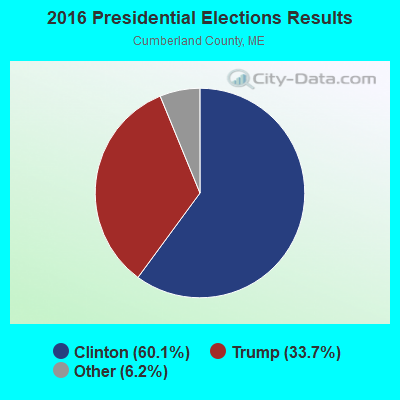
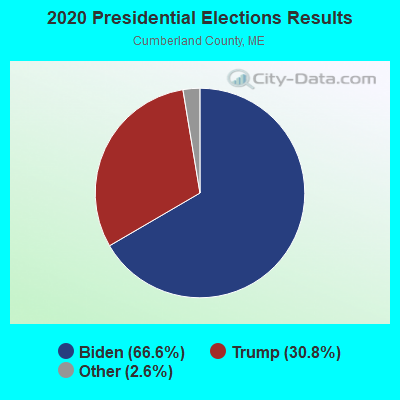
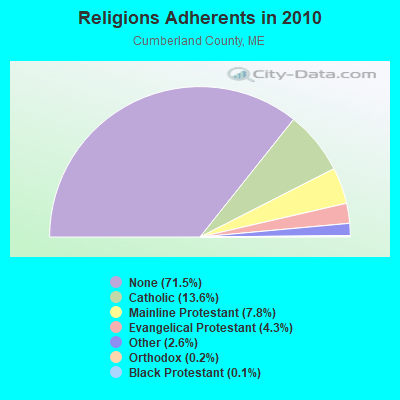
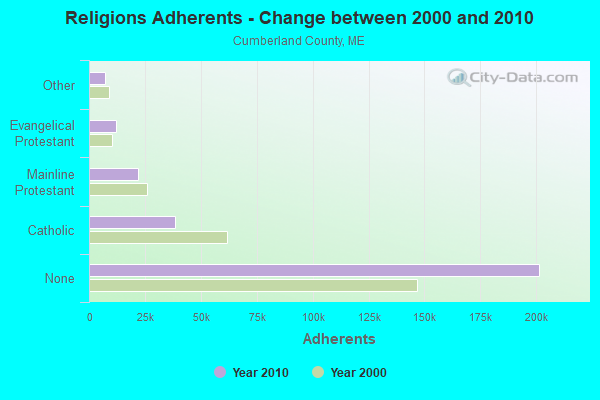
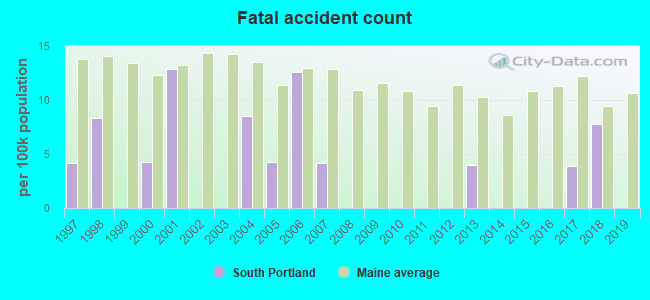
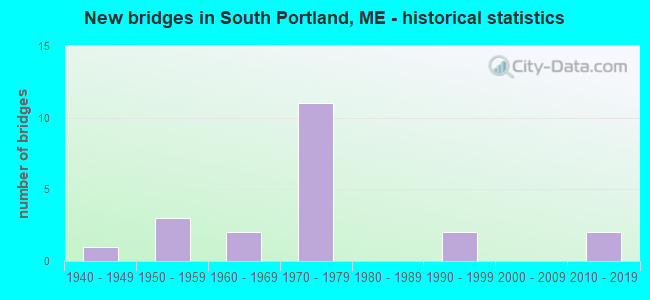
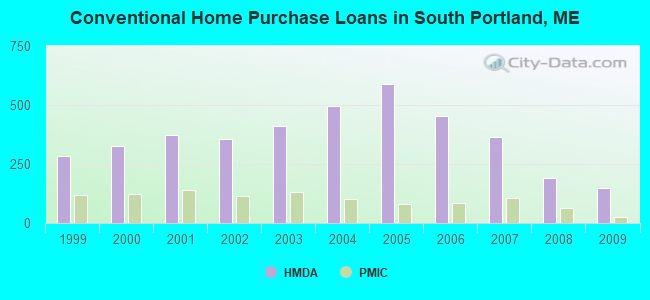
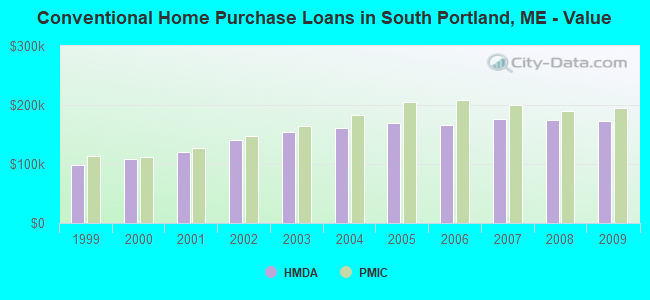
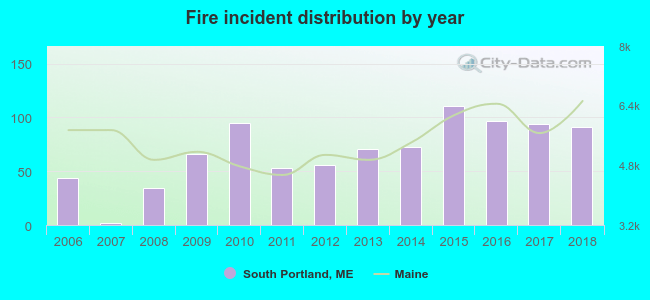 Based on the data from the years 2006 - 2018 the average number of fire incidents per year is 68. The highest number of reported fire incidents - 111 took place in 2015, and the least - 2 in 2007. The data has a growing trend.
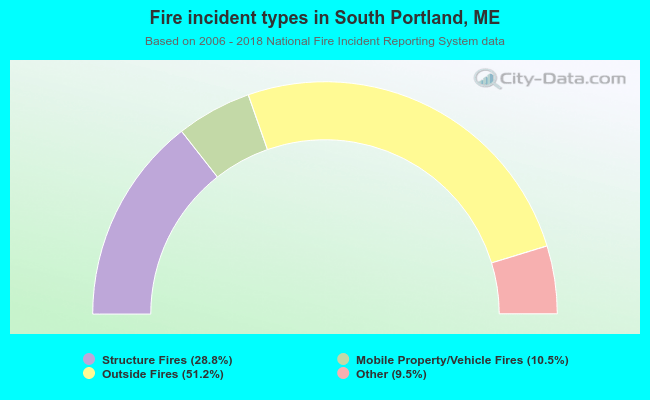 When looking into fire subcategories, the most reports belonged to: Outside Fires (51.2%), and Structure Fires (28.8%).