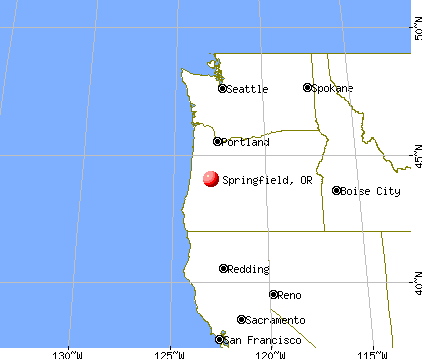
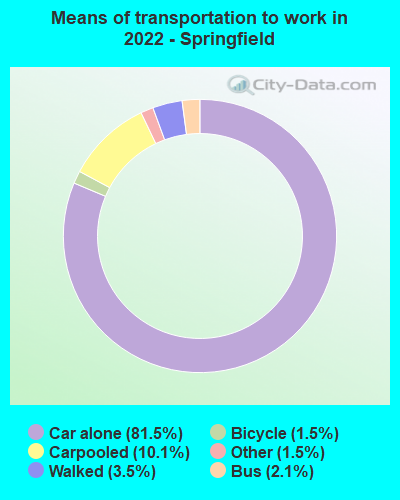
Springfield, Oregon

Springfield: The McKenzie in East Springfield....
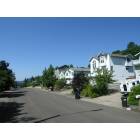
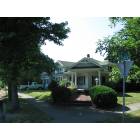
Springfield: Homes on Kelly Butte, Springfield OR

Springfield: Jasper Bridge,Springfield OR
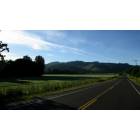
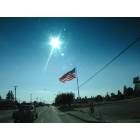
Springfield: Marcola Road,Springfield OR
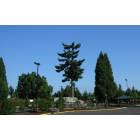
Springfield: Trees.....
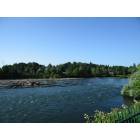
Springfield: Willamette River at Springfield OR
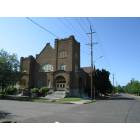
Springfield: Church, Springfield OR
Springfield: 8th & C Streets, Springfield OR
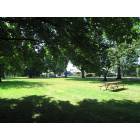
Springfield: Willamalane Park, Springfield OR

Springfield: McKenzie River Bridge from Glenwood to Springfield
Springfield: Main St, 4th of July, Springfield OR
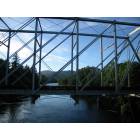
Springfield: Railroad Bridge, McKenzie River,Springfield OR
- add
your
Submit your own pictures of this city and show them to the world
- OSM Map
- General Map
- Google Map
- MSN Map
Population change since 2000: +16.1%
 |
| Males: 31,173 | |
| Females: 30,227 |
| Median resident age: | 37.9 years |
| Oregon median age: | 40.5 years |
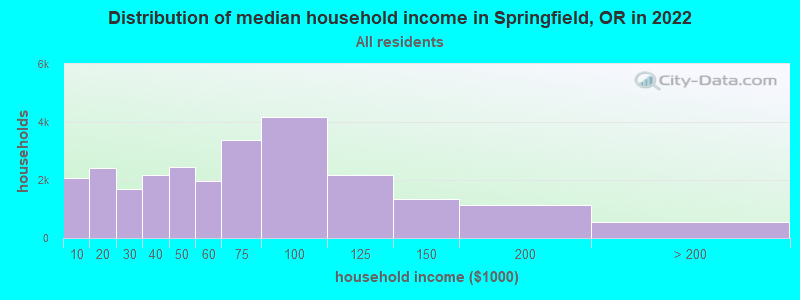
| Springfield: | $59,964 |
| OR: | $75,657 |
Estimated per capita income in 2022: $28,504 (it was $15,616 in 2000)
Springfield city income, earnings, and wages data
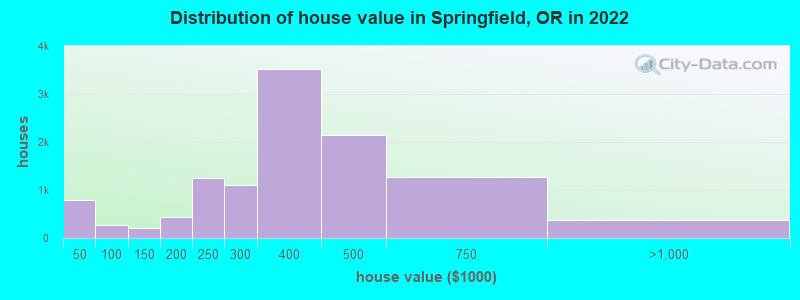
Estimated median house or condo value in 2022: $349,535 (it was $111,700 in 2000)
| Springfield: | $349,535 |
| OR: | $475,600 |
Mean prices in 2022: all housing units: $346,573; detached houses: $375,691; townhouses or other attached units: $326,012; in 2-unit structures: $398,047; in 3-to-4-unit structures: $221,703; in 5-or-more-unit structures: $320,254; mobile homes: $92,030; occupied boats, rvs, vans, etc.: $8,279
Median gross rent in 2022: $1,158.
(15.9% for White Non-Hispanic residents, 24.3% for Black residents, 19.4% for Hispanic or Latino residents, 11.7% for American Indian residents, 14.6% for other race residents, 19.0% for two or more races residents)
Detailed information about poverty and poor residents in Springfield, OR

Compare current foreclosures in Springfield, OR:
| Photo | Address | Area | Beds / Baths | Price | Details |
|---|---|---|---|---|---|

|
#1
57th St
Springfield, OR 97478
|
876 sq. feet
|
1 baths 3 beds |
show details | |

|
#2
Mckenzie Hwy
Springfield, OR 97478
|
1,900 sq. feet
|
2 baths 3 beds |
show details | |

|
#3
D St
Springfield, OR 97478
|
960 sq. feet
|
1 baths 3 beds |
show details | |

|
#4
S Redwood Dr
Springfield, OR 97478
|
2,148 sq. feet
|
2 baths 4 beds |
show details | |

|
#5
75th St
Springfield, OR 97478
|
2,172 sq. feet
|
3 baths 4 beds |
show details | |

|
#6
S 44th St
Springfield, OR 97478
|
1,184 sq. feet
|
2 baths 3 beds |
show details | |

|
#7
Jules Pl
Springfield, OR 97478
|
1,156 sq. feet
|
2 baths 3 beds |
show details | |

|
#8
55th St
Springfield, OR 97478
|
1,092 sq. feet
|
2 baths 3 beds |
show details | |

|
#9
C St
Springfield, OR 97478
|
1,350 sq. feet
|
2 baths 3 beds |
show details | |

|
#10
72nd St
Springfield, OR 97478
|
2,239 sq. feet
|
2 baths 4 beds |
show details |
| Photo | Address | Area | Beds / Baths | Price | Details |
|---|---|---|---|---|---|

|
#11
37th St
Springfield, OR 97477
|
1,285 sq. feet
|
2 baths 3 beds |
show details | |

|
#12
16th St
Springfield, OR 97477
|
1,230 sq. feet
|
2 baths 3 beds |
show details | |

|
#13
Stephens Rd
Springfield, OR 97478
|
1,568 sq. feet
|
1 baths 2 beds |
show details | |

|
#14
E St
Springfield, OR 97478
|
1,892 sq. feet
|
2 baths 4 beds |
show details | |

|
#15
16th St
Springfield, OR 97477
|
1,296 sq. feet
|
1 baths 2 beds |
show details | |

|
#16
Mckenzie Hwy
Springfield, OR 97478
|
2,208 sq. feet
|
2 baths 3 beds |
show details | |

|
#17
67th Pl
Springfield, OR 97478
|
1,152 sq. feet
|
1 baths 3 beds |
show details | |

|
#18
E St
Springfield, OR 97477
|
1,163 sq. feet
|
1 baths 3 beds |
show details | |

|
#19
72nd St
Springfield, OR 97478
|
1,496 sq. feet
|
1 baths 3 beds |
show details | |

|
#20
S 70th St
Springfield, OR 97478
|
1,365 sq. feet
|
1 baths 4 beds |
show details |
| Photo | Address | Area | Beds / Baths | Price | Details |
|---|---|---|---|---|---|

|
#21
A St
Springfield, OR 97478
|
1,950 sq. feet
|
2 baths 4 beds |
show details | |

|
#22
Hamilton St
Springfield, OR 97477
|
1,170 sq. feet
|
2 baths 3 beds |
show details | |

|
#23
Lawnridge Ave
Springfield, OR 97477
|
1,530 sq. feet
|
2 baths 3 beds |
show details | |

|
#24
Camellia St
Springfield, OR 97478
|
1,216 sq. feet
|
1 baths 2 beds |
show details | |

|
#25
Viewmont Ave
Springfield, OR 97477
|
1,547 sq. feet
|
2 baths 3 beds |
show details | |

|
#26
Glacier Dr
Springfield, OR 97478
|
1,975 sq. feet
|
2 baths 3 beds |
show details | |

|
#27
D St
Springfield, OR 97477
|
2,816 sq. feet
|
3 baths 7 beds |
show details | |

|
#28
4th St
Springfield, OR 97477
|
1,454 sq. feet
|
1 baths 3 beds |
show details | |

|
#29
Oakdale Ave
Springfield, OR 97477
|
4,389 sq. feet
|
6 baths 6 beds |
show details | |

|
#30
Mckenzie Hwy
Springfield, OR 97478
|
1,639 sq. feet
|
1 baths 4 beds |
show details |
| Photo | Address | Area | Beds / Baths | Price | Details |
|---|---|---|---|---|---|

|
#31
6th St
Springfield, OR 97477
|
1,024 sq. feet
|
1 baths 2 beds |
show details | |

|
#32
33rd St
Springfield, OR 97478
|
1,149 sq. feet
|
1 baths 3 beds |
show details | |

|
#33
54th St
Springfield, OR 97478
|
2,472 sq. feet
|
1 baths 5 beds |
show details | |

|
#34
Simeon Dr
Springfield, OR 97478
|
1,488 sq. feet
|
2 baths 3 beds |
show details | |

|
#35
Jasper Rd
Springfield, OR 97478
|
1,136 sq. feet
|
1 baths 1 beds |
show details | |

|
#36
D St
Springfield, OR 97478
|
1,344 sq. feet
|
1 baths 3 beds |
show details | |

|
#37
55th St
Springfield, OR 97478
|
1,076 sq. feet
|
1 baths 3 beds |
show details | |

|
#38
T St
Springfield, OR 97477
|
1,328 sq. feet
|
2 baths 3 beds |
show details | |

|
#39
A St
Springfield, OR 97478
|
732 sq. feet
|
1 baths 2 beds |
show details | |

|
#40
F St
Springfield, OR 97477
|
1,124 sq. feet
|
1 baths 4 beds |
show details |
| Photo | Address | Area | Beds / Baths | Price | Details |
|---|---|---|---|---|---|

|
#41
21st St
Springfield, OR 97477
|
2,438 sq. feet
|
2 baths 4 beds |
show details | |

|
#42
B St
Springfield, OR 97478
|
1,218 sq. feet
|
2 baths 3 beds |
show details | |

|
#43
52nd Pl
Springfield, OR 97478
|
984 sq. feet
|
1 baths 3 beds |
show details | |

|
#44
Camellia St
Springfield, OR 97478
|
1,256 sq. feet
|
2 baths 3 beds |
show details | |

|
#45
Osage St
Springfield, OR 97478
|
2,016 sq. feet
|
2 baths 4 beds |
show details | |

|
#46
S 41st St
Springfield, OR 97478
|
1,695 sq. feet
|
2 baths 3 beds |
show details | |

|
#47
19th St
Springfield, OR 97477
|
880 sq. feet
|
1 baths 2 beds |
show details | |

|
#48
Tamarack St
Springfield, OR 97477
|
1,465 sq. feet
|
1 baths 3 beds |
show details | |

|
#49
N St
Springfield, OR 97477
|
1,374 sq. feet
|
1 baths 4 beds |
show details | |

|
Check over 1 million property listings on Foreclosure.com!
|
browse all offers | |||


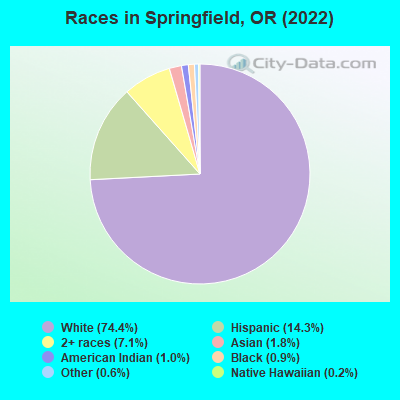
- 45,92474.4%White alone
- 8,85514.3%Hispanic
- 4,3957.1%Two or more races
- 1,0971.8%Asian alone
- 6411.0%American Indian alone
- 5270.9%Black alone
- 3820.6%Other race alone
- 1270.2%Native Hawaiian and Other
Pacific Islander alone
Races in Springfield detailed stats: ancestries, foreign born residents, place of birth
According to our research of Oregon and other state lists, there were 31 registered sex offenders living in Springfield, Oregon as of April 27, 2024.
The ratio of all residents to sex offenders in Springfield is 2,005 to 1.
The ratio of registered sex offenders to all residents in this city is near the state average.
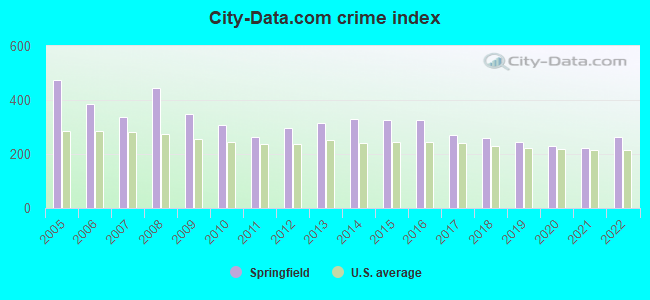
The City-Data.com crime index weighs serious crimes and violent crimes more heavily. Higher means more crime, U.S. average is 246.1. It adjusts for the number of visitors and daily workers commuting into cities.
- means the value is smaller than the state average.- means the value is about the same as the state average.
- means the value is bigger than the state average.
- means the value is much bigger than the state average.
Crime rate in Springfield detailed stats: murders, rapes, robberies, assaults, burglaries, thefts, arson
Full-time law enforcement employees in 2021, including police officers: 86 (56 officers - 49 male; 7 female).
| Officers per 1,000 residents here: | 0.88 |
| Oregon average: | 1.48 |
 Recent articles from our blog. Our writers, many of them Ph.D. graduates or candidates, create easy-to-read articles on a wide variety of topics.

 | Best Eugene/Springfield high school for an artsy junior moving from out of state? (4 replies) |
| Another considering Eugene post, TIA (23 replies) |
| Im thinking of retiring in Eugene/Springfield (23 replies) |
| Eugene & Springfield are often labeled "Silicon Shire", is it really a High Tech Sector? (4 replies) |
| Springfield Area (10 replies) |
| Crime and being seniors (92 replies) |
Latest news from Springfield, OR collected exclusively by city-data.com from local newspapers, TV, and radio stations
Ancestries: German (9.3%), English (8.7%), Irish (8.7%), American (8.2%), European (5.2%), Italian (2.3%).
Current Local Time: PST time zone
Incorporated in 1885
Elevation: 456 feet
Land area: 14.4 square miles.
Population density: 4,263 people per square mile (average).
3,724 residents are foreign born (3.7% Latin America, 1.0% Asia, 0.7% Europe).
| This city: | 6.0% |
| Oregon: | 9.8% |
Median real estate property taxes paid for housing units with mortgages in 2022: $3,122 (0.8%)
Median real estate property taxes paid for housing units with no mortgage in 2022: $2,881 (1.0%)
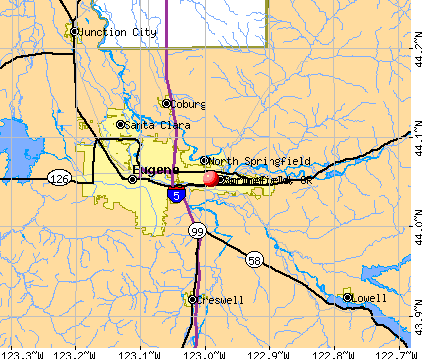
Nearest city with pop. 200,000+: Northwest Clackamas, OR (94.7 miles  , pop. 224,220).
Nearest city with pop. 1,000,000+: Los Angeles, CA (732.3 miles , pop. 3,694,820).
Nearest cities:
Latitude: 44.05 N, Longitude: 122.99 W
Daytime population change due to commuting: +3,070 (+5.0%)
Workers who live and work in this city: 13,722 (43.3%)
Area code commonly used in this area: 541

Springfield tourist attractions:
Springfield, Oregon accommodation & food services, waste management - Economy and Business Data
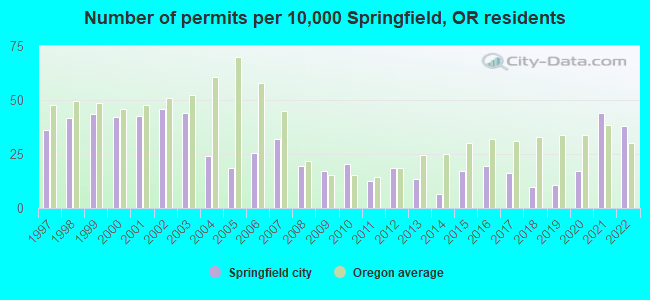
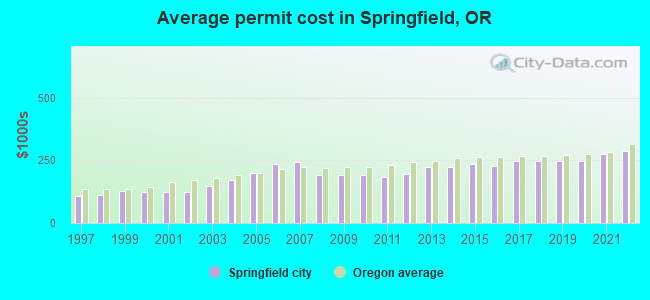
Single-family new house construction building permits:
- 2022: 201 buildings, average cost: $286,200
- 2021: 233 buildings, average cost: $274,300
- 2020: 90 buildings, average cost: $246,600
- 2019: 57 buildings, average cost: $245,500
- 2018: 51 buildings, average cost: $247,300
- 2017: 86 buildings, average cost: $245,800
- 2016: 104 buildings, average cost: $228,100
- 2015: 91 buildings, average cost: $234,300
- 2014: 35 buildings, average cost: $222,500
- 2013: 72 buildings, average cost: $224,600
- 2012: 99 buildings, average cost: $193,500
- 2011: 65 buildings, average cost: $182,100
- 2010: 108 buildings, average cost: $191,300
- 2009: 90 buildings, average cost: $191,300
- 2008: 102 buildings, average cost: $192,500
- 2007: 170 buildings, average cost: $244,100
- 2006: 134 buildings, average cost: $234,600
- 2005: 98 buildings, average cost: $198,700
- 2004: 128 buildings, average cost: $172,900
- 2003: 232 buildings, average cost: $146,600
- 2002: 243 buildings, average cost: $124,300
- 2001: 225 buildings, average cost: $124,500
- 2000: 222 buildings, average cost: $123,500
- 1999: 230 buildings, average cost: $127,400
- 1998: 221 buildings, average cost: $111,000
- 1997: 192 buildings, average cost: $106,400
| Here: | 4.3% |
| Oregon: | 3.9% |

Population change in the 1990s: +7,886 (+17.5%).
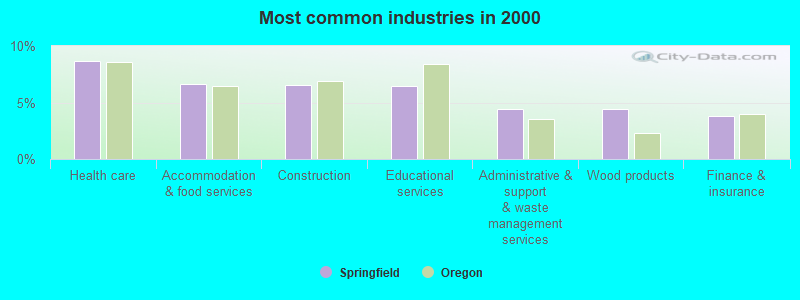
- Health care (8.7%)
- Accommodation & food services (6.7%)
- Construction (6.5%)
- Educational services (6.5%)
- Administrative & support & waste management services (4.5%)
- Wood products (4.4%)
- Finance & insurance (3.8%)
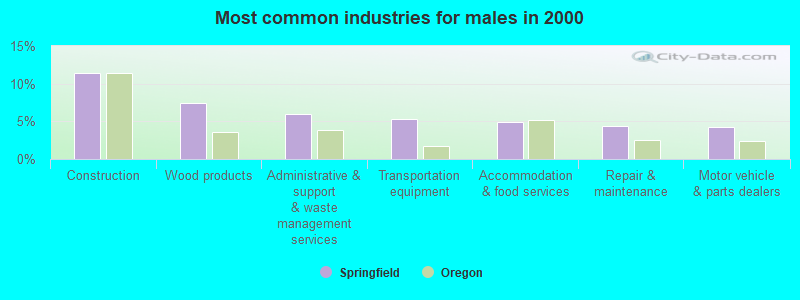
- Construction (11.5%)
- Wood products (7.4%)
- Administrative & support & waste management services (6.0%)
- Transportation equipment (5.2%)
- Accommodation & food services (4.9%)
- Repair & maintenance (4.3%)
- Motor vehicle & parts dealers (4.3%)
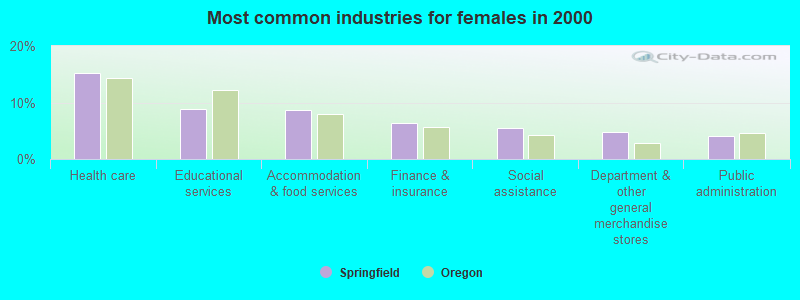
- Health care (15.2%)
- Educational services (8.9%)
- Accommodation & food services (8.6%)
- Finance & insurance (6.4%)
- Social assistance (5.5%)
- Department & other general merchandise stores (4.7%)
- Public administration (4.2%)
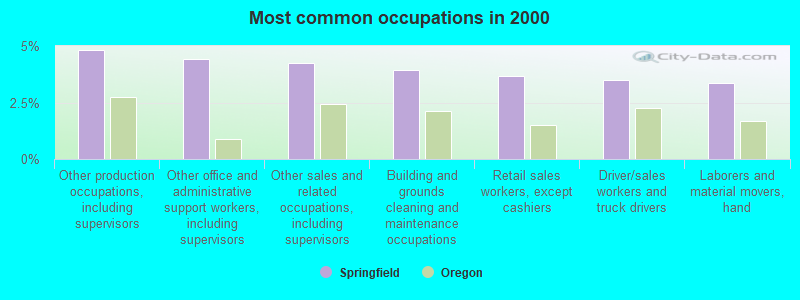
- Other production occupations, including supervisors (4.8%)
- Other office and administrative support workers, including supervisors (4.4%)
- Other sales and related occupations, including supervisors (4.3%)
- Building and grounds cleaning and maintenance occupations (3.9%)
- Retail sales workers, except cashiers (3.7%)
- Driver/sales workers and truck drivers (3.5%)
- Laborers and material movers, hand (3.4%)
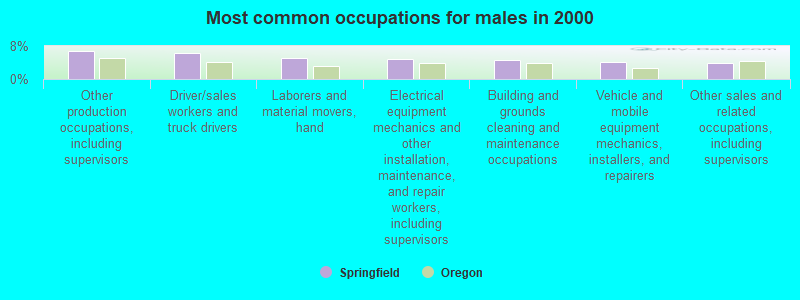
- Other production occupations, including supervisors (6.7%)
- Driver/sales workers and truck drivers (6.3%)
- Laborers and material movers, hand (5.1%)
- Electrical equipment mechanics and other installation, maintenance, and repair workers, including supervisors (4.9%)
- Building and grounds cleaning and maintenance occupations (4.5%)
- Vehicle and mobile equipment mechanics, installers, and repairers (4.0%)
- Other sales and related occupations, including supervisors (4.0%)
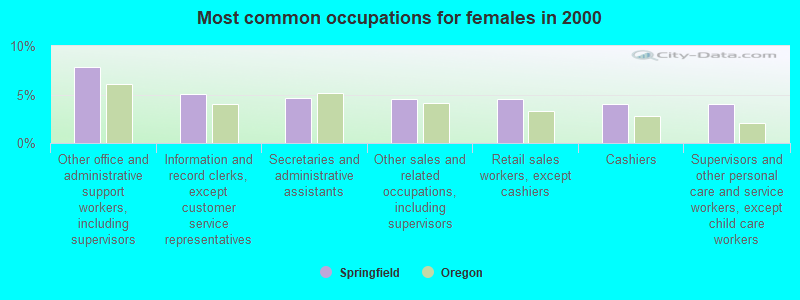
- Other office and administrative support workers, including supervisors (7.9%)
- Information and record clerks, except customer service representatives (5.1%)
- Secretaries and administrative assistants (4.6%)
- Other sales and related occupations, including supervisors (4.6%)
- Retail sales workers, except cashiers (4.5%)
- Cashiers (4.0%)
- Supervisors and other personal care and service workers, except child care workers (4.0%)
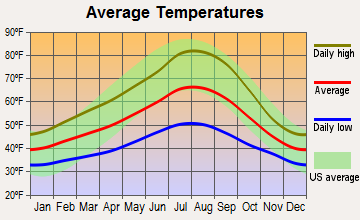
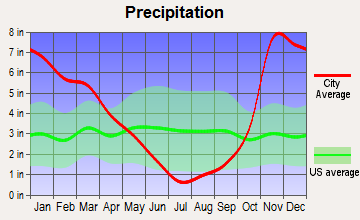
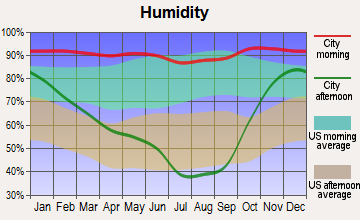
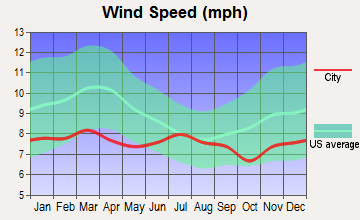
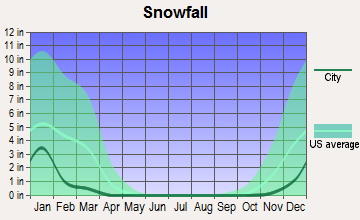
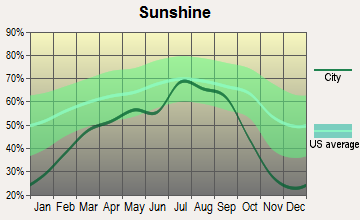
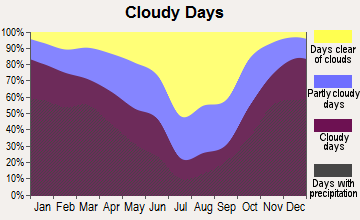
Average climate in Springfield, Oregon
Based on data reported by over 4,000 weather stations
|
|

(lower is better)
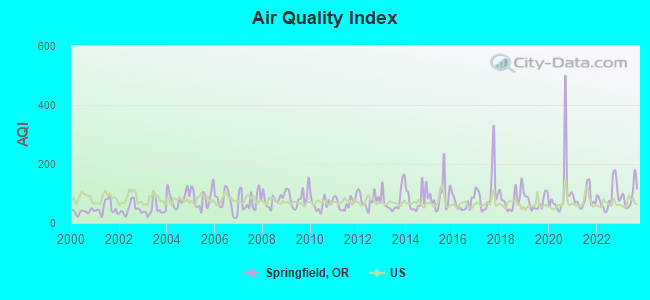
Air Quality Index (AQI) level in 2023 was 92.6. This is worse than average.
| City: | 92.6 |
| U.S.: | 72.6 |
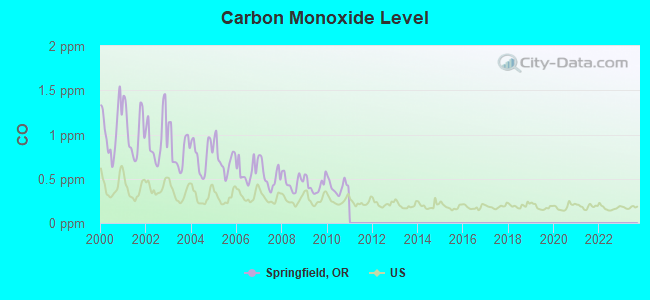
Carbon Monoxide (CO) [ppm] level in 2010 was 0.410. This is significantly worse than average. Closest monitor was 4.6 miles away from the city center.
| City: | 0.410 |
| U.S.: | 0.251 |
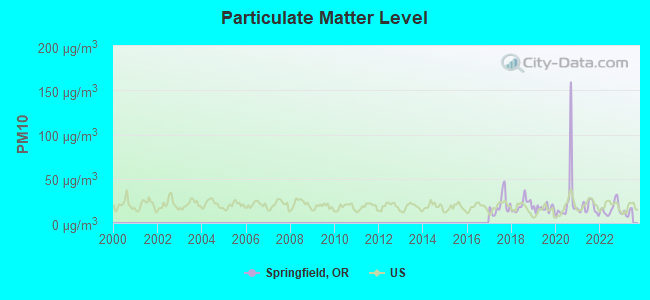
Particulate Matter (PM10) [µg/m3] level in 2022 was 16.0. This is about average. Closest monitor was 1.4 miles away from the city center.
| City: | 16.0 |
| U.S.: | 19.2 |
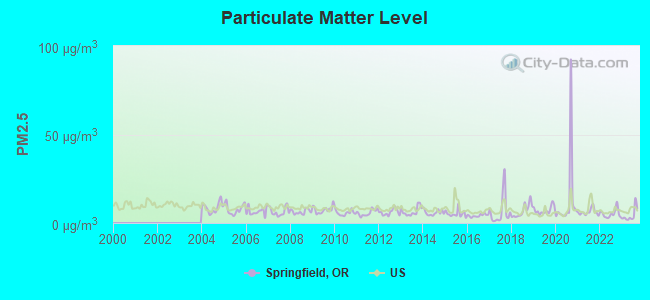
Particulate Matter (PM2.5) [µg/m3] level in 2023 was 4.40. This is significantly better than average. Closest monitor was 1.4 miles away from the city center.
| City: | 4.40 |
| U.S.: | 8.11 |
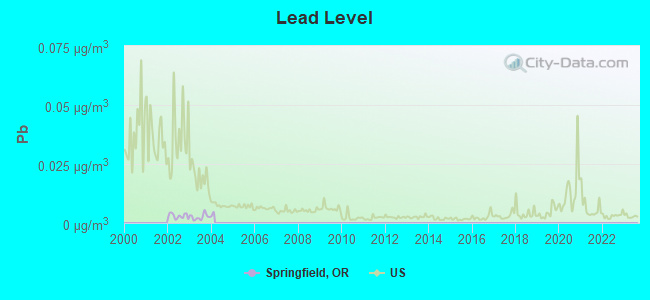
Lead (Pb) [µg/m3] level in 2003 was 0.00258. This is significantly better than average. Closest monitor was 1.4 miles away from the city center.
| City: | 0.00258 |
| U.S.: | 0.00931 |
Earthquake activity:
Springfield-area historical earthquake activity is significantly above Oregon state average. It is 2376% greater than the overall U.S. average.On 1/31/1922 at 13:17:28, a magnitude 7.6 (7.6 UK, Class: Major, Intensity: VIII - XII) earthquake occurred 266.3 miles away from the city center
On 11/8/1980 at 10:27:34, a magnitude 7.2 (6.2 MB, 7.2 MS, 7.2 MW, 7.0 ML) earthquake occurred 214.2 miles away from the city center
On 8/17/1991 at 22:17:14, a magnitude 7.1 (6.2 MB, 7.1 MS, 7.1 MW, 6.8 ML, Depth: 8.4 mi) earthquake occurred 206.6 miles away from Springfield center
On 6/15/2005 at 02:50:54, a magnitude 7.2 (7.2 MW, Depth: 9.9 mi) earthquake occurred 243.2 miles away from the city center
On 6/15/2005 at 02:50:54, a magnitude 7.2 (6.1 MB, 7.1 MS, 7.2 MW, 7.1 MW) earthquake occurred 249.1 miles away from the city center
On 7/13/1991 at 02:50:14, a magnitude 6.9 (6.2 MB, 6.9 MS, 6.8 MW, 6.7 ML, Depth: 6.8 mi, Class: Strong, Intensity: VII - IX) earthquake occurred 189.5 miles away from Springfield center
Magnitude types: body-wave magnitude (MB), local magnitude (ML), surface-wave magnitude (MS), moment magnitude (MW)
Natural disasters:
The number of natural disasters in Lane County (17) is near the US average (15).Major Disasters (Presidential) Declared: 13
Emergencies Declared: 1
Causes of natural disasters: Floods: 10, Winter Storms: 7, Storms: 6, Winds: 4, Landslides: 3, Mudslides: 3, Fire: 1, Heavy Rain: 1, Hurricane: 1, Snow: 1, Other: 1 (Note: some incidents may be assigned to more than one category).
Hospitals and medical centers in Springfield:
- MCKENZIE-WILLAMETTE MEDICAL CENTER (Voluntary non-profit - Private, provides emergency services, 1460 G STREET)
- SACRED HEART MEDICAL CENTER - RIVERBEND (Voluntary non-profit - Private, 3333 RIVERBEND DRIVE)
- MARQUIS CARE AT SPRINGFIELD (1333 N. FIRST STREET)
- QUALICENTERS - EUGENE-SPRINGFIELD LTD (304 Q ST)
- PACIFIC HOME HEALTH AND HOSPICE (4660 MAIN STREET, BUILDING A, SUITE 100-2)
Airports and heliports located in Springfield:
- Jasper Ridge Airstrip Airport (36OR) (Runways: 1)
- Mckenzie-Willamette Medical Center Heliport (41OR)
- River Bend Hospital Heliport (OG64)
- Saxon's Heliport (23OR)
Amtrak stations near Springfield:
- 6 miles: EUGENE-SPRINGFIELD (EUGENE, 433 WILLAMETTE ST.) . Services: ticket office, partially wheelchair accessible, enclosed waiting area, public restrooms, public payphones, full-service food facilities, paid short-term parking, call for car rental service, call for taxi service, public transit connection.
- 18 miles: COTTAGE GROVE (1140 N. STATE HWY 99) - Bus Station . Services: public payphones, full-service food facilities, free short-term parking.
College/University in Springfield:
Colleges/universities with over 2000 students nearest to Springfield:
- Lane Community College (about 4 miles; Eugene, OR; Full-time enrollment: 6,373)
- University of Oregon (about 5 miles; Eugene, OR; FT enrollment: 23,329)
- Linn-Benton Community College (about 38 miles; Albany, OR; FT enrollment: 4,511)
- Oregon State University (about 38 miles; Corvallis, OR; FT enrollment: 23,206)
- Western Oregon University (about 57 miles; Monmouth, OR; FT enrollment: 5,131)
- Willamette University (about 62 miles; Salem, OR; FT enrollment: 2,551)
- Chemeketa Community College (about 64 miles; Salem, OR; FT enrollment: 10,746)
Public high schools in Springfield:
- THURSTON HIGH SCHOOL (Students: 1,588, Location: 333 58TH ST, Grades: 9-12)
- SPRINGFIELD HIGH SCHOOL (Students: 1,465, Location: 875 7TH ST, Grades: 9-12)
- ACADEMY OF ARTS AND ACADEMICS (Students: 112, Location: 615 MAIN ST, Grades: 9-12, Charter school)
- GATEWAYS HIGH SCHOOL (Location: 665 MAIN ST, Grades: 9-12)
Biggest public elementary/middle schools in Springfield:
- AGNES STEWART MIDDLE SCHOOL (Students: 707, Location: 900 S 32ND ST, Grades: 6-8)
- THURSTON MIDDLE SCHOOL (Students: 575, Location: 6300 THURSTON RD, Grades: 6-8)
- MT VERNON ELEMENTARY SCHOOL (Students: 536, Location: 935 FILBERT LN, Grades: KG-5)
- BRIGGS MIDDLE SCHOOL (Students: 532, Location: 2355 YOLANDA AVE, Grades: 6-8)
- DOUGLAS GARDENS ELEMENTARY SCHOOL (Students: 504, Location: 3680 JASPER RD, Grades: KG-5)
- THURSTON ELEMENTARY SCHOOL (Students: 452, Location: 7345 THURSTON RD, Grades: KG-5)
- ELIZABETH PAGE ELEMENTARY SCHOOL (Students: 437, Location: 1300 HAYDEN BRIDGE RD, Grades: KG-5)
- RIVERBEND ELEMENTARY SCHOOL (Students: 429, Location: 320 51ST ST, Grades: KG-5)
- RIDGEVIEW ELEMENTARY SCHOOL (Students: 418, Location: 526 66TH ST, Grades: KG-5)
- HAMLIN MIDDLE SCHOOL (Students: 414, Location: 326 CENTENNIAL BLVD, Grades: 6-8)
Library in Springfield:
Points of interest:
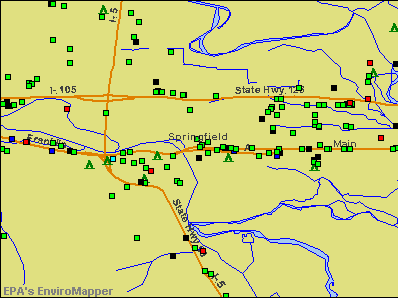
Notable locations in Springfield: EWEB Hayden Bridge Water Treatment Plant (A), Springfield Regional Sports Center (B), Hendricks (C), Springfield Junction (D), Weyerhaeuser Timberlands (E), Judkins (F), Lane Transit District Springfield Station (G), Lane Transit District Park and Ride (H), Lane Transit District Gateway Station (I), Lane Transit District Park and Ride (J), Lane Transit District Thurston Station (K), Lane Transit District Park and Ride (L), Island Park Boat Ramp (M), Springfield Department of Fire and Life Safety Station 4 (N), Springfield Department of Fire and Life Safety Station 5 (O), Springfield Department of Fire and Life Safety Station 3 (P), Springfield Department of Fire and Life Safety Station 14 (Q), Springfield Municipal Court (R), Springfield Library (S), Richard E Wildish Community Theater - Rose Childrens Theatre (T). Display/hide their locations on the map
Churches in Springfield include: Trinity Baptist Church (A), Community Faith Church (B), East Side Baptist Church (C). Display/hide their locations on the map
Cemeteries: Springfield Memorial Cemetery (1), Springfield IOOF Cemetery (2), Laurel Hill Cemetery (3), Mount Vernon Cemetery (4), Old Springfield IOOF Cemetery (5). Display/hide their locations on the map
Streams, rivers, and creeks: Kizer Slough (A), Irving Slough (B). Display/hide their locations on the map
Parks in Springfield include: Road Park (1), Volunteer Park (2), Willamalane Park (3), Willamette Heights Park (4), Meadow Park (5), Menlo Park (6), Gamebird Park (7), Bob Artz Memorial Park (8), William S Fort Memorial Park (9). Display/hide their locations on the map
Tourist attractions: Springfield Museum (Historical Places & Services; 590 Main St) (1), Tilt (Amusement & Theme Parks; 3000 Gateway Street Suite 540) (2), Minds in Motion (Amusement & Theme Parks; 445 Harlow Road) (3), Grand Slam USA (Amusement & Theme Parks; 921 International Way) (4), AAA Oregon - AAA Gateway Springfield- New Membership & Insurance (Tours & Charters; 939 Harlow Road) (5), AA Insurance (Tours & Charters; 939 Harlow Road) (6), Helfrich River Adventures (Tours & Charters; 2267 Rose Blossom Drive) (7), AAA Travel (Tours & Charters; 939 Harlow Road) (8). Display/hide their approximate locations on the map
Hotels: Comfort Suites Springfield (969 Kruse Way) (1), Crossland Economy Studios (520 Harlow Road) (2), McKenzie Motel (1747 Main Street) (3), Courtyard Eugene/Springfield (3443 Hutton Street) (4), Crossland - Eugene/Springfield (520 Harlow Rd) (5), Gateway Inn (3540 Gateway Street) (6), Shilo Inn Eugene/Springfield (3350 Gateway) (7), Motel 6 (3752 International Court) (8), Motel 6 Springfield (3752 International Court) (9). Display/hide their approximate locations on the map
Courts: Lane County - Justice Courts- Central Lane Justice (220 5th Street) (1), Springfield City - Court Municipal- Municipal Court (344 A Street) (2). Display/hide their approximate locations on the map
Birthplace of: Greg McMackin - College football coach, Travis Smith - 2005 Major League Baseball player (Florida Marlins, born: Nov 7, 1972), Robert F. Burt - Admiral.
Drinking water stations with addresses in Springfield and their reported violations in the past:
MARCOLA WATER DISTRICT (Population served: 490, Groundwater):Past monitoring violations:RIVERVIEW MARKET (Population served: 450, Groundwater):
- Failure to Conduct Assessment Monitoring - Between JAN-2012 and DEC-2012, Contaminant: COLIPHAGE. Follow-up actions: St Violation/Reminder Notice (FEB-04-2013), St Compliance achieved (NOV-20-2013)
- Failure to Conduct Assessment Monitoring - Between JAN-2012 and DEC-2012, Contaminant: COLIPHAGE. Follow-up actions: St Violation/Reminder Notice (FEB-04-2013), St Compliance achieved (NOV-20-2013)
- Monitoring and Reporting (DBP) - Between JAN-2005 and DEC-2007, Contaminant: TTHM. Follow-up actions: St Compliance achieved (OCT-01-2010)
- Monitoring and Reporting (DBP) - Between JAN-2005 and DEC-2007, Contaminant: Total Haloacetic Acids (HAA5). Follow-up actions: St Compliance achieved (OCT-01-2010)
- One routine major monitoring violation
- 76 regular monitoring violations
Past monitoring violations:DEERHORN COMMUNITY WTR ASSN (Population served: 275, Groundwater):
- 20 routine major monitoring violations
- 3 regular monitoring violations
Past monitoring violations:SPRINGFIELD COUNTRY CLUB (Population served: 200, Groundwater):
- Initial, Follow-up, or Routine Source Water M/R - In NOV-01-1994, Contaminant: Lead and Copper Rule. Follow-up actions: Fed Compliance achieved (AUG-12-2009), State No Longer Subject to Rule (DEC-25-2010)
Past health violations:APPLEWOOD MOBILE HOME PARK (Population served: 100, Groundwater):Past monitoring violations:
- MCL, Monthly (TCR) - Between OCT-2012 and DEC-2012, Contaminant: Coliform. Follow-up actions: St Public Notif received (NOV-05-2012), St Public Notif requested (NOV-27-2012), St Violation/Reminder Notice (DEC-03-2012), St Compliance achieved (JAN-30-2013)
- MCL, Monthly (TCR) - Between OCT-2007 and DEC-2007, Contaminant: Coliform. Follow-up actions: St Compliance achieved (DEC-19-2008)
- MCL, Monthly (TCR) - Between APR-2005 and JUN-2005, Contaminant: Coliform. Follow-up actions: St Public Notif received (APR-27-2005), St Compliance achieved (DEC-19-2008)
- 3 routine major monitoring violations
Past monitoring violations:UNION ROGUE BAPTIST CAMP (Population served: 25, Groundwater):
- Monitoring of Treatment (SWTR-Unfilt/GWR) - In JUN-2012, Contaminant: GROUNDWATER RULE. Follow-up actions: St Violation/Reminder Notice (JUL-30-2012), St Compliance achieved (AUG-08-2012)
- Follow-up Or Routine LCR Tap M/R - In JAN-01-2005, Contaminant: Lead and Copper Rule. Follow-up actions: St Compliance achieved (AUG-15-2005)
- Initial Tap Sampling for Pb and Cu - In JUL-01-1994, Contaminant: Lead and Copper Rule. Follow-up actions: St Compliance achieved (2 times from NOV-01-1997 to AUG-15-2005)
Past health violations:Past monitoring violations:
- MCL, Monthly (TCR) - Between JUL-2010 and SEP-2010, Contaminant: Coliform. Follow-up actions: St Public Notif requested (SEP-22-2010), St Violation/Reminder Notice (SEP-27-2010), St Compliance achieved (MAR-31-2011)
- 2 routine major monitoring violations
Drinking water stations with addresses in Springfield that have no violations reported:
- EUGENE WATER & ELECTRIC BOARD (Population served: 178,100, Primary Water Source Type: Surface water)
| This city: | 2.5 people |
| Oregon: | 2.5 people |
| This city: | 62.3% |
| Whole state: | 63.4% |
| This city: | 10.4% |
| Whole state: | 8.0% |
Likely homosexual households (counted as self-reported same-sex unmarried-partner households)
- Lesbian couples: 0.6% of all households
- Gay men: 0.3% of all households
People in group quarters in Springfield in 2010:
- 329 people in group homes intended for adults
- 140 people in nursing facilities/skilled-nursing facilities
- 41 people in local jails and other municipal confinement facilities
- 34 people in workers' group living quarters and job corps centers
- 24 people in other noninstitutional facilities
- 11 people in residential treatment centers for adults
- 8 people in emergency and transitional shelters (with sleeping facilities) for people experiencing homelessness
People in group quarters in Springfield in 2000:
- 328 people in other noninstitutional group quarters
- 149 people in other group homes
- 93 people in nursing homes
- 45 people in homes for the mentally retarded
- 14 people in homes for the mentally ill
- 6 people in homes for the physically handicapped
Banks with most branches in Springfield (2011 data):
- U.S. Bank National Association: Springfield Branch, Mohawk-Northgate Branch, East Springfield Albertsons Branch, Pioneer Parkway Safeway. Info updated 2012/01/30: Bank assets: $330,470.8 mil, Deposits: $236,091.5 mil, headquarters in Cincinnati, OH, positive income, 3121 total offices, Holding Company: U.S. Bancorp
- JPMorgan Chase Bank, National Association: Eugene-Springfield Branch, North Springfield, Thurston Branch. Info updated 2011/11/10: Bank assets: $1,811,678.0 mil, Deposits: $1,190,738.0 mil, headquarters in Columbus, OH, positive income, International Specialization, 5577 total offices, Holding Company: Jpmorgan Chase & Co.
- Umpqua Bank: Gateway Branch, Mohawk Branch, Springfield Branch. Info updated 2011/09/02: Bank assets: $11,556.7 mil, Deposits: $9,325.3 mil, headquarters in Roseburg, OR, positive income, Commercial Lending Specialization, 193 total offices, Holding Company: Umpqua Holdings Corporation
- KeyBank National Association: Springfield Branch at 725 N A St, branch established on 1961/04/03; Thruston Village Branch at 5690 Main Street, branch established on 1979/08/16. Info updated 2008/03/03: Bank assets: $86,198.8 mil, Deposits: $64,214.8 mil, headquarters in Cleveland, OH, positive income, Commercial Lending Specialization, 1067 total offices, Holding Company: Keycorp
- Sterling Savings Bank: Springfield In-Store Branch at 2659 Olympic Street, branch established on 2004/01/02. Info updated 2012/03/21: Bank assets: $9,207.8 mil, Deposits: $6,454.1 mil, headquarters in Spokane, WA, positive income, Commercial Lending Specialization, 192 total offices, Holding Company: Sterling Financial Corporation
- Citizens Bank: Springfield Branch at 2355 Olympic Street, branch established on 2003/08/13. Info updated 2009/02/23: Bank assets: $448.2 mil, Deposits: $356.5 mil, headquarters in Corvallis, OR, positive income, Commercial Lending Specialization, 14 total offices, Holding Company: Citizens Bancorp
- Bank of America, National Association: Pioneer Parkway at 1821 Pioneer Parkway E., branch established on 1890/01/01. Info updated 2009/11/18: Bank assets: $1,451,969.3 mil, Deposits: $1,077,176.8 mil, headquarters in Charlotte, NC, positive income, 5782 total offices, Holding Company: Bank Of America Corporation
- Wells Fargo Bank, National Association: Mohawk-Centennial Branch at 1600 Centennial Boulevard, branch established on 1963/12/06. Info updated 2011/04/05: Bank assets: $1,161,490.0 mil, Deposits: $905,653.0 mil, headquarters in Sioux Falls, SD, positive income, 6395 total offices, Holding Company: Wells Fargo & Company
- Pacific Continental Bank: Springfield Branch at 1011 Harlow Road, branch established on 1998/10/13. Info updated 2006/11/03: Bank assets: $1,271.7 mil, Deposits: $974.6 mil, headquarters in Eugene, OR, positive income, Commercial Lending Specialization, 14 total offices, Holding Company: Pacific Continental Corporation
- 2 other banks with 2 local branches
For population 15 years and over in Springfield:
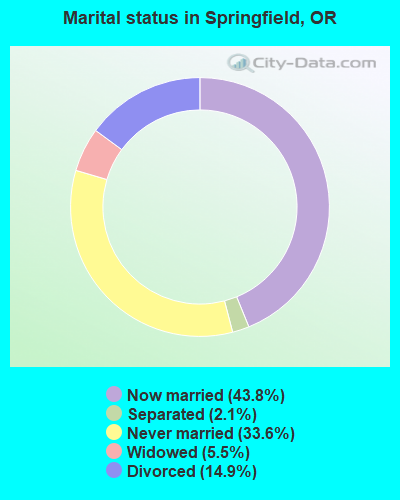
- Never married: 33.6%
- Now married: 43.8%
- Separated: 2.1%
- Widowed: 5.5%
- Divorced: 14.9%
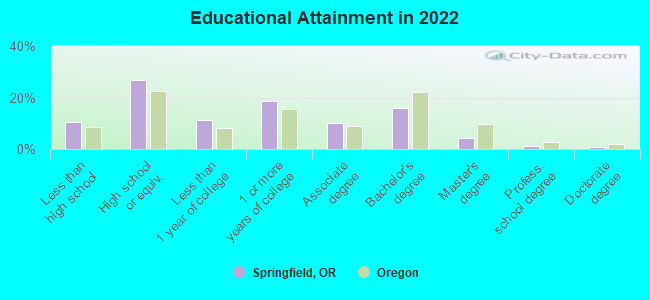
For population 25 years and over in Springfield:
- High school or higher: 89.1%
- Bachelor's degree or higher: 20.7%
- Graduate or professional degree: 6.0%
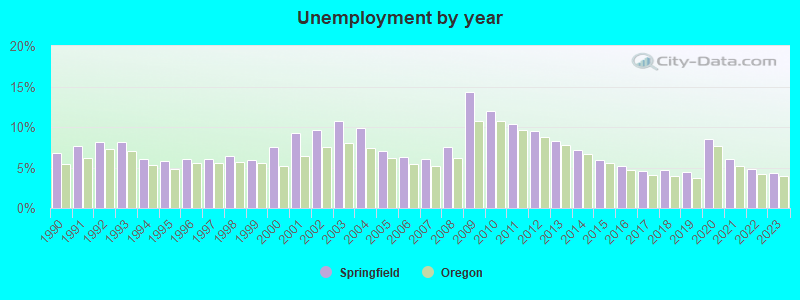
- Unemployed: 8.7%
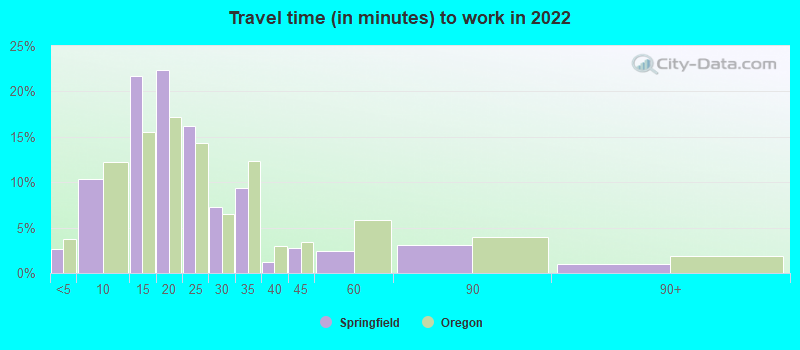
- Mean travel time to work (commute): 17.6 minutes
| Here: | 10.6 |
| Oregon average: | 11.6 |
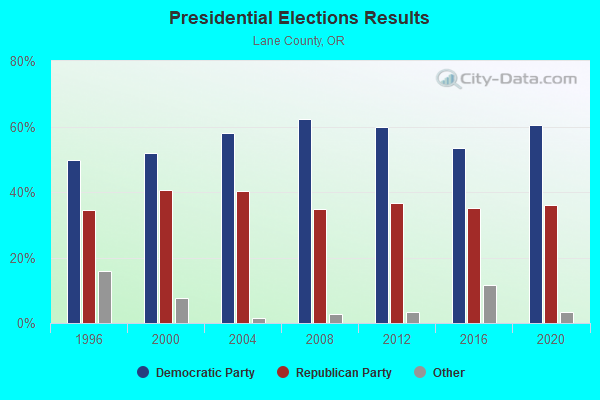
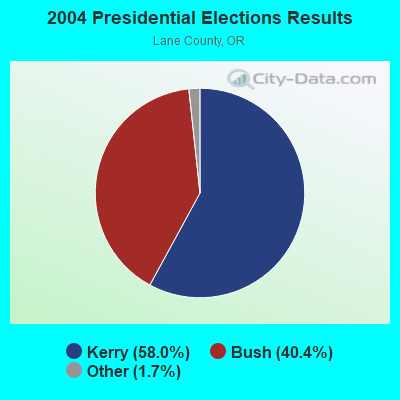
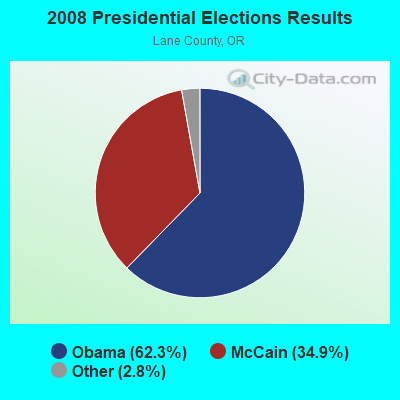
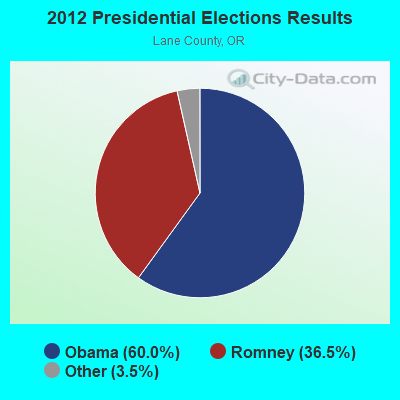
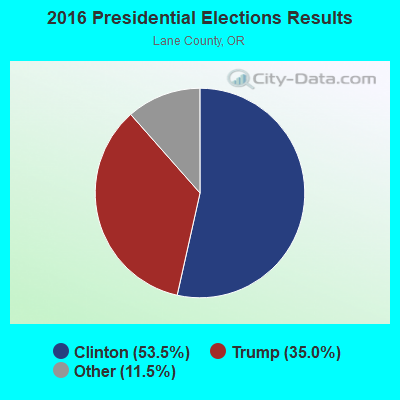
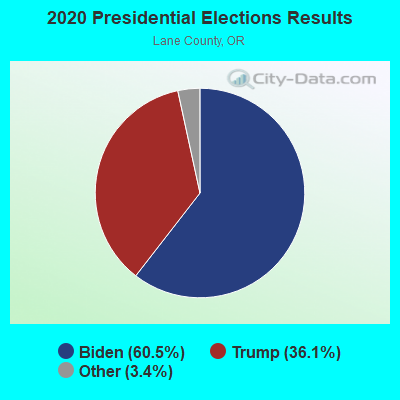
Graphs represent county-level data. Detailed 2008 Election Results
Religion statistics for Springfield, OR (based on Lane County data)
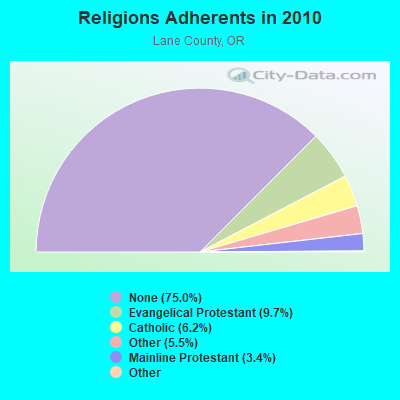
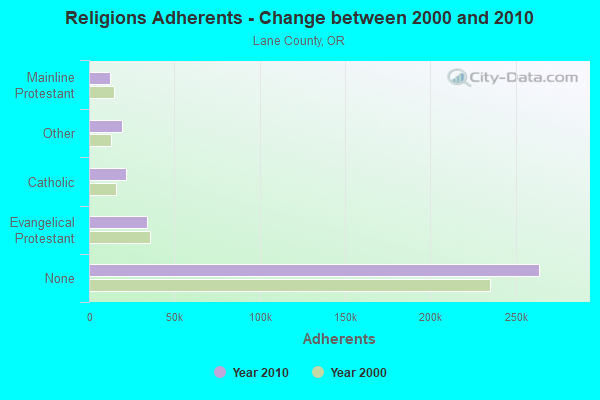
| Religion | Adherents | Congregations |
|---|---|---|
| Evangelical Protestant | 34,051 | 216 |
| Catholic | 21,785 | 15 |
| Other | 19,303 | 72 |
| Mainline Protestant | 12,082 | 50 |
| Black Protestant | 295 | 2 |
| Orthodox | 240 | 2 |
| None | 263,959 | - |
Food Environment Statistics:
| This county: | 1.95 / 10,000 pop. |
| Oregon: | 2.03 / 10,000 pop. |
| Lane County: | 0.44 / 10,000 pop. |
| State: | 0.33 / 10,000 pop. |
| Here: | 2.68 / 10,000 pop. |
| Oregon: | 2.01 / 10,000 pop. |
| Lane County: | 1.69 / 10,000 pop. |
| Oregon: | 1.69 / 10,000 pop. |
| Lane County: | 8.40 / 10,000 pop. |
| Oregon: | 9.93 / 10,000 pop. |
| This county: | 6.5% |
| Oregon: | 7.4% |
| Lane County: | 26.1% |
| Oregon: | 25.6% |
| Lane County: | 15.3% |
| State: | 14.2% |
Health and Nutrition:
| Springfield: | 47.5% |
| Oregon: | 49.6% |
| This city: | 44.1% |
| State: | 46.8% |
| Here: | 28.8 |
| State: | 28.5 |
| Springfield: | 22.4% |
| Oregon: | 21.2% |
| Springfield: | 10.8% |
| Oregon: | 10.1% |
| Springfield: | 6.8 |
| Oregon: | 6.8 |
| This city: | 33.0% |
| Oregon: | 33.3% |
| Springfield: | 55.3% |
| Oregon: | 56.5% |
| This city: | 79.0% |
| Oregon: | 78.7% |
More about Health and Nutrition of Springfield, OR Residents
| Local government employment and payroll (March 2022) | |||||
| Function | Full-time employees | Monthly full-time payroll | Average yearly full-time wage | Part-time employees | Monthly part-time payroll |
|---|---|---|---|---|---|
| Firefighters | 85 | $946,333 | $133,600 | 0 | $0 |
| Police Protection - Officers | 68 | $702,016 | $123,885 | 0 | $0 |
| Other and Unallocable | 60 | $405,965 | $81,193 | 3 | $13,234 |
| Streets and Highways | 57 | $400,583 | $84,333 | 0 | $0 |
| Other Government Administration | 51 | $365,292 | $85,951 | 0 | $0 |
| Electric Power | 38 | $344,982 | $108,942 | 0 | $0 |
| Police - Other | 36 | $237,301 | $79,100 | 0 | $0 |
| Water Supply | 36 | $273,618 | $91,206 | 2 | $12,772 |
| Housing and Community Development (Local) | 29 | $232,606 | $96,251 | 0 | $0 |
| Financial Administration | 25 | $201,809 | $96,868 | 0 | $0 |
| Local Libraries | 21 | $96,921 | $55,383 | 0 | $0 |
| Correction | 17 | $146,254 | $103,238 | 0 | $0 |
| Fire - Other | 13 | $90,396 | $83,442 | 0 | $0 |
| Judicial and Legal | 12 | $66,453 | $66,453 | 0 | $0 |
| Totals for Government | 548 | $4,510,529 | $98,771 | 5 | $26,006 |
Springfield government finances - Expenditure in 2021 (per resident):
- Construction - Sewerage: $12,779,000 ($208.13)
Regular Highways: $4,368,000 ($71.14)
General - Other: $2,100,000 ($34.20)
Water Utilities: $1,761,000 ($28.68)
Electric Utilities: $450,000 ($7.33)
Housing and Community Development: $239,000 ($3.89)
- Current Operations - Electric Utilities: $48,057,000 ($782.69)
Sewerage: $30,587,000 ($498.16)
Police Protection: $25,222,000 ($410.78)
Local Fire Protection: $22,870,000 ($372.48)
Health - Other: $7,235,000 ($117.83)
Water Utilities: $7,032,000 ($114.53)
Regular Highways: $6,363,000 ($103.63)
Central Staff Services: $5,396,000 ($87.88)
General - Other: $2,701,000 ($43.99)
Financial Administration: $2,261,000 ($36.82)
Libraries: $2,245,000 ($36.56)
Housing and Community Development: $1,156,000 ($18.83)
Protective Inspection and Regulation - Other: $1,105,000 ($18.00)
Judicial and Legal Services: $741,000 ($12.07)
- General - Interest on Debt: $2,076,000 ($33.81)
- Intergovernmental to Local - Other - Electric Utilities: $2,005,000 ($32.65)
- Other Capital Outlay - Electric Utilities: $810,000 ($13.19)
Water Utilities: $284,000 ($4.63)
- Total Salaries and Wages: $48,871,000 ($795.94)
- Water Utilities - Interest on Debt: $19,000 ($0.31)
Springfield government finances - Revenue in 2021 (per resident):
- Charges - Sewerage: $49,963,000 ($813.73)
Other: $15,144,000 ($246.64)
Regular Highways: $150,000 ($2.44)
- Miscellaneous - Special Assessments: $8,296,000 ($135.11)
General Revenue - Other: $5,106,000 ($83.16)
Interest Earnings: $2,212,000 ($36.03)
Rents: $1,420,000 ($23.13)
Fines and Forfeits: $1,316,000 ($21.43)
Sale of Property: $48,000 ($0.78)
- Revenue - Electric Utilities: $52,714,000 ($858.53)
Water Utilities: $14,069,000 ($229.14)
- State Intergovernmental - Highways: $5,351,000 ($87.15)
General Local Government Support: $3,588,000 ($58.44)
Other: $3,045,000 ($49.59)
Health and Hospitals: $30,000 ($0.49)
- Tax - Property: $37,426,000 ($609.54)
Other License: $3,422,000 ($55.73)
Public Utilities Sales: $2,881,000 ($46.92)
Other Selective Sales: $1,206,000 ($19.64)
Motor Fuels Sales: $860,000 ($14.01)
Springfield government finances - Debt in 2021 (per resident):
- Long Term Debt - Beginning Outstanding - Unspecified Public Purpose: $61,362,000 ($999.38)
Outstanding Unspecified Public Purpose: $51,028,000 ($831.07)
Retired Unspecified Public Purpose: $15,534,000 ($253.00)
Issue, Unspecified Public Purpose: $5,200,000 ($84.69)
Springfield government finances - Cash and Securities in 2021 (per resident):
- Bond Funds - Cash and Securities: $4,958,000 ($80.75)
- Other Funds - Cash and Securities: $258,982,000 ($4217.95)
- Sinking Funds - Cash and Securities: $520,000 ($8.47)
| Businesses in Springfield, OR | ||||
| Name | Count | Name | Count | |
|---|---|---|---|---|
| 7-Eleven | 2 | Little Caesars Pizza | 1 | |
| AT&T | 2 | Marriott | 1 | |
| Albertsons | 2 | MasterBrand Cabinets | 2 | |
| Applebee's | 1 | Maurices | 1 | |
| Arby's | 1 | McDonald's | 3 | |
| Ashley Furniture | 1 | Motel 6 | 1 | |
| AutoZone | 1 | Motherhood Maternity | 1 | |
| Baskin-Robbins | 1 | Nike | 3 | |
| Best Western | 1 | Outback | 1 | |
| Blockbuster | 2 | Outback Steakhouse | 1 | |
| Burger King | 2 | Papa John's Pizza | 1 | |
| Carl\s Jr. | 3 | Payless | 2 | |
| Chuck E. Cheese's | 1 | Penske | 1 | |
| Comfort Suites | 1 | Pizza Hut | 1 | |
| Cricket Wireless | 2 | Quality | 1 | |
| Crossland Economy Studios | 1 | Quiznos | 2 | |
| Curves | 1 | RadioShack | 2 | |
| Dairy Queen | 1 | Rite Aid | 1 | |
| Dennys | 1 | SONIC Drive-In | 1 | |
| Domino's Pizza | 1 | Sears | 3 | |
| Ethan Allen | 1 | Spencer Gifts | 1 | |
| Famous Footwear | 1 | Staples | 1 | |
| Fashion Bug | 1 | Starbucks | 4 | |
| FedEx | 6 | Subway | 8 | |
| GNC | 1 | Super 8 | 1 | |
| GameStop | 1 | T-Mobile | 4 | |
| H&R Block | 3 | Taco Bell | 3 | |
| Holiday Inn | 2 | Target | 1 | |
| HomeTown Buffet | 1 | Toyota | 1 | |
| Jack In The Box | 3 | True Value | 1 | |
| Jimmy John's | 1 | U-Haul | 2 | |
| KFC | 2 | UPS | 6 | |
| Kincaid | 1 | Vans | 1 | |
| Kohl's | 1 | Vons | 2 | |
| Kroger | 3 | Walgreens | 4 | |
| Lane Bryant | 1 | Walmart | 1 | |
| Lane Furniture | 2 | Wendy's | 1 | |
Strongest AM radio stations in Springfield:
- KORE (1050 AM; 5 kW; SPRINGFIELD-EUGENE, OR; Owner: SUPPORT CHRISTIAN BROADCASTING)
- KPNW (1120 AM; 50 kW; EUGENE, OR; Owner: CAPSTAR TX LIMITED PARTNERSHIP)
- KUGN (590 AM; 5 kW; EUGENE, OR; Owner: CUMULUS LICENSING CORP.)
- KEED (1600 AM; 5 kW; EUGENE, OR; Owner: INTEGRITY MEDIA INCORPORATED)
- KRVM (1280 AM; 5 kW; EUGENE, OR; Owner: LANE COUNTY SCHOOL DISTRICT 4J)
- KZTU (660 AM; 10 kW; JUNCTION CITY, OR; Owner: PAMPLIN BROADCASTING-OREGON, INC.)
- KKNX (840 AM; 1 kW; EUGENE, OR; Owner: WILLIAMETTE MEDIA GROUP)
- KKXO (1450 AM; 1 kW; EUGENE, OR; Owner: MCKENZIE RIVER BROADCASTING COMPANY, INC.)
- KSCR (1320 AM; 1 kW; EUGENE, OR; Owner: CUMULUS LICENSING CORP.)
- KDUN (1030 AM; 50 kW; REEDSPORT, OR; Owner: PAMPLIN BROADCASTING-OREGON, INC.)
- KPOJ (620 AM; 50 kW; PORTLAND, OR; Owner: CITICASTERS LICENSES, L.P.)
- KXL (750 AM; 50 kW; PORTLAND, OR; Owner: ROSE CITY RADIO CORPORATION)
- KGRV (700 AM; 25 kW; WINSTON, OR; Owner: PACIFIC CASCADE COMMUNICATIONS CORP.)
Strongest FM radio stations in Springfield:
- K275AA (102.9 FM; SPRINGFIELD, OR; Owner: CUMULUS LICENSING CORP.)
- KODZ (99.1 FM; EUGENE, OR; Owner: CAPSTAR TX LIMITED PARTNERSHIP)
- K207BX (89.3 FM; EUGENE, OR; Owner: PENSACOLA CHRISTIAN COLLEGE, INC.)
- K203BT (88.5 FM; EUGENE, OR; Owner: CALVARY CHAPEL OF TWIN FALLS, INC.)
- K214CI (90.7 FM; EUGENE, OR; Owner: EDUCATIONAL MEDIA FOUNDATION)
- KWVA (88.1 FM; EUGENE, OR; Owner: ASSOC. STUDENTS OF THE UNIV. ORGEON)
- KUJZ (95.3 FM; CRESWELL, OR; Owner: CUMULUS LICENSING CORP.)
- KKNU (93.1 FM; SPRINGFIELD-EUGENE, OR; Owner: MCKENZIE RIVER BROADCASTING COMPANY, INC.)
- KMGE (94.5 FM; EUGENE, OR; Owner: MCKENZIE RIVER BROADCASTING COMPANY, INC.)
- KZEL-FM (96.1 FM; EUGENE, OR; Owner: CUMULUS LICENSING CORP.)
- KNRQ-FM (97.9 FM; EUGENE, OR; Owner: CUMULUS LICENSING CORP.)
- KWAX (91.1 FM; EUGENE, OR; Owner: STATE OF OREGON ACTING BY & THROUGH)
- KLCC (89.7 FM; EUGENE, OR; Owner: LANE COMMUNITY COLLEGE)
- KQFE (88.9 FM; SPRINGFIELD, OR; Owner: FAMILY STATIONS, INC.)
- K245AA (96.9 FM; EUGENE, OR; Owner: ALBANY RADIO CORPORATION)
- K265DF (100.9 FM; EUGENE, OR; Owner: EDUCATIONAL MEDIA FOUNDATION)
- KRVM-FM (91.9 FM; EUGENE, OR; Owner: SCHOOL DIST. 4J, LANE COUNTY, OREGON)
- KDUK-FM (104.7 FM; FLORENCE, OR; Owner: CAPSTAR TX LIMITED PARTNERSHIP)
- KFLY (101.5 FM; CORVALLIS, OR; Owner: CITICASTERS LICENSES, L.P.)
- KLVU (107.1 FM; SWEET HOME, OR; Owner: EDUCATIONAL MEDIA FOUNDATION)
TV broadcast stations around Springfield:
- KMTR (Channel 16; EUGENE, OR; Owner: ACKERLEY MEDIA GROUP, INC.)
- KEZI (Channel 9; EUGENE, OR; Owner: KEZI, INC.)
- KLSR-TV (Channel 34; EUGENE, OR; Owner: CALIFORNIA OREGON BROADCASTING, INC.)
- KVAL-TV (Channel 13; EUGENE, OR; Owner: FISHER BROADCASTING - OREGON TV, L.L.C.)
- KEPB-TV (Channel 28; EUGENE, OR; Owner: OREGON PUBLIC BROADCASTING)
- KEVU-LP (Channel 23; EUGENE, OR; Owner: CALIFORNIA OREGON BROADCASTING, INC.)
- K04DR (Channel 4; EUGENE, OR; Owner: FISHER BROADCASTING - OREGON TV, L.L.C.)
- KAMK-LP (Channel 53; EUGENE, OR; Owner: ROSEBURG BROADCASTING, INC.)
- KMOR-LP (Channel 51; EUGENE, OR; Owner: ACKERLEY MEDIA GROUP, INC.)
- K36FJ (Channel 36; EUGENE, OR; Owner: THREE ANGELS BROADCASTING NETWORK, INC.)
- K59DJ (Channel 59; EUGENE, OR; Owner: HIS WORD BROADCASTING CO.)
- K57EL (Channel 57; EUGENE, ETC., OR; Owner: CALIFORNIA OREGON BROADCASTING, INC.)
- KORY-CA (Channel 41; EUGENE, OR; Owner: WATCHTV, INC.)
- K65ER (Channel 65; EUGENE, ETC., OR; Owner: CALIFORNIA OREGON BROADCASTING, INC.)
- K21FS (Channel 21; EUGENE, OR; Owner: OREGON PUBLIC BROADCASTING)
- K11GT (Channel 11; COLLEGE HILL, ETC., OR; Owner: KEZI, INC.)
- National Bridge Inventory (NBI) Statistics
- 92Number of bridges
- 1,358ft / 414mTotal length
- $20,198,000Total costs
- 1,268,509Total average daily traffic
- 171,776Total average daily truck traffic
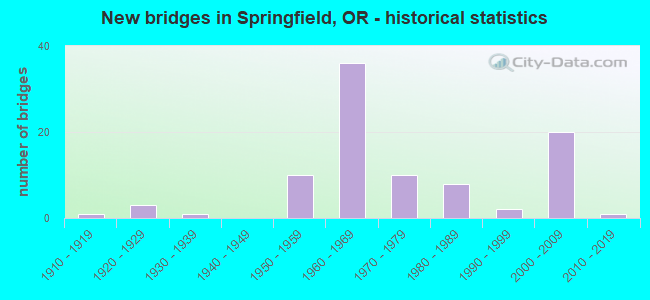
- New bridges - historical statistics
- 11910-1919
- 31920-1929
- 11930-1939
- 101950-1959
- 361960-1969
- 101970-1979
- 81980-1989
- 21990-1999
- 202000-2009
- 12010-2019
FCC Registered Antenna Towers: 157 (See the full list of FCC Registered Antenna Towers)
FCC Registered Private Land Mobile Towers: 1 (See the full list of FCC Registered Private Land Mobile Towers in Springfield, OR)
FCC Registered Broadcast Land Mobile Towers: 56 (See the full list of FCC Registered Broadcast Land Mobile Towers)
FCC Registered Microwave Towers: 76 (See the full list of FCC Registered Microwave Towers in this town)
FCC Registered Paging Towers: 5 (See the full list of FCC Registered Paging Towers)
FCC Registered Amateur Radio Licenses: 551 (See the full list of FCC Registered Amateur Radio Licenses in Springfield)
FAA Registered Aircraft: 100 (See the full list of FAA Registered Aircraft in Springfield)
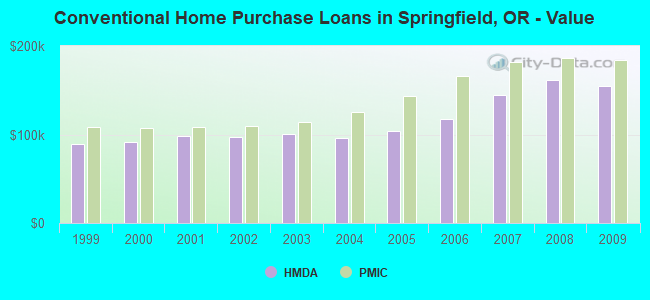
| Home Mortgage Disclosure Act Aggregated Statistics For Year 2009 (Based on 5 full and 12 partial tracts) | ||||||||||||||
| A) FHA, FSA/RHS & VA Home Purchase Loans | B) Conventional Home Purchase Loans | C) Refinancings | D) Home Improvement Loans | E) Loans on Dwellings For 5+ Families | F) Non-occupant Loans on < 5 Family Dwellings (A B C & D) | G) Loans On Manufactured Home Dwelling (A B C & D) | ||||||||
|---|---|---|---|---|---|---|---|---|---|---|---|---|---|---|
| Number | Average Value | Number | Average Value | Number | Average Value | Number | Average Value | Number | Average Value | Number | Average Value | Number | Average Value | |
| LOANS ORIGINATED | 181 | $164,370 | 99 | $154,926 | 683 | $154,805 | 27 | $84,094 | 12 | $1,399,410 | 74 | $145,384 | 20 | $105,408 |
| APPLICATIONS APPROVED, NOT ACCEPTED | 15 | $148,711 | 10 | $152,596 | 101 | $164,724 | 14 | $42,391 | 0 | $0 | 6 | $84,562 | 7 | $95,494 |
| APPLICATIONS DENIED | 38 | $154,763 | 39 | $92,530 | 289 | $164,448 | 18 | $66,421 | 1 | $2,336,400 | 26 | $150,317 | 27 | $70,904 |
| APPLICATIONS WITHDRAWN | 21 | $161,506 | 10 | $151,827 | 154 | $155,036 | 5 | $128,674 | 0 | $0 | 16 | $118,143 | 7 | $129,369 |
| FILES CLOSED FOR INCOMPLETENESS | 6 | $146,962 | 3 | $167,087 | 59 | $166,088 | 5 | $68,280 | 0 | $0 | 7 | $146,191 | 0 | $0 |
Detailed mortgage data for all 15 tracts in Springfield, OR
| Private Mortgage Insurance Companies Aggregated Statistics For Year 2009 (Based on 5 full and 11 partial tracts) | ||||||||
| A) Conventional Home Purchase Loans | B) Refinancings | C) Non-occupant Loans on < 5 Family Dwellings (A & B) | D) Loans On Manufactured Home Dwelling (A & B) | |||||
|---|---|---|---|---|---|---|---|---|
| Number | Average Value | Number | Average Value | Number | Average Value | Number | Average Value | |
| LOANS ORIGINATED | 20 | $184,316 | 13 | $192,275 | 1 | $161,600 | 1 | $132,000 |
| APPLICATIONS APPROVED, NOT ACCEPTED | 7 | $139,530 | 11 | $170,615 | 1 | $133,000 | 1 | $82,980 |
| APPLICATIONS DENIED | 12 | $141,043 | 5 | $174,386 | 0 | $0 | 0 | $0 |
| APPLICATIONS WITHDRAWN | 0 | $0 | 0 | $0 | 0 | $0 | 0 | $0 |
| FILES CLOSED FOR INCOMPLETENESS | 1 | $167,000 | 0 | $0 | 0 | $0 | 0 | $0 |

2002 - 2018 National Fire Incident Reporting System (NFIRS) incidents
- Fire incident types reported to NFIRS in Springfield, OR
- 1,53446.9%Outside Fires
- 1,11334.0%Structure Fires
- 53216.3%Mobile Property/Vehicle Fires
- 942.9%Other
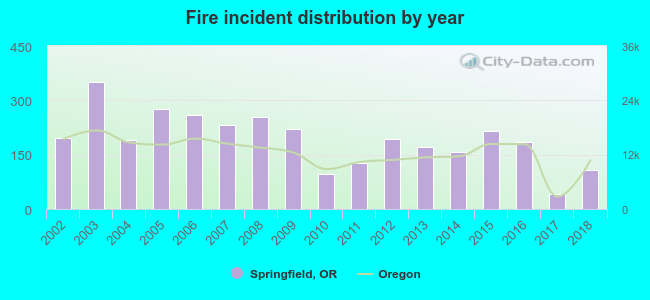 According to the data from the years 2002 - 2018 the average number of fire incidents per year is 193. The highest number of reported fires - 351 took place in 2003, and the least - 41 in 2017. The data has a dropping trend.
 When looking into fire subcategories, the most reports belonged to: Outside Fires (46.9%), and Structure Fires (34.0%).
Fire-safe hotels and motels in Springfield, Oregon:
- Quality Inn & Suites, 3550 Gateway St, Springfield, Oregon 97477 , Phone: (541) 726-9266, Fax: (541) 744-2643
- Holiday Inn Express-eugene/springfield, 3480 Hutton St, Springfield, Oregon 97477 , Phone: (541) 746-8471, Fax: (541) 747-1541
- Comfort Suites, 969 Kruse Way, Springfield, Oregon 97477 , Phone: (541) 746-5359, Fax: (541) 746-2100
- Crossland Economy Studios - Eugene - Springfield, 520 Harlow Rd, Springfield, Oregon 97477 , Phone: (541) 741-3908, Fax: (541) 741-3945
- Best Western Grand Manor Inn, 971 Kruse Way, Springfield, Oregon 97477 , Phone: (800) 626-1900, Fax: (541) 744-0745
- Motel Orleans, 3315 Gateway St, Springfield, Oregon 97477 , Phone: (541) 746-1314, Fax: (541) 746-3884
- Holiday Inn North Eugene - Springfield, 919 Kruse Way, Springfield, Oregon 97477 , Phone: (541) 284-0707, Fax: (541) 284-4498
- Hilton Garden Inn Eugene/Springfield, 3528 Gateway St, Springfield, Oregon 97477 , Phone: (541) 736-3000, Fax: (541) 746-3530
- Super 8- Eugene/Springfield, 3315 Gateway St, Springfield, Oregon 97477 , Phone: (541) 746-1314
| Most common first names in Springfield, OR among deceased individuals | ||
| Name | Count | Lived (average) |
|---|---|---|
| William | 304 | 74.8 years |
| John | 278 | 73.9 years |
| Robert | 265 | 70.5 years |
| James | 257 | 70.0 years |
| Mary | 221 | 78.3 years |
| Charles | 184 | 73.7 years |
| George | 179 | 77.0 years |
| Donald | 132 | 71.1 years |
| Helen | 130 | 80.6 years |
| Richard | 124 | 68.8 years |
| Most common last names in Springfield, OR among deceased individuals | ||
| Last name | Count | Lived (average) |
|---|---|---|
| Smith | 185 | 73.9 years |
| Johnson | 152 | 74.3 years |
| Brown | 88 | 76.5 years |
| Jones | 83 | 72.6 years |
| Miller | 83 | 74.1 years |
| Davis | 78 | 74.8 years |
| Anderson | 69 | 75.2 years |
| Williams | 66 | 75.9 years |
| Taylor | 64 | 72.3 years |
| Wilson | 61 | 72.1 years |
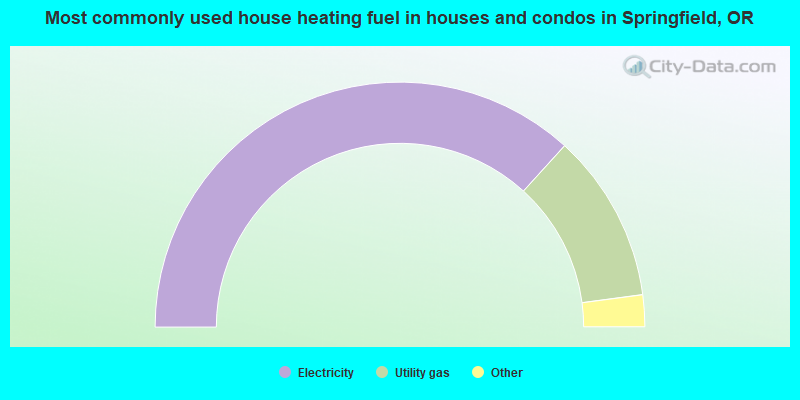
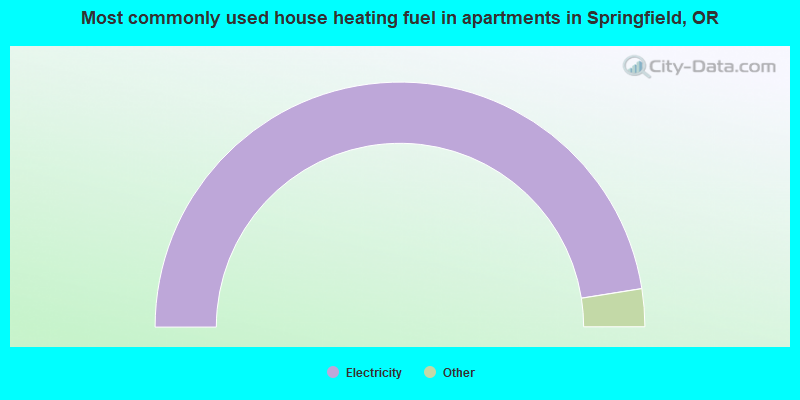
- 73.5%Electricity
- 22.3%Utility gas
- 2.6%Wood
- 0.8%No fuel used
- 0.6%Bottled, tank, or LP gas
- 0.1%Fuel oil, kerosene, etc.
- 95.0%Electricity
- 3.3%Utility gas
- 0.5%Wood
- 0.4%Bottled, tank, or LP gas
- 0.3%Other fuel
- 0.2%Coal or coke
- 0.2%No fuel used
Springfield compared to Oregon state average:
- Unemployed percentage below state average.
- Black race population percentage below state average.
- Length of stay since moving in significantly above state average.
Springfield on our top lists:
- #5 on the list of "Top 101 cities with the lowest average wind speeds (population 50,000+)"
- #14 on the list of "Top 101 cities with the largest percentage of unmarried partner households (population 50,000+)"
- #25 on the list of "Top 101 cities with largest percentage of males in industries: retail trade (population 50,000+)"
- #28 on the list of "Top 101 cities with largest percentage of males in occupations: farming, fishing, and forestry occupations (population 50,000+)"
- #33 on the list of "Top 101 cities with largest percentage of males in industries: agriculture, forestry, fishing and hunting (population 50,000+)"
- #34 on the list of "Top 101 cities with the lowest average sunshine amount (population 50,000+)"
- #36 on the list of "Top 101 cities with the highest maximum monthly morning or afternoon humidity (population 50,000+)"
- #40 on the list of "Top 101 cities with the lowest minimum monthly sunshine amount (population 50,000+)"
- #44 on the list of "Top 101 cities with largest percentage of females in occupations: farming, fishing, and forestry occupations (population 50,000+)"
- #46 on the list of "Top 101 cities with largest percentage of females in occupations: personal care and service occupations (population 50,000+)"
- #47 on the list of "Top 101 cities with the highest number of thefts per 100,000 residents, excludes tourist destinations and others with a lot of outsiders visiting based on city industries data (population 50,000+)"
- #54 on the list of "Top 101 cities with largest percentage of females in industries: agriculture, forestry, fishing and hunting (population 50,000+)"
- #54 on the list of "Top 101 cities with largest percentage of females in occupations: transportation occupations (population 50,000+)"
- #57 on the list of "Top 101 cities with the largest percentage of likely lesbian couples (counted as self-reported female-female unmarried-partner households) (population 50,000+)"
- #58 on the list of "Top 101 cities with the highest average humidity (population 50,000+)"
- #67 on the list of "Top 101 cities with the largest city-data.com crime index increase from 2011 to 2012 (population 50,000+)"
- #71 on the list of "Top 101 cities with largest percentage of females in occupations: carpenters (population 50,000+)"
- #72 on the list of "Top 101 cities with largest percentage of males in industries: leather and allied products (population 50,000+)"
- #73 on the list of "Top 101 cities with largest percentage of males in industries: fuel dealers (population 50,000+)"
- #73 on the list of "Top 101 cities with largest percentage of females in industries: leather and allied products (population 50,000+)"
- #8 on the list of "Top 101 counties with the largest decrease in the number of infant deaths per 1000 residents 2000-2006 to 2007-2013 (pop. 50,000+)"
- #11 on the list of "Top 101 counties with the lowest number of infant deaths per 1000 residents 2007-2013 (pop. 50,000+)"
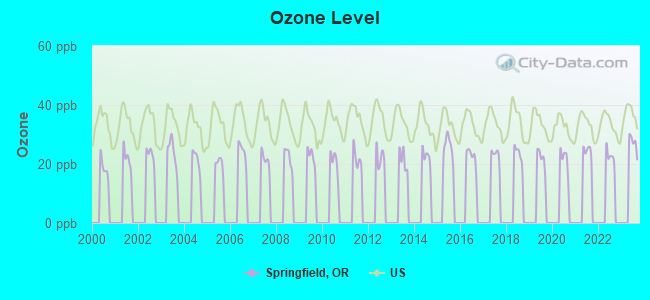
- #19 on the list of "Top 101 counties with the lowest Ozone (1-hour) air pollution readings in 2012 (ppm)"
- #22 on the list of "Top 101 counties with highest percentage of residents voting for 3rd party candidates in the 2012 Presidential Election (pop. 50,000+)"
- #54 on the list of "Top 101 counties with the highest percentage of residents that exercised in the past month"

|
|
Total of 202 patent applications in 2008-2024.