Tigard, Oregon Submit your own pictures of this city and show them to the world
OSM Map
General Map
Google Map
MSN Map
OSM Map
General Map
Google Map
MSN Map
OSM Map
General Map
Google Map
MSN Map
OSM Map
General Map
Google Map
MSN Map
Please wait while loading the map...
Population in 2022: 55,762 (100% urban, 0% rural). Population change since 2000: +35.3%Males: 28,302 Females: 27,460
March 2022 cost of living index in Tigard: 104.7 (near average, U.S. average is 100) Percentage of residents living in poverty in 2022: 7.8%for White Non-Hispanic residents , 9.2% for Black residents , 11.9% for Hispanic or Latino residents , 19.9% for American Indian residents , 17.8% for other race residents , 7.8% for two or more races residents )
Profiles of local businesses
Business Search - 14 Million verified businesses
Data:
Median household income ($)
Median household income (% change since 2000)
Household income diversity
Ratio of average income to average house value (%)
Ratio of average income to average rent
Median household income ($) - White
Median household income ($) - Black or African American
Median household income ($) - Asian
Median household income ($) - Hispanic or Latino
Median household income ($) - American Indian and Alaska Native
Median household income ($) - Multirace
Median household income ($) - Other Race
Median household income for houses/condos with a mortgage ($)
Median household income for apartments without a mortgage ($)
Races - White alone (%)
Races - White alone (% change since 2000)
Races - Black alone (%)
Races - Black alone (% change since 2000)
Races - American Indian alone (%)
Races - American Indian alone (% change since 2000)
Races - Asian alone (%)
Races - Asian alone (% change since 2000)
Races - Hispanic (%)
Races - Hispanic (% change since 2000)
Races - Native Hawaiian and Other Pacific Islander alone (%)
Races - Native Hawaiian and Other Pacific Islander alone (% change since 2000)
Races - Two or more races (%)
Races - Two or more races (% change since 2000)
Races - Other race alone (%)
Races - Other race alone (% change since 2000)
Racial diversity
Unemployment (%)
Unemployment (% change since 2000)
Unemployment (%) - White
Unemployment (%) - Black or African American
Unemployment (%) - Asian
Unemployment (%) - Hispanic or Latino
Unemployment (%) - American Indian and Alaska Native
Unemployment (%) - Multirace
Unemployment (%) - Other Race
Population density (people per square mile)
Population - Males (%)
Population - Females (%)
Population - Males (%) - White
Population - Males (%) - Black or African American
Population - Males (%) - Asian
Population - Males (%) - Hispanic or Latino
Population - Males (%) - American Indian and Alaska Native
Population - Males (%) - Multirace
Population - Males (%) - Other Race
Population - Females (%) - White
Population - Females (%) - Black or African American
Population - Females (%) - Asian
Population - Females (%) - Hispanic or Latino
Population - Females (%) - American Indian and Alaska Native
Population - Females (%) - Multirace
Population - Females (%) - Other Race
Coronavirus confirmed cases (Apr 27, 2024)
Deaths caused by coronavirus (Apr 27, 2024)
Coronavirus confirmed cases (per 100k population) (Apr 27, 2024)
Deaths caused by coronavirus (per 100k population) (Apr 27, 2024)
Daily increase in number of cases (Apr 27, 2024)
Weekly increase in number of cases (Apr 27, 2024)
Cases doubled (in days) (Apr 27, 2024)
Hospitalized patients (Apr 18, 2022)
Negative test results (Apr 18, 2022)
Total test results (Apr 18, 2022)
COVID Vaccine doses distributed (per 100k population) (Sep 19, 2023)
COVID Vaccine doses administered (per 100k population) (Sep 19, 2023)
COVID Vaccine doses distributed (Sep 19, 2023)
COVID Vaccine doses administered (Sep 19, 2023)
Likely homosexual households (%)
Likely homosexual households (% change since 2000)
Likely homosexual households - Lesbian couples (%)
Likely homosexual households - Lesbian couples (% change since 2000)
Likely homosexual households - Gay men (%)
Likely homosexual households - Gay men (% change since 2000)
Cost of living index
Median gross rent ($)
Median contract rent ($)
Median monthly housing costs ($)
Median house or condo value ($)
Median house or condo value ($ change since 2000)
Mean house or condo value by units in structure - 1, detached ($)
Mean house or condo value by units in structure - 1, attached ($)
Mean house or condo value by units in structure - 2 ($)
Mean house or condo value by units in structure by units in structure - 3 or 4 ($)
Mean house or condo value by units in structure - 5 or more ($)
Mean house or condo value by units in structure - Boat, RV, van, etc. ($)
Mean house or condo value by units in structure - Mobile home ($)
Median house or condo value ($) - White
Median house or condo value ($) - Black or African American
Median house or condo value ($) - Asian
Median house or condo value ($) - Hispanic or Latino
Median house or condo value ($) - American Indian and Alaska Native
Median house or condo value ($) - Multirace
Median house or condo value ($) - Other Race
Median resident age
Resident age diversity
Median resident age - Males
Median resident age - Females
Median resident age - White
Median resident age - Black or African American
Median resident age - Asian
Median resident age - Hispanic or Latino
Median resident age - American Indian and Alaska Native
Median resident age - Multirace
Median resident age - Other Race
Median resident age - Males - White
Median resident age - Males - Black or African American
Median resident age - Males - Asian
Median resident age - Males - Hispanic or Latino
Median resident age - Males - American Indian and Alaska Native
Median resident age - Males - Multirace
Median resident age - Males - Other Race
Median resident age - Females - White
Median resident age - Females - Black or African American
Median resident age - Females - Asian
Median resident age - Females - Hispanic or Latino
Median resident age - Females - American Indian and Alaska Native
Median resident age - Females - Multirace
Median resident age - Females - Other Race
Commute - mean travel time to work (minutes)
Travel time to work - Less than 5 minutes (%)
Travel time to work - Less than 5 minutes (% change since 2000)
Travel time to work - 5 to 9 minutes (%)
Travel time to work - 5 to 9 minutes (% change since 2000)
Travel time to work - 10 to 19 minutes (%)
Travel time to work - 10 to 19 minutes (% change since 2000)
Travel time to work - 20 to 29 minutes (%)
Travel time to work - 20 to 29 minutes (% change since 2000)
Travel time to work - 30 to 39 minutes (%)
Travel time to work - 30 to 39 minutes (% change since 2000)
Travel time to work - 40 to 59 minutes (%)
Travel time to work - 40 to 59 minutes (% change since 2000)
Travel time to work - 60 to 89 minutes (%)
Travel time to work - 60 to 89 minutes (% change since 2000)
Travel time to work - 90 or more minutes (%)
Travel time to work - 90 or more minutes (% change since 2000)
Marital status - Never married (%)
Marital status - Now married (%)
Marital status - Separated (%)
Marital status - Widowed (%)
Marital status - Divorced (%)
Median family income ($)
Median family income (% change since 2000)
Median non-family income ($)
Median non-family income (% change since 2000)
Median per capita income ($)
Median per capita income (% change since 2000)
Median family income ($) - White
Median family income ($) - Black or African American
Median family income ($) - Asian
Median family income ($) - Hispanic or Latino
Median family income ($) - American Indian and Alaska Native
Median family income ($) - Multirace
Median family income ($) - Other Race
Median year house/condo built
Median year apartment built
Year house built - Built 2005 or later (%)
Year house built - Built 2000 to 2004 (%)
Year house built - Built 1990 to 1999 (%)
Year house built - Built 1980 to 1989 (%)
Year house built - Built 1970 to 1979 (%)
Year house built - Built 1960 to 1969 (%)
Year house built - Built 1950 to 1959 (%)
Year house built - Built 1940 to 1949 (%)
Year house built - Built 1939 or earlier (%)
Average household size
Household density (households per square mile)
Average household size - White
Average household size - Black or African American
Average household size - Asian
Average household size - Hispanic or Latino
Average household size - American Indian and Alaska Native
Average household size - Multirace
Average household size - Other Race
Occupied housing units (%)
Vacant housing units (%)
Owner occupied housing units (%)
Renter occupied housing units (%)
Vacancy status - For rent (%)
Vacancy status - For sale only (%)
Vacancy status - Rented or sold, not occupied (%)
Vacancy status - For seasonal, recreational, or occasional use (%)
Vacancy status - For migrant workers (%)
Vacancy status - Other vacant (%)
Residents with income below the poverty level (%)
Residents with income below 50% of the poverty level (%)
Children below poverty level (%)
Poor families by family type - Married-couple family (%)
Poor families by family type - Male, no wife present (%)
Poor families by family type - Female, no husband present (%)
Poverty status for native-born residents (%)
Poverty status for foreign-born residents (%)
Poverty among high school graduates not in families (%)
Poverty among people who did not graduate high school not in families (%)
Residents with income below the poverty level (%) - White
Residents with income below the poverty level (%) - Black or African American
Residents with income below the poverty level (%) - Asian
Residents with income below the poverty level (%) - Hispanic or Latino
Residents with income below the poverty level (%) - American Indian and Alaska Native
Residents with income below the poverty level (%) - Multirace
Residents with income below the poverty level (%) - Other Race
Air pollution - Air Quality Index (AQI)
Air pollution - CO
Air pollution - NO2
Air pollution - SO2
Air pollution - Ozone
Air pollution - PM10
Air pollution - PM25
Air pollution - Pb
Crime - Murders per 100,000 population
Crime - Rapes per 100,000 population
Crime - Robberies per 100,000 population
Crime - Assaults per 100,000 population
Crime - Burglaries per 100,000 population
Crime - Thefts per 100,000 population
Crime - Auto thefts per 100,000 population
Crime - Arson per 100,000 population
Crime - City-data.com crime index
Crime - Violent crime index
Crime - Property crime index
Crime - Murders per 100,000 population (5 year average)
Crime - Rapes per 100,000 population (5 year average)
Crime - Robberies per 100,000 population (5 year average)
Crime - Assaults per 100,000 population (5 year average)
Crime - Burglaries per 100,000 population (5 year average)
Crime - Thefts per 100,000 population (5 year average)
Crime - Auto thefts per 100,000 population (5 year average)
Crime - Arson per 100,000 population (5 year average)
Crime - City-data.com crime index (5 year average)
Crime - Violent crime index (5 year average)
Crime - Property crime index (5 year average)
1996 Presidential Elections Results (%) - Democratic Party (Clinton)
1996 Presidential Elections Results (%) - Republican Party (Dole)
1996 Presidential Elections Results (%) - Other
2000 Presidential Elections Results (%) - Democratic Party (Gore)
2000 Presidential Elections Results (%) - Republican Party (Bush)
2000 Presidential Elections Results (%) - Other
2004 Presidential Elections Results (%) - Democratic Party (Kerry)
2004 Presidential Elections Results (%) - Republican Party (Bush)
2004 Presidential Elections Results (%) - Other
2008 Presidential Elections Results (%) - Democratic Party (Obama)
2008 Presidential Elections Results (%) - Republican Party (McCain)
2008 Presidential Elections Results (%) - Other
2012 Presidential Elections Results (%) - Democratic Party (Obama)
2012 Presidential Elections Results (%) - Republican Party (Romney)
2012 Presidential Elections Results (%) - Other
2016 Presidential Elections Results (%) - Democratic Party (Clinton)
2016 Presidential Elections Results (%) - Republican Party (Trump)
2016 Presidential Elections Results (%) - Other
2020 Presidential Elections Results (%) - Democratic Party (Biden)
2020 Presidential Elections Results (%) - Republican Party (Trump)
2020 Presidential Elections Results (%) - Other
Ancestries Reported - Arab (%)
Ancestries Reported - Czech (%)
Ancestries Reported - Danish (%)
Ancestries Reported - Dutch (%)
Ancestries Reported - English (%)
Ancestries Reported - French (%)
Ancestries Reported - French Canadian (%)
Ancestries Reported - German (%)
Ancestries Reported - Greek (%)
Ancestries Reported - Hungarian (%)
Ancestries Reported - Irish (%)
Ancestries Reported - Italian (%)
Ancestries Reported - Lithuanian (%)
Ancestries Reported - Norwegian (%)
Ancestries Reported - Polish (%)
Ancestries Reported - Portuguese (%)
Ancestries Reported - Russian (%)
Ancestries Reported - Scotch-Irish (%)
Ancestries Reported - Scottish (%)
Ancestries Reported - Slovak (%)
Ancestries Reported - Subsaharan African (%)
Ancestries Reported - Swedish (%)
Ancestries Reported - Swiss (%)
Ancestries Reported - Ukrainian (%)
Ancestries Reported - United States (%)
Ancestries Reported - Welsh (%)
Ancestries Reported - West Indian (%)
Ancestries Reported - Other (%)
Educational Attainment - No schooling completed (%)
Educational Attainment - Less than high school (%)
Educational Attainment - High school or equivalent (%)
Educational Attainment - Less than 1 year of college (%)
Educational Attainment - 1 or more years of college (%)
Educational Attainment - Associate degree (%)
Educational Attainment - Bachelor's degree (%)
Educational Attainment - Master's degree (%)
Educational Attainment - Professional school degree (%)
Educational Attainment - Doctorate degree (%)
School Enrollment - Nursery, preschool (%)
School Enrollment - Kindergarten (%)
School Enrollment - Grade 1 to 4 (%)
School Enrollment - Grade 5 to 8 (%)
School Enrollment - Grade 9 to 12 (%)
School Enrollment - College undergrad (%)
School Enrollment - Graduate or professional (%)
School Enrollment - Not enrolled in school (%)
School enrollment - Public schools (%)
School enrollment - Private schools (%)
School enrollment - Not enrolled (%)
Median number of rooms in houses and condos
Median number of rooms in apartments
Housing units lacking complete plumbing facilities (%)
Housing units lacking complete kitchen facilities (%)
Density of houses
Urban houses (%)
Rural houses (%)
Households with people 60 years and over (%)
Households with people 65 years and over (%)
Households with people 75 years and over (%)
Households with one or more nonrelatives (%)
Households with no nonrelatives (%)
Population in households (%)
Family households (%)
Nonfamily households (%)
Population in families (%)
Family households with own children (%)
Median number of bedrooms in owner occupied houses
Mean number of bedrooms in owner occupied houses
Median number of bedrooms in renter occupied houses
Mean number of bedrooms in renter occupied houses
Median number of vehichles in owner occupied houses
Mean number of vehichles in owner occupied houses
Median number of vehichles in renter occupied houses
Mean number of vehichles in renter occupied houses
Mortgage status - with mortgage (%)
Mortgage status - with second mortgage (%)
Mortgage status - with home equity loan (%)
Mortgage status - with both second mortgage and home equity loan (%)
Mortgage status - without a mortgage (%)
Average family size
Average family size - White
Average family size - Black or African American
Average family size - Asian
Average family size - Hispanic or Latino
Average family size - American Indian and Alaska Native
Average family size - Multirace
Average family size - Other Race
Geographical mobility - Same house 1 year ago (%)
Geographical mobility - Moved within same county (%)
Geographical mobility - Moved from different county within same state (%)
Geographical mobility - Moved from different state (%)
Geographical mobility - Moved from abroad (%)
Place of birth - Born in state of residence (%)
Place of birth - Born in other state (%)
Place of birth - Native, outside of US (%)
Place of birth - Foreign born (%)
Housing units in structures - 1, detached (%)
Housing units in structures - 1, attached (%)
Housing units in structures - 2 (%)
Housing units in structures - 3 or 4 (%)
Housing units in structures - 5 to 9 (%)
Housing units in structures - 10 to 19 (%)
Housing units in structures - 20 to 49 (%)
Housing units in structures - 50 or more (%)
Housing units in structures - Mobile home (%)
Housing units in structures - Boat, RV, van, etc. (%)
House/condo owner moved in on average (years ago)
Renter moved in on average (years ago)
Year householder moved into unit - Moved in 1999 to March 2000 (%)
Year householder moved into unit - Moved in 1995 to 1998 (%)
Year householder moved into unit - Moved in 1990 to 1994 (%)
Year householder moved into unit - Moved in 1980 to 1989 (%)
Year householder moved into unit - Moved in 1970 to 1979 (%)
Year householder moved into unit - Moved in 1969 or earlier (%)
Means of transportation to work - Drove car alone (%)
Means of transportation to work - Carpooled (%)
Means of transportation to work - Public transportation (%)
Means of transportation to work - Bus or trolley bus (%)
Means of transportation to work - Streetcar or trolley car (%)
Means of transportation to work - Subway or elevated (%)
Means of transportation to work - Railroad (%)
Means of transportation to work - Ferryboat (%)
Means of transportation to work - Taxicab (%)
Means of transportation to work - Motorcycle (%)
Means of transportation to work - Bicycle (%)
Means of transportation to work - Walked (%)
Means of transportation to work - Other means (%)
Working at home (%)
Industry diversity
Most Common Industries - Agriculture, forestry, fishing and hunting, and mining (%)
Most Common Industries - Agriculture, forestry, fishing and hunting (%)
Most Common Industries - Mining, quarrying, and oil and gas extraction (%)
Most Common Industries - Construction (%)
Most Common Industries - Manufacturing (%)
Most Common Industries - Wholesale trade (%)
Most Common Industries - Retail trade (%)
Most Common Industries - Transportation and warehousing, and utilities (%)
Most Common Industries - Transportation and warehousing (%)
Most Common Industries - Utilities (%)
Most Common Industries - Information (%)
Most Common Industries - Finance and insurance, and real estate and rental and leasing (%)
Most Common Industries - Finance and insurance (%)
Most Common Industries - Real estate and rental and leasing (%)
Most Common Industries - Professional, scientific, and management, and administrative and waste management services (%)
Most Common Industries - Professional, scientific, and technical services (%)
Most Common Industries - Management of companies and enterprises (%)
Most Common Industries - Administrative and support and waste management services (%)
Most Common Industries - Educational services, and health care and social assistance (%)
Most Common Industries - Educational services (%)
Most Common Industries - Health care and social assistance (%)
Most Common Industries - Arts, entertainment, and recreation, and accommodation and food services (%)
Most Common Industries - Arts, entertainment, and recreation (%)
Most Common Industries - Accommodation and food services (%)
Most Common Industries - Other services, except public administration (%)
Most Common Industries - Public administration (%)
Occupation diversity
Most Common Occupations - Management, business, science, and arts occupations (%)
Most Common Occupations - Management, business, and financial occupations (%)
Most Common Occupations - Management occupations (%)
Most Common Occupations - Business and financial operations occupations (%)
Most Common Occupations - Computer, engineering, and science occupations (%)
Most Common Occupations - Computer and mathematical occupations (%)
Most Common Occupations - Architecture and engineering occupations (%)
Most Common Occupations - Life, physical, and social science occupations (%)
Most Common Occupations - Education, legal, community service, arts, and media occupations (%)
Most Common Occupations - Community and social service occupations (%)
Most Common Occupations - Legal occupations (%)
Most Common Occupations - Education, training, and library occupations (%)
Most Common Occupations - Arts, design, entertainment, sports, and media occupations (%)
Most Common Occupations - Healthcare practitioners and technical occupations (%)
Most Common Occupations - Health diagnosing and treating practitioners and other technical occupations (%)
Most Common Occupations - Health technologists and technicians (%)
Most Common Occupations - Service occupations (%)
Most Common Occupations - Healthcare support occupations (%)
Most Common Occupations - Protective service occupations (%)
Most Common Occupations - Fire fighting and prevention, and other protective service workers including supervisors (%)
Most Common Occupations - Law enforcement workers including supervisors (%)
Most Common Occupations - Food preparation and serving related occupations (%)
Most Common Occupations - Building and grounds cleaning and maintenance occupations (%)
Most Common Occupations - Personal care and service occupations (%)
Most Common Occupations - Sales and office occupations (%)
Most Common Occupations - Sales and related occupations (%)
Most Common Occupations - Office and administrative support occupations (%)
Most Common Occupations - Natural resources, construction, and maintenance occupations (%)
Most Common Occupations - Farming, fishing, and forestry occupations (%)
Most Common Occupations - Construction and extraction occupations (%)
Most Common Occupations - Installation, maintenance, and repair occupations (%)
Most Common Occupations - Production, transportation, and material moving occupations (%)
Most Common Occupations - Production occupations (%)
Most Common Occupations - Transportation occupations (%)
Most Common Occupations - Material moving occupations (%)
People in Group quarters - Institutionalized population (%)
People in Group quarters - Correctional institutions (%)
People in Group quarters - Federal prisons and detention centers (%)
People in Group quarters - Halfway houses (%)
People in Group quarters - Local jails and other confinement facilities (including police lockups) (%)
People in Group quarters - Military disciplinary barracks (%)
People in Group quarters - State prisons (%)
People in Group quarters - Other types of correctional institutions (%)
People in Group quarters - Nursing homes (%)
People in Group quarters - Hospitals/wards, hospices, and schools for the handicapped (%)
People in Group quarters - Hospitals/wards and hospices for chronically ill (%)
People in Group quarters - Hospices or homes for chronically ill (%)
People in Group quarters - Military hospitals or wards for chronically ill (%)
People in Group quarters - Other hospitals or wards for chronically ill (%)
People in Group quarters - Hospitals or wards for drug/alcohol abuse (%)
People in Group quarters - Mental (Psychiatric) hospitals or wards (%)
People in Group quarters - Schools, hospitals, or wards for the mentally retarded (%)
People in Group quarters - Schools, hospitals, or wards for the physically handicapped (%)
People in Group quarters - Institutions for the deaf (%)
People in Group quarters - Institutions for the blind (%)
People in Group quarters - Orthopedic wards and institutions for the physically handicapped (%)
People in Group quarters - Wards in general hospitals for patients who have no usual home elsewhere (%)
People in Group quarters - Wards in military hospitals for patients who have no usual home elsewhere (%)
People in Group quarters - Juvenile institutions (%)
People in Group quarters - Long-term care (%)
People in Group quarters - Homes for abused, dependent, and neglected children (%)
People in Group quarters - Residential treatment centers for emotionally disturbed children (%)
People in Group quarters - Training schools for juvenile delinquents (%)
People in Group quarters - Short-term care, detention or diagnostic centers for delinquent children (%)
People in Group quarters - Type of juvenile institution unknown (%)
People in Group quarters - Noninstitutionalized population (%)
People in Group quarters - College dormitories (includes college quarters off campus) (%)
People in Group quarters - Military quarters (%)
People in Group quarters - On base (%)
People in Group quarters - Barracks, unaccompanied personnel housing (UPH), (Enlisted/Officer), ;and similar group living quarters for military personnel (%)
People in Group quarters - Transient quarters for temporary residents (%)
People in Group quarters - Military ships (%)
People in Group quarters - Group homes (%)
People in Group quarters - Homes or halfway houses for drug/alcohol abuse (%)
People in Group quarters - Homes for the mentally ill (%)
People in Group quarters - Homes for the mentally retarded (%)
People in Group quarters - Homes for the physically handicapped (%)
People in Group quarters - Other group homes (%)
People in Group quarters - Religious group quarters (%)
People in Group quarters - Dormitories (%)
People in Group quarters - Agriculture workers' dormitories on farms (%)
People in Group quarters - Job Corps and vocational training facilities (%)
People in Group quarters - Other workers' dormitories (%)
People in Group quarters - Crews of maritime vessels (%)
People in Group quarters - Other nonhousehold living situations (%)
People in Group quarters - Other noninstitutional group quarters (%)
Residents speaking English at home (%)
Residents speaking English at home - Born in the United States (%)
Residents speaking English at home - Native, born elsewhere (%)
Residents speaking English at home - Foreign born (%)
Residents speaking Spanish at home (%)
Residents speaking Spanish at home - Born in the United States (%)
Residents speaking Spanish at home - Native, born elsewhere (%)
Residents speaking Spanish at home - Foreign born (%)
Residents speaking other language at home (%)
Residents speaking other language at home - Born in the United States (%)
Residents speaking other language at home - Native, born elsewhere (%)
Residents speaking other language at home - Foreign born (%)
Class of Workers - Employee of private company (%)
Class of Workers - Self-employed in own incorporated business (%)
Class of Workers - Private not-for-profit wage and salary workers (%)
Class of Workers - Local government workers (%)
Class of Workers - State government workers (%)
Class of Workers - Federal government workers (%)
Class of Workers - Self-employed workers in own not incorporated business and Unpaid family workers (%)
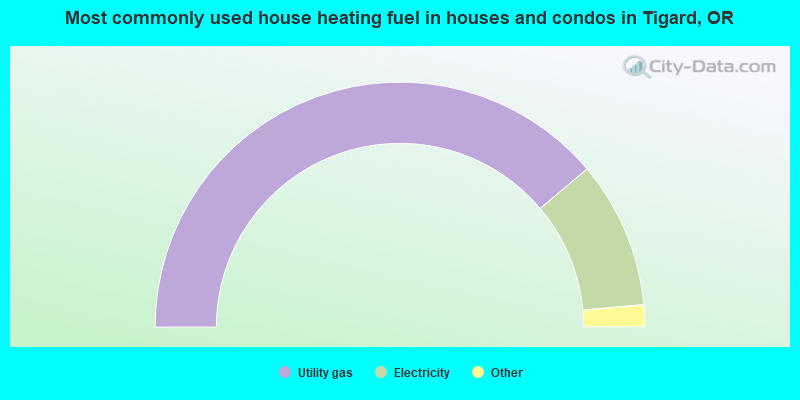
House heating fuel used in houses and condos - Utility gas (%)
House heating fuel used in houses and condos - Bottled, tank, or LP gas (%)
House heating fuel used in houses and condos - Electricity (%)
House heating fuel used in houses and condos - Fuel oil, kerosene, etc. (%)
House heating fuel used in houses and condos - Coal or coke (%)
House heating fuel used in houses and condos - Wood (%)
House heating fuel used in houses and condos - Solar energy (%)
House heating fuel used in houses and condos - Other fuel (%)
House heating fuel used in houses and condos - No fuel used (%)
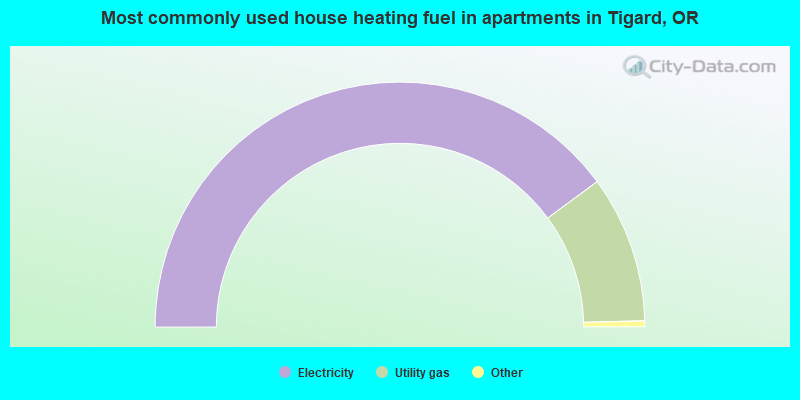
House heating fuel used in apartments - Utility gas (%)
House heating fuel used in apartments - Bottled, tank, or LP gas (%)
House heating fuel used in apartments - Electricity (%)
House heating fuel used in apartments - Fuel oil, kerosene, etc. (%)
House heating fuel used in apartments - Coal or coke (%)
House heating fuel used in apartments - Wood (%)
House heating fuel used in apartments - Solar energy (%)
House heating fuel used in apartments - Other fuel (%)
House heating fuel used in apartments - No fuel used (%)
Armed forces status - In Armed Forces (%)
Armed forces status - Civilian (%)
Armed forces status - Civilian - Veteran (%)
Armed forces status - Civilian - Nonveteran (%)
Fatal accidents locations in years 2005-2021
Fatal accidents locations in 2005
Fatal accidents locations in 2006
Fatal accidents locations in 2007
Fatal accidents locations in 2008
Fatal accidents locations in 2009
Fatal accidents locations in 2010
Fatal accidents locations in 2011
Fatal accidents locations in 2012
Fatal accidents locations in 2013
Fatal accidents locations in 2014
Fatal accidents locations in 2015
Fatal accidents locations in 2016
Fatal accidents locations in 2017
Fatal accidents locations in 2018
Fatal accidents locations in 2019
Fatal accidents locations in 2020
Fatal accidents locations in 2021
Alcohol use - People drinking some alcohol every month (%)
Alcohol use - People not drinking at all (%)
Alcohol use - Average days/month drinking alcohol
Alcohol use - Average drinks/week
Alcohol use - Average days/year people drink much
Audiometry - Average condition of hearing (%)
Audiometry - People that can hear a whisper from across a quiet room (%)
Audiometry - People that can hear normal voice from across a quiet room (%)
Audiometry - Ears ringing, roaring, buzzing (%)
Audiometry - Had a job exposure to loud noise (%)
Audiometry - Had off-work exposure to loud noise (%)
Blood Pressure & Cholesterol - Has high blood pressure (%)
Blood Pressure & Cholesterol - Checking blood pressure at home (%)
Blood Pressure & Cholesterol - Frequently checking blood cholesterol (%)
Blood Pressure & Cholesterol - Has high cholesterol level (%)
Consumer Behavior - Money monthly spent on food at supermarket/grocery store
Consumer Behavior - Money monthly spent on food at other stores
Consumer Behavior - Money monthly spent on eating out
Consumer Behavior - Money monthly spent on carryout/delivered foods
Consumer Behavior - Income spent on food at supermarket/grocery store (%)
Consumer Behavior - Income spent on food at other stores (%)
Consumer Behavior - Income spent on eating out (%)
Consumer Behavior - Income spent on carryout/delivered foods (%)
Current Health Status - General health condition (%)
Current Health Status - Blood donors (%)
Current Health Status - Has blood ever tested for HIV virus (%)
Current Health Status - Left-handed people (%)
Dermatology - People using sunscreen (%)
Diabetes - Diabetics (%)
Diabetes - Had a blood test for high blood sugar (%)
Diabetes - People taking insulin (%)
Diet Behavior & Nutrition - Diet health (%)
Diet Behavior & Nutrition - Milk product consumption (# of products/month)
Diet Behavior & Nutrition - Meals not home prepared (#/week)
Diet Behavior & Nutrition - Meals from fast food or pizza place (#/week)
Diet Behavior & Nutrition - Ready-to-eat foods (#/month)
Diet Behavior & Nutrition - Frozen meals/pizza (#/month)
Drug Use - People that ever used marijuana or hashish (%)
Drug Use - Ever used hard drugs (%)
Drug Use - Ever used any form of cocaine (%)
Drug Use - Ever used heroin (%)
Drug Use - Ever used methamphetamine (%)
Health Insurance - People covered by health insurance (%)
Kidney Conditions-Urology - Avg. # of times urinating at night
Medical Conditions - People with asthma (%)
Medical Conditions - People with anemia (%)
Medical Conditions - People with psoriasis (%)
Medical Conditions - People with overweight (%)
Medical Conditions - Elderly people having difficulties in thinking or remembering (%)
Medical Conditions - People who ever received blood transfusion (%)
Medical Conditions - People having trouble seeing even with glass/contacts (%)
Medical Conditions - People with arthritis (%)
Medical Conditions - People with gout (%)
Medical Conditions - People with congestive heart failure (%)
Medical Conditions - People with coronary heart disease (%)
Medical Conditions - People with angina pectoris (%)
Medical Conditions - People who ever had heart attack (%)
Medical Conditions - People who ever had stroke (%)
Medical Conditions - People with emphysema (%)
Medical Conditions - People with thyroid problem (%)
Medical Conditions - People with chronic bronchitis (%)
Medical Conditions - People with any liver condition (%)
Medical Conditions - People who ever had cancer or malignancy (%)
Mental Health - People who have little interest in doing things (%)
Mental Health - People feeling down, depressed, or hopeless (%)
Mental Health - People who have trouble sleeping or sleeping too much (%)
Mental Health - People feeling tired or having little energy (%)
Mental Health - People with poor appetite or overeating (%)
Mental Health - People feeling bad about themself (%)
Mental Health - People who have trouble concentrating on things (%)
Mental Health - People moving or speaking slowly or too fast (%)
Mental Health - People having thoughts they would be better off dead (%)
Oral Health - Average years since last visit a dentist
Oral Health - People embarrassed because of mouth (%)
Oral Health - People with gum disease (%)
Oral Health - General health of teeth and gums (%)
Oral Health - Average days a week using dental floss/device
Oral Health - Average days a week using mouthwash for dental problem
Oral Health - Average number of teeth
Pesticide Use - Households using pesticides to control insects (%)
Pesticide Use - Households using pesticides to kill weeds (%)
Physical Activity - People doing vigorous-intensity work activities (%)
Physical Activity - People doing moderate-intensity work activities (%)
Physical Activity - People walking or bicycling (%)
Physical Activity - People doing vigorous-intensity recreational activities (%)
Physical Activity - People doing moderate-intensity recreational activities (%)
Physical Activity - Average hours a day doing sedentary activities
Physical Activity - Average hours a day watching TV or videos
Physical Activity - Average hours a day using computer
Physical Functioning - People having limitations keeping them from working (%)
Physical Functioning - People limited in amount of work they can do (%)
Physical Functioning - People that need special equipment to walk (%)
Physical Functioning - People experiencing confusion/memory problems (%)
Physical Functioning - People requiring special healthcare equipment (%)
Prescription Medications - Average number of prescription medicines taking
Preventive Aspirin Use - Adults 40+ taking low-dose aspirin (%)
Reproductive Health - Vaginal deliveries (%)
Reproductive Health - Cesarean deliveries (%)
Reproductive Health - Deliveries resulted in a live birth (%)
Reproductive Health - Pregnancies resulted in a delivery (%)
Reproductive Health - Women breastfeeding newborns (%)
Reproductive Health - Women that had a hysterectomy (%)
Reproductive Health - Women that had both ovaries removed (%)
Reproductive Health - Women that have ever taken birth control pills (%)
Reproductive Health - Women taking birth control pills (%)
Reproductive Health - Women that have ever used Depo-Provera or injectables (%)
Reproductive Health - Women that have ever used female hormones (%)
Sexual Behavior - People 18+ that ever had sex (vaginal, anal, or oral) (%)
Sexual Behavior - Males 18+ that ever had vaginal sex with a woman (%)
Sexual Behavior - Males 18+ that ever performed oral sex on a woman (%)
Sexual Behavior - Males 18+ that ever had anal sex with a woman (%)
Sexual Behavior - Males 18+ that ever had any sex with a man (%)
Sexual Behavior - Females 18+ that ever had vaginal sex with a man (%)
Sexual Behavior - Females 18+ that ever performed oral sex on a man (%)
Sexual Behavior - Females 18+ that ever had anal sex with a man (%)
Sexual Behavior - Females 18+ that ever had any kind of sex with a woman (%)
Sexual Behavior - Average age people first had sex
Sexual Behavior - Average number of female sex partners in lifetime (males 18+)
Sexual Behavior - Average number of female vaginal sex partners in lifetime (males 18+)
Sexual Behavior - Average age people first performed oral sex on a woman (18+)
Sexual Behavior - Average number of woman performed oral sex on in lifetime (18+)
Sexual Behavior - Average number of male sex partners in lifetime (males 18+)
Sexual Behavior - Average number of male anal sex partners in lifetime (males 18+)
Sexual Behavior - Average age people first performed oral sex on a man (18+)
Sexual Behavior - Average number of male oral sex partners in lifetime (18+)
Sexual Behavior - People using protection when performing oral sex (%)
Sexual Behavior - Average number of times people have vaginal or anal sex a year
Sexual Behavior - People having sex without condom (%)
Sexual Behavior - Average number of male sex partners in lifetime (females 18+)
Sexual Behavior - Average number of male vaginal sex partners in lifetime (females 18+)
Sexual Behavior - Average number of female sex partners in lifetime (females 18+)
Sexual Behavior - Circumcised males 18+ (%)
Sleep Disorders - Average hours sleeping at night
Sleep Disorders - People that has trouble sleeping (%)
Smoking-Cigarette Use - People smoking cigarettes (%)
Taste & Smell - People 40+ having problems with smell (%)
Taste & Smell - People 40+ having problems with taste (%)
Taste & Smell - People 40+ that ever had wisdom teeth removed (%)
Taste & Smell - People 40+ that ever had tonsils teeth removed (%)
Taste & Smell - People 40+ that ever had a loss of consciousness because of a head injury (%)
Taste & Smell - People 40+ that ever had a broken nose or other serious injury to face or skull (%)
Taste & Smell - People 40+ that ever had two or more sinus infections (%)
Weight - Average height (inches)
Weight - Average weight (pounds)
Weight - Average BMI
Weight - People that are obese (%)
Weight - People that ever were obese (%)
Weight - People trying to lose weight (%)
According to our research of Oregon and other state lists, there were 11 registered sex offenders living in Tigard, Oregon as of April 26, 2024 . The ratio of all residents to sex offenders in Tigard is 4,770 to 1.The ratio of registered sex offenders to all residents in this city is lower than the state average.
The City-Data.com crime index weighs serious crimes and violent crimes more heavily. Higher means more crime, U.S. average is 246.1. It adjusts for the number of visitors and daily workers commuting into cities.
- means the value is smaller than the state average.
- means the value is about the same as the state average.
- means the value is bigger than the state average.
- means the value is much bigger than the state average.
Crime rate in Tigard detailed stats: murders, rapes, robberies, assaults, burglaries, thefts, arson Officers per 1,000 residents here:
1.21Oregon average:
1.48
Latest news from Tigard, OR collected exclusively by city-data.com from local newspapers, TV, and radio stations
Ancestries: English (9.5%), German (7.8%), American (7.2%), European (5.8%), Irish (4.3%), Italian (1.9%).
Current Local Time:
Land area: 10.9 square miles.
Population density: 5,134 people per square mile (average).
7,931 residents are foreign born (7.3% Asia , 2.9% Latin America , 2.4% Europe ).
This city:
14.4%Oregon:
9.8%
Median real estate property taxes paid for housing units with mortgages in 2022: $4,796 (0.8%)Median real estate property taxes paid for housing units with no mortgage in 2022: $5,280 (0.8%)
Nearest city with pop. 50,000+: Beaverton, OR
Nearest city with pop. 200,000+: Northwest Clackamas, OR (8.0 miles
Nearest city with pop. 1,000,000+: Los Angeles, CA
Nearest cities:
Latitude: 45.43 N, Longitude: 122.78 W
Daytime population change due to commuting: +10,250 (+18.6%)Workers who live and work in this city: 13,475 (45.1%)
Property values in Tigard, OR
Tigard tourist attractions:
Single-family new house construction building permits:
2022: 183 buildings , average cost: $352,2002021: 213 buildings , average cost: $307,1002020: 134 buildings , average cost: $260,5002019: 255 buildings , average cost: $276,6002018: 191 buildings , average cost: $332,9002017: 426 buildings , average cost: $278,5002016: 356 buildings , average cost: $316,0002015: 81 buildings , average cost: $324,4002014: 63 buildings , average cost: $316,7002013: 147 buildings , average cost: $256,1002012: 144 buildings , average cost: $256,1002011: 88 buildings , average cost: $281,8002010: 98 buildings , average cost: $230,8002009: 44 buildings , average cost: $286,0002008: 52 buildings , average cost: $295,1002007: 198 buildings , average cost: $259,5002006: 262 buildings , average cost: $275,6002005: 344 buildings , average cost: $243,9002004: 276 buildings , average cost: $256,2002003: 380 buildings , average cost: $215,5002002: 340 buildings , average cost: $242,9002001: 504 buildings , average cost: $220,7002000: 403 buildings , average cost: $178,9001999: 364 buildings , average cost: $141,2001998: 354 buildings , average cost: $171,2001997: 296 buildings , average cost: $181,600Unemployment in December 2023:
Population change in the 1990s: +10,605 (+34.6%).
Most common occupations in Tigard, OR (%)
Both Males Females
Sales representatives, services, wholesale and manufacturing (5.5%)
Other sales and related occupations, including supervisors (5.4%)
Other management occupations, except farmers and farm managers (5.3%)
Other office and administrative support workers, including supervisors (5.0%)
Computer specialists (4.3%)
Engineers (3.1%)
Retail sales workers, except cashiers (3.1%)
Sales representatives, services, wholesale and manufacturing (6.6%)
Other sales and related occupations, including supervisors (6.3%)
Other management occupations, except farmers and farm managers (5.8%)
Computer specialists (5.8%)
Engineers (5.1%)
Electrical equipment mechanics and other installation, maintenance, and repair workers, including supervisors (3.6%)
Top executives (3.4%)
Other office and administrative support workers, including supervisors (7.7%)
Other management occupations, except farmers and farm managers (4.8%)
Secretaries and administrative assistants (4.6%)
Other sales and related occupations, including supervisors (4.4%)
Sales representatives, services, wholesale and manufacturing (4.1%)
Preschool, kindergarten, elementary, and middle school teachers (3.8%)
Registered nurses (3.2%)
Earthquake activity:
Tigard-area historical earthquake activity is significantly above Oregon state average. It is 1454% greater than the overall U.S. average. On 4/13/1949 at 19:55:42, a magnitude 7.0 (7.0 UK, Class: Major, Intensity: VIII - XII) earthquake occurred 126.7 miles away from Tigard center, causing $80,000,000 total damage On 2/28/2001 at 18:54:32, a magnitude 6.8 (6.5 MB, 6.6 MS, 6.8 MW, Class: Strong, Intensity: VII - IX) earthquake occurred 115.4 miles away from the city center, causing $2,000,000,000 total damage and $305,000,000 insured lossesOn 2/28/2001 at 18:54:32, a magnitude 6.8 (6.8 MD, Depth: 32.2 mi) earthquake occurred 119.1 miles away from Tigard center On 4/29/1965 at 15:28:43, a magnitude 6.6 (6.6 UK) earthquake occurred 132.4 miles away from the city center, causing $28,000,000 total damage On 1/31/1922 at 13:17:28, a magnitude 7.6 (7.6 UK) earthquake occurred 355.7 miles away from the city center On 11/8/1980 at 10:27:34, a magnitude 7.2 (6.2 MB, 7.2 MS, 7.2 MW, 7.0 ML) earthquake occurred 308.3 miles away from Tigard center Magnitude types: body-wave magnitude (MB), duration magnitude (MD), local magnitude (ML), surface-wave magnitude (MS), moment magnitude (MW) Natural disasters: The number of natural disasters in Washington County (12) is smaller than the US average (15).Major Disasters (Presidential) Declared: 10Emergencies Declared: 1Floods: 6, Storms: 5, Landslides: 3, Mudslides: 3, Winds: 3, Snows: 2, Winter Storms: 2, Earthquake: 1, Fire: 1, Heavy Rain: 1, Hurricane: 1, Other: 1 (Note: some incidents may be assigned to more than one category). Hospitals and medical centers in Tigard: AVAMERE REHABILITATION OF KING CITY (16485 SW PACIFIC HIGHWAY)
PACIFIC HEALTH AND REHABILITATION (14145 SW 105TH STREET)
Other hospitals and medical centers near Tigard: ODYSSEY HEALTHCARE OF PORTLAND (Hospital, about 3 miles away; BEAVERTON, OR)
AMEDISYS HOME HEALTH CARE (Home Health Center, about 3 miles away; PORTLAND, OR)
PEARL AT KRUSE WAY, THE (Nursing Home, about 3 miles away; LAKE OSWEGO, OR)
AVAMERE REHABILITATION OF BEAVERTON (Nursing Home, about 4 miles away; BEAVERTON, OR)
MERIDIAN PARK DIALYSIS CENTER (Dialysis Facility, about 4 miles away; TUALATIN, OR)
LEGACY MERIDIAN PARK MEDICAL CENTER (about 4 miles away; TUALATIN, OR)
WEST HILLS HEALTH AND REHABILITATION CENTER (Nursing Home, about 4 miles away; PORTLAND, OR)
Amtrak stations near Tigard: 9 miles: PORTLAND (800 NW 6TH AVE.) Services: ticket office, fully wheelchair accessible, enclosed waiting area, public restrooms, public payphones, full-service food facilities, paid short-term parking, paid long-term parking, call for car rental service, taxi stand, intercity bus service, public transit connection.
10 miles: OREGON CITY (1757 WASHINGTON ST.) 15 miles: VANCOUVER (FOOT OF W. 11TH ST.) Services: ticket office, fully wheelchair accessible, enclosed waiting area, public restrooms, public payphones, vending machines, free short-term parking, free long-term parking, call for taxi service.
Colleges/Universities in Tigard: University of Phoenix-Oregon Campus Full-time enrollment: 737; Location: Triangle Corporate Park, 13221 SW 68th Pkwy; Private, for-profit; Website: www.phoenix.edu; Offers Master's degree )
Everest Institute-Tigard Full-time enrollment: 479; Location: 9600 SW Oak St, Suite 400; Private, for-profit; Website: www.everest.edu/campus/tigard)
Phagans Tigard Beauty School Full-time enrollment: 52; Location: 8820 SW Center; Private, for-profit; Website: www.phagansnw.com)
National American University-Tigard Full-time enrollment: 15; Location: 13333 South West 68th Parkway Suite 010; Private, for-profit; Website: www.national.edu/tigard)
Colleges/universities with over 2000 students nearest to Tigard:
Portland Community College (about 3 miles; Portland, OR ; Full-time enrollment: 23,600)
Lewis & Clark College (about 6 miles; Portland, OR ; FT enrollment: 2,864)
Pioneer Pacific College (about 8 miles; Wilsonville, OR ; FT enrollment: 2,194)
Portland State University (about 8 miles; Portland, OR ; FT enrollment: 21,450)
University of Portland (about 11 miles; Portland, OR ; FT enrollment: 4,030)
Concordia University-Portland (about 12 miles; Portland, OR ; FT enrollment: 3,996)
Clackamas Community College (about 13 miles; Oregon City, OR ; FT enrollment: 4,261)
Public high schools in Tigard:
Private high school in Tigard: ISLAMIC SCHOOL OF MET Students: 146, Location: 10330 SW SCHOLLS FERRY RD, Grades: PK-12)
Public elementary/middle schools in Tigard: TWALITY MIDDLE SCHOOL Students: 965, Location: 14650 SW 97TH AVE, Grades: 6-8)THOMAS R FOWLER MIDDLE SCHOOL Students: 902, Location: 10865 SW WALNUT ST, Grades: 6-8)DEER CREEK ELEMENTARY SCHOOL Students: 615, Location: 16155 SW 131ST AVE, Grades: KG-5)CHARLES F TIGARD ELEMENTARY SCHOOL Students: 599, Location: 12850 SW GRANT ST, Grades: KG-5)METZGER ELEMENTARY SCHOOL Students: 599, Location: 10350 SW LINCOLN ST, Grades: KG-5)JAMES TEMPLETON ELEMENTARY SCHOOL Students: 563, Location: 9500 SW MURDOCK ST, Grades: KG-5)ALBERTA RIDER ELEMENTARY SCHOOL Students: 547, Location: 14850 SW 132ND TER, Grades: KG-5)MARY WOODWARD ELEMENTARY SCHOOL Students: 524, Location: 12325 SW KATHERINE ST, Grades: KG-5)DURHAM ELEMENTARY SCHOOL Students: 517, Location: 7980 SW DURHAM RD, Grades: KG-5)Private elementary/middle schools in Tigard: ST ANTHONY SCHOOL Students: 374, Location: 12645 SW PACIFIC HWY, Grades: PK-8)
GAARDE CHRISTIAN SCHOOL Students: 195, Location: 11265 SW GAARDE ST, Grades: PK-8)
CHILDREN'S VILLAGE DAY SCHOOL Students: 34, Location: 10400 SW PARK ST, Grades: PK-5)
See full list of schools located in Tigard Library in Tigard: TIGARD PUBLIC LIBRARY Operating income: $3,172,100; Location: 13500 SW HALL BLVD; 142,840 books ; 35 e-books ; 18,213 audio materials ; 15,175 video materials ; 27 state licensed databases ; 27 other licensed databases ; 227 print serial subscriptions )
User-submitted facts and corrections:
Private Elementary and Middle Schools in Tigard: St. Anthony's Catholic School, PK - 8, since 1930ish. 503-639-4179.
Notable locations in Tigard: (A) , Summerfield Golf Course (B) , TriMet Washington Square Transit Center (C) , TriMet Tigard Transit Center (D) , TriMet Tigard Transit Center Park and Ride (E) , Greenburg (F) , Tigard Park and Ride (G) , Trece (H) , Cook City Park Boat Ramp (I) , Christ the King Lutheran Church Park and Ride (J) , Greton (K) , Tigard Municipal Court (L) , Tigard City Hall (M) , Broadway Rose Theatre Company New Stage Theatre (N) , Lincoln Tower Heliport (O) , Tualatin Valley Fire and Rescue Station 51 Tigard (P) , Tigard Public Works (Q) , John Tigard House Museum (R) , Tigard Public Library (S) . Display/hide their locations on the map
Shopping Centers: (1) , Tigard Towne Square Shopping Center (2) , Tigard Marketplace Center Shopping Center (3) , Greenway Town Center Shopping Center (4) , Canterbury Square Shopping Center (5) . Display/hide their locations on the map
Churches in Tigard include: (A) , Tigard Community Friends Church (B) , Tigard Covenant Church (C) , Tigard First Baptist Church (D) , Tigard First Church of Christ Scientist (E) , Tigard Foursquare Church (F) , Trinity Evangelical Church (G) , Westgate Baptist Church (H) , Word of Grace Christian Church (I) . Display/hide their locations on the map
Cemeteries: (1) , Saint Anthonys Cemetery (2) , Tigard Evangelical Cemetery (3) . Display/hide their locations on the map
Lakes and reservoirs: (A) , Stark Reservoir (B) . Display/hide their locations on the map
Creeks: (A) , Ash Creek (B) , Ball Creek (C) , Summer Creek (D) . Display/hide their locations on the map
Parks in Tigard include: (1) , Cook Park (2) , Bonita City Park (3) , Commercial City Park (4) , Fanno Creek City Park (5) , Jack City Park (6) , Liberty City Park (7) , Main Street City Park (8) , Summerlake City Park (9) . Display/hide their locations on the map
Hotels:
Birthplace of: Kaitlin Olson - Film actor, David Lucas - College basketball player (Oregon State Beavers).
Washington County has a predicted average indoor radon screening level between 2 and 4 pCi/L (pico curies per liter) - Moderate Potential Drinking water stations with addresses in Tigard and their reported violations in the past:
COUNTRY VILLA MOBILE ESTATES (Population served: 112, Groundwater):
Past monitoring violations:
Follow-up Or Routine LCR Tap M/R - In JAN-01-2012, Contaminant: Lead and Copper Rule. Follow-up actions: St Violation/Reminder Notice (FEB-28-2012), St Compliance achieved (2 times from AUG-17-2012 to AUG-17-2012)
2 regular monitoring violations
Average household size: This city:
2.5 peopleOregon:
2.5 people
Percentage of family households: This city:
65.1%Whole state:
63.4%
Percentage of households with unmarried partners: This city:
7.1%Whole state:
8.0%
Likely homosexual households (counted as self-reported same-sex unmarried-partner households)
Lesbian couples: 0.5% of all households Gay men: 0.4% of all households
People in group quarters in Tigard in 2010:
111 people in workers' group living quarters and job corps centers
86 people in group homes intended for adults
78 people in nursing facilities/skilled-nursing facilities
23 people in emergency and transitional shelters (with sleeping facilities) for people experiencing homelessness
15 people in mental (psychiatric) hospitals and psychiatric units in other hospitals
9 people in other noninstitutional facilities
8 people in group homes for juveniles (non-correctional)
7 people in residential treatment centers for adults
6 people in correctional residential facilities
4 people in residential treatment centers for juveniles (non-correctional)
People in group quarters in Tigard in 2000:
107 people in nursing homes
35 people in other group homes
35 people in other noninstitutional group quarters
34 people in homes for the mentally ill
10 people in homes or halfway houses for drug/alcohol abuse
Banks with most branches in Tigard (2011 data):
Wells Fargo Bank, National Association: Washington Square Branch, King City Branch, Portland West Business Banking Branc, Greenway Town Center Branch. Info updated 2011/04/05: Bank assets: $1,161,490.0 mil, Deposits: $905,653.0 mil, headquarters in Sioux Falls, SD, positive income , 6395 total offices , Holding Company: Wells Fargo & Company
JPMorgan Chase Bank, National Association: Tigard Town Square at 11354 Sw Druham Rd., branch established on 1992/11/02; Tigard at 11565 Sw Pacific Hwy, branch established on 1923/01/01. Info updated 2011/11/10: Bank assets: $1,811,678.0 mil, Deposits: $1,190,738.0 mil, headquarters in Columbus, OH, positive income , International Specialization, 5577 total offices , Holding Company: Jpmorgan Chase & Co.
KeyBank National Association: Tigard at 11665 Sw Pacific Hwy., branch established on 1999/08/01; Greenway Branch at 12744 Southwest North Dakota Street, branch established on 1995/06/15. Info updated 2008/03/03: Bank assets: $86,198.8 mil, Deposits: $64,214.8 mil, headquarters in Cleveland, OH, positive income , Commercial Lending Specialization, 1067 total offices , Holding Company: Keycorp
U.S. Bank National Association: Washington Square Branch at 9185 S.W. Hall Boulevard, branch established on 1972/07/10; King City Branch at 15900 Southwest 116th Avenue, branch established on 1974/09/26. Info updated 2012/01/30: Bank assets: $330,470.8 mil, Deposits: $236,091.5 mil, headquarters in Cincinnati, OH, positive income , 3121 total offices , Holding Company: U.S. Bancorp
Bank of America, National Association: Tigard Branch at 11999 Sw Pacific Hwy, branch established on 1976/10/04; King City Branch at 15905 Southwest 116th Avenue, branch established on 1890/01/01. Info updated 2009/11/18: Bank assets: $1,451,969.3 mil, Deposits: $1,077,176.8 mil, headquarters in Charlotte, NC, positive income , 5782 total offices , Holding Company: Bank Of America Corporation
Bank of the West: Tigard Towne Square Branch at 16200 S.W. Pacific Highway, branch established on 1989/06/30. Info updated 2009/11/16: Bank assets: $62,408.3 mil, Deposits: $43,995.2 mil, headquarters in San Francisco, CA, positive income , 647 total offices , Holding Company: Bnp Paribas
Washington Federal: Tigard Branch at 15444 Southwest Pacific Highway, branch established on 1996/08/12. Info updated 2011/12/19: Bank assets: $13,653.0 mil, Deposits: $8,905.8 mil, headquarters in Seattle, WA, positive income , Mortgage Lending Specialization, 174 total offices
West Coast Bank: Tigard Branch at 11675 Southwest Pacific Highway, branch established on 1994/10/19. Info updated 2010/09/16: Bank assets: $2,424.8 mil, Deposits: $1,925.6 mil, headquarters in Lake Oswego, OR, positive income , Commercial Lending Specialization, 63 total offices , Holding Company: West Coast Bancorp
Union Bank, National Association: Tigard Branch at 10998 Sw 68th Parkway, branch established on 2003/08/01. Info updated 2011/09/01: Bank assets: $88,967.5 mil, Deposits: $65,286.4 mil, headquarters in San Francisco, CA, positive income , Commercial Lending Specialization, 403 total offices , Holding Company: Mitsubishi Ufj Financial Group, Inc.
3 other banks with 3 local branches
For population 15 years and over in Tigard:
Never married: 30.8%Now married: 53.2%Separated: 0.7%Widowed: 4.0%Divorced: 11.3% For population 25 years and over in Tigard:
High school or higher: 94.9%Bachelor's degree or higher: 47.9%Graduate or professional degree: 17.0%Unemployed: 3.9%Mean travel time to work (commute): 16.1 minutes
Education Gini index (Inequality in education) Here:
10.4Oregon average:
11.6
Religion statistics for Tigard, OR (based on Washington County data)
Religion Adherents Congregations Evangelical Protestant 58,752 200 Catholic 55,886 11 Other 30,823 77 Mainline Protestant 17,404 53 Orthodox 550 1 None 366,295 -
Source: Clifford Grammich, Kirk Hadaway, Richard Houseal, Dale E.Jones, Alexei Krindatch, Richie Stanley and Richard H.Taylor. 2012. 2010 U.S.Religion Census: Religious Congregations & Membership Study. Association of Statisticians of American Religious Bodies. Jones, Dale E., et al. 2002. Congregations and Membership in the United States 2000. Nashville, TN: Glenmary Research Center. Graphs represent county-level data
Food Environment Statistics: Number of grocery stores : 75Washington County :
1.44 / 10,000 pop.State :
2.03 / 10,000 pop.
Number of supercenters and club stores : 17This county :
0.33 / 10,000 pop.State :
0.33 / 10,000 pop.
Number of convenience stores (no gas) : 74This county :
1.42 / 10,000 pop.Oregon :
2.01 / 10,000 pop.
Number of convenience stores (with gas) : 47This county :
0.90 / 10,000 pop.Oregon :
1.69 / 10,000 pop.
Number of full-service restaurants : 382This county :
7.35 / 10,000 pop.Oregon :
9.93 / 10,000 pop.
Adult diabetes rate : Washington County :
6.5%Oregon :
7.4%
Low-income preschool obesity rate : Health and Nutrition:
Average overall health of teeth and gums : This city:
47.7%State:
46.8%
People feeling badly about themselves : People not drinking alcohol at all : Average hours sleeping at night : Overweight people : This city:
32.1%State:
33.3%
General health condition : Average condition of hearing : This city:
80.1%Oregon:
78.7%
More about Health and Nutrition of Tigard, OR Residents
Local government employment and payroll (March 2022)
Function
Full-time employees
Monthly full-time payroll
Average yearly full-time wage
Part-time employees
Monthly part-time payroll
Police Protection - Officers
66 $601,087 $109,289 0 $0 Other Government Administration
44 $324,151 $88,405 3 $17,015 Other and Unallocable
40 $284,998 $85,499 0 $0 Financial Administration
37 $292,467 $94,854 0 $0 Local Libraries
18 $126,966 $84,644 37 $101,025 Parks and Recreation
15 $88,763 $71,010 4 $8,254 Police - Other
15 $92,206 $73,765 2 $4,872 Water Supply
13 $89,567 $82,677 0 $0 Sewerage
10 $59,674 $71,609 1 $2,749 Judicial and Legal
8 $52,301 $78,452 0 $0 Streets and Highways
7 $42,239 $72,410 0 $0
Totals for Government
273 $2,054,418 $90,304 47 $133,915
Tigard government finances - Expenditure in 2021 (per resident):
Construction - Regular Highways: $6,918,000 ($124.06)
Water Utilities: $2,332,000 ($41.82)Parks and Recreation: $1,645,000 ($29.50)General Public Buildings: $1,368,000 ($24.53)Sewerage: $1,266,000 ($22.70)Current Operations - Police Protection: $15,304,000 ($274.45)
Central Staff Services: $8,515,000 ($152.70)General - Other: $7,074,000 ($126.86)Water Utilities: $5,836,000 ($104.66)Financial Administration: $5,550,000 ($99.53)Sewerage: $5,055,000 ($90.65)Libraries: $3,933,000 ($70.53)Parks and Recreation: $2,389,000 ($42.84)General Public Buildings: $2,236,000 ($40.10)Regular Highways: $1,845,000 ($33.09)Protective Inspection and Regulation - Other: $1,799,000 ($32.26)Judicial and Legal Services: $692,000 ($12.41)Housing and Community Development: $172,000 ($3.08)General - Interest on Debt: $564,000 ($10.11)
Total Salaries and Wages: $25,299,000 ($453.70)
Water Utilities - Interest on Debt: $4,329,000 ($77.63)
Tigard government finances - Revenue in 2021 (per resident):
Charges - Sewerage: $7,529,000 ($135.02)
Other: $5,658,000 ($101.47)Regular Highways: $3,217,000 ($57.69)Parks and Recreation: $1,804,000 ($32.35)Federal Intergovernmental - Housing and Community Development: $1,643,000 ($29.46)
Highways: $82,000 ($1.47)Other: $33,000 ($0.59)Local Intergovernmental - General Local Government Support: $4,259,000 ($76.38)
Highways: $1,107,000 ($19.85)Public Welfare: $758,000 ($13.59)Housing and Community Development: $38,000 ($0.68)Other: $36,000 ($0.65)Miscellaneous - Fines and Forfeits: $1,488,000 ($26.68)
Interest Earnings: $842,000 ($15.10)General Revenue - Other: $449,000 ($8.05)Special Assessments: $114,000 ($2.04)Rents: $61,000 ($1.09)Donations From Private Sources: $53,000 ($0.95)Revenue - Water Utilities: $27,161,000 ($487.09)
State Intergovernmental - Highways: $4,023,000 ($72.15)
Other: $3,103,000 ($55.65)General Local Government Support: $1,992,000 ($35.72)Tax - Property: $23,629,000 ($423.75)
Public Utilities Sales: $6,981,000 ($125.19)Other License: $2,891,000 ($51.85)Occupation and Business License - Other: $810,000 ($14.53)Motor Fuels Sales: $695,000 ($12.46)Other Selective Sales: $609,000 ($10.92)Alcoholic Beverage License: $4,000 ($0.07)
Tigard government finances - Debt in 2021 (per resident):
Long Term Debt - Beginning Outstanding - Unspecified Public Purpose: $149,711,000 ($2684.82)
Outstanding Unspecified Public Purpose: $145,047,000 ($2601.18)Retired Unspecified Public Purpose: $92,344,000 ($1656.04)Issue, Unspecified Public Purpose: $87,680,000 ($1572.40)
Tigard government finances - Cash and Securities in 2021 (per resident):
Other Funds - Cash and Securities: $198,658,000 ($3562.61)
Sinking Funds - Cash and Securities: $6,852,000 ($122.88)
8.36% of this county's 2021 resident taxpayers lived in other counties in 2020 ($73,593 average adjusted gross income )
Here:
8.36%Oregon average:
8.20%
0.01% of residents moved from foreign countries ($84 average AGI )Washington County:
0.01%Oregon average:
0.01%
Top counties from which taxpayers relocated into this county between 2020 and 2021:
8.64% of this county's 2020 resident taxpayers moved to other counties in 2021 ($92,423 average adjusted gross income )
Here:
8.64%Oregon average:
8.24%
0.01% of residents moved to foreign countries ($83 average AGI )Washington County:
0.01%Oregon average:
0.00%
Top counties to which taxpayers relocated from this county between 2020 and 2021:
Businesses in Tigard, OR
Name Count Name Count
24 Hour Fitness 1 Kroger 3 7-Eleven 5 Lane Furniture 5 AT&T 4 LensCrafters 1 Abercrombie & Fitch 1 Levi Strauss & Co. 1 Abercrombie Kids 1 Little Caesars Pizza 1 Aerosoles 1 Lowe's 1 Albertsons 2 Macy's 2 American Eagle Outfitters 1 Marshalls 1 Ann Taylor 1 MasterBrand Cabinets 1 Apple Store 2 McDonald's 4 Arby's 1 Men's Wearhouse 1 Baja Fresh Mexican Grill 2 Motel 6 2 Banana Republic 1 Motherhood Maternity 1 Barnes & Noble 1 Nike 5 Baskin-Robbins 2 Nordstrom 1 Bath & Body Works 1 Office Depot 2 Bebe 1 OfficeMax 1 Bed Bath & Beyond 1 Pac Sun 1 Best Western 1 Panda Express 2 Blockbuster 1 Papa John's Pizza 1 Burger King 3 Payless 1 Cache 1 PetSmart 1 Carl\s Jr. 2 Pottery Barn 1 Chico's 2 Pottery Barn Kids 1 Cinnabon 1 Qdoba Mexican Grill 1 Cold Stone Creamery 1 Quality 1 Coldwater Creek 2 Quiznos 2 Costco 1 RadioShack 1 Crate & Barrel 1 Red Lobster 1 Cricket Wireless 1 Rite Aid 3 Curves 1 Ryder Rental & Truck Leasing 1 DHL 1 SAS Shoes 1 Discount Tire 1 SONIC Drive-In 1 Eddie Bauer 1 Safeway 1 FedEx 6 Soma Intimates 1 Firestone Complete Auto Care 1 Spencer Gifts 1 Ford 1 Sprint Nextel 1 Forever 21 1 Staples 1 GNC 3 Starbucks 11 GameStop 2 Subway 2 Gap 2 T-Mobile 3 Gymboree 2 Taco Bell 3 H&R Block 3 Talbots 1 Hilton 1 Target 1 Hollister Co. 1 The Cheesecake Factory 1 Home Depot 1 The Room Place 2 HomeTown Buffet 1 Toys"R"Us 2 Homestead Studio Suites 1 U-Haul 3 J. Jill 1 Urban Outfitters 1 J.Crew 1 Vans 3 Jack In The Box 1 Verizon Wireless 1 Jamba Juice 2 Vons 1 Jimmy John's 1 Walgreens 1 Jones New York 2 Whole Foods Market 1 Journeys 1 Z Gallerie 1 KFC 1
Strongest AM radio stations in Tigard:
KPOJ (620 AM; 50 kW; PORTLAND, OR; Owner: CITICASTERS LICENSES, L.P.)
KEX (1190 AM; 50 kW; PORTLAND, OR; Owner: CITICASTERS LICENSES, L.P.)
KKSN (1520 AM; 50 kW; OREGON CITY, OR; Owner: ENTERCOM PORTLAND LICENSE, LLC)
KXL (750 AM; 50 kW; PORTLAND, OR; Owner: ROSE CITY RADIO CORPORATION)
KOTK (1080 AM; 50 kW; PORTLAND, OR; Owner: FISHER BROADCASTING - PORTLAND RADIO, L.L.C.)
KPAM (860 AM; 50 kW; TROUTDALE, OR; Owner: PAMPLIN BROADCASTING-OREGON, INC.)
KUPL (970 AM; 5 kW; PORTLAND, OR; Owner: INFINITY RADIO OPERATIONS INC.)
KPDQ (800 AM; 1 kW; PORTLAND, OR; Owner: SALEM MEDIA OF OREGON, INC.)
KKAD (1550 AM; 50 kW; VANCOUVER, WA; Owner: PAMPLIN BROADCASTING-WASHINGTON, INC)
KBNP (1410 AM; 5 kW; PORTLAND, OR; Owner: KBNP RADIO, INC.)
KKSL (1290 AM; 10 kW; LAKE OSWEGO, OR; Owner: ABC, INC.)
KUIK (1360 AM; 5 kW; HILLSBORO, OR; Owner: DOLPHIN COMMUNICATIONS, INC.)
KLVP (1040 AM; 2 kW; TIGARD, OR; Owner: EDUCATIONAL MEDIA FOUNDATION)
Strongest FM radio stations in Tigard:
KINK (101.9 FM; PORTLAND, OR; Owner: INFINITY RADIO OPERATIONS INC.)
KKCW (103.3 FM; BEAVERTON, OR; Owner: CITICASTERS LICENSES, L.P.)
KPDQ-FM (93.7 FM; PORTLAND, OR; Owner: SALEM MEDIA OF OREGON, INC.)
KNRK (94.7 FM; CAMAS, WA; Owner: ENTERCOM PORTLAND LICENSE, LLC (DE))
KOPB-FM (91.5 FM; PORTLAND, OR; Owner: OREGON PUBLIC BROADCASTING)
KKRZ (100.3 FM; PORTLAND, OR; Owner: CITICASTERS LICENSES, L.P.)
KBOO (90.7 FM; PORTLAND, OR; Owner: THE KBOO FOUNDATION)
KWJJ-FM (99.5 FM; PORTLAND, OR; Owner: FISHER BROADCASTING - PORTLAND RADIO, L.L.C.)
KMHD (89.1 FM; GRESHAM, OR; Owner: MT. HOOD COMMUNITY COLLEGE DISTRICT)
KVMX (107.5 FM; BANKS, OR; Owner: INFINITY RADIO OPERATIONS INC.)
KGON (92.3 FM; PORTLAND, OR; Owner: ENTERCOM PORTLAND LICENSE, LLC (DE))
KKSN-FM (97.1 FM; PORTLAND, OR; Owner: ENTERCOM PORTLAND LICENSE, LLC (DE))
KXJM (95.5 FM; PORTLAND, OR; Owner: ROSE CITY RADIO CORPORATION)
KLTH (106.7 FM; LAKE OSWEGO, OR; Owner: INIFINITY RADIO OF PORTLAND INC.)
KUPL-FM (98.7 FM; PORTLAND, OR; Owner: INFINITY RADIO OF PORTLAND INC.)
KUFO-FM (101.1 FM; PORTLAND, OR; Owner: INFINITY RADIO OPERATIONS INC.)
KBVM (88.3 FM; PORTLAND, OR; Owner: CATHOLIC BROADCASTING NORTHWEST, INC)
KFIS (104.1 FM; SCAPPOOSE, OR; Owner: CARON BROADCASTING, INC.)
KRRC (104.1 FM; PORTLAND, OR; Owner: THE REED INSTITUTE)
KBPS-FM (89.9 FM; PORTLAND, OR; Owner: SCHOOL DISTRICT #1, MULTNOMAH COUNTY, OR)
TV broadcast stations around Tigard:
KATU (Channel 2; PORTLAND, OR; Owner: FISHER BROADCASTING - PORTLAND TV, L.L.C.)
KPDX (Channel 49; VANCOUVER, WA; Owner: MEREDITH CORPORATION)
KPTV (Channel 12; PORTLAND, OR; Owner: MEREDITH CORPORATION)
K57IF (Channel 57; SALEM, OR; Owner: LaGRANDE BROADCASTING, INC.)
KNMT (Channel 24; PORTLAND, OR; Owner: NATIONAL MINORITY T.V., INC.)
KOIN (Channel 6; PORTLAND, OR; Owner: EMMIS TELEVISION LICENSE CORPORATION)
KWBP-LP (Channel 4; PORTLAND, OR; Owner: TRIBUNE BROADCASTING HOLDINGS, INC.)
KGW (Channel 8; PORTLAND, OR; Owner: KING BROADCASTING COMPANY)
KOPB-TV (Channel 10; PORTLAND, OR; Owner: OREGON PUBLIC BROADCASTING)
KPXG-LP (Channel 54; PORTLAND, OR; Owner: PAXSON COMMUNICATIONS LICENSE COMPANY, LLC)
K14HN (Channel 14; VANCOUVER/CAMAS, WA; Owner: MEREDITH CORPORATION)
K18EL (Channel 18; NEWBERG/TIGARD, OR; Owner: MEREDITH CORPORATION)
KORK-CA (Channel 35; PORTLAND, OR; Owner: WATCHTV, INC.)
KPXG (Channel 22; SALEM, OR; Owner: PAXSON SALEM LICENSE, INC.)
KWBP (Channel 32; SALEM, OR; Owner: TRIBUNE BROADCAST HOLDINGS, INC.)
K58CO (Channel 58; PORTLAND, OR; Owner: NORTHWEST CHRISTIAN BROADCASTING)
KOXO-CA (Channel 51; NEWBERG, OR; Owner: WATCHTV, INC.)
K16CB (Channel 16; HAPPY VALLEY, OR; Owner: MEREDITH CORPORATION)
KKEI-CA (Channel 56; PORTLAND, OR; Owner: WATCHTV, INC.)
National Bridge Inventory (NBI) Statistics 33 Number of bridges479ft / 146m Total length $12,658,000 Total costs1,405,646 Total average daily traffic94,819 Total average daily truck traffic
New bridges - historical statistics
2 1940-1949 1 1950-1959 8 1960-1969 8 1970-1979 5 1980-1989 6 1990-1999 3 2000-2009
See full National Bridge Inventory statistics for Tigard, OR
Home Mortgage Disclosure Act Aggregated Statistics For Year 2009(Based on 5 full and 4 partial tracts) A) FHA, FSA/RHS & VA B) Conventional C) Refinancings D) Home Improvement Loans E) Loans on Dwellings For 5+ Families F) Non-occupant Loans on G) Loans On Manufactured Number Average Value Number Average Value Number Average Value Number Average Value Number Average Value Number Average Value Number Average Value
LOANS ORIGINATED 182 $255,544 220 $246,622 1,475 $222,026 28 $182,842 5 $2,363,002 68 $189,130 3 $139,667 APPLICATIONS APPROVED, NOT ACCEPTED 27 $238,114 25 $273,567 149 $232,704 7 $127,176 0 $0 10 $215,351 0 $0 APPLICATIONS DENIED 30 $252,462 26 $229,226 355 $242,798 25 $75,139 0 $0 20 $193,870 1 $7,600 APPLICATIONS WITHDRAWN 80 $226,084 134 $239,868 290 $243,909 7 $95,780 0 $0 32 $227,459 1 $151,260 FILES CLOSED FOR INCOMPLETENESS 1 $207,350 4 $218,315 79 $235,281 3 $165,250 0 $0 3 $210,840 0 $0
Aggregated Statistics For Year 2008(Based on 5 full and 4 partial tracts) A) FHA, FSA/RHS & VA B) Conventional C) Refinancings D) Home Improvement Loans E) Loans on Dwellings For 5+ Families F) Non-occupant Loans on G) Loans On Manufactured Number Average Value Number Average Value Number Average Value Number Average Value Number Average Value Number Average Value Number Average Value
LOANS ORIGINATED 103 $257,189 330 $257,761 723 $232,494 52 $88,167 3 $4,893,410 71 $207,628 5 $124,128 APPLICATIONS APPROVED, NOT ACCEPTED 8 $257,530 31 $251,636 135 $230,978 7 $128,343 0 $0 14 $156,278 2 $89,570 APPLICATIONS DENIED 34 $265,554 73 $250,314 309 $251,048 33 $97,820 1 $217,000 36 $209,928 1 $141,240 APPLICATIONS WITHDRAWN 19 $233,269 73 $253,122 184 $248,503 21 $134,130 0 $0 18 $235,929 3 $100,273 FILES CLOSED FOR INCOMPLETENESS 3 $220,583 7 $409,921 30 $275,166 5 $115,406 0 $0 1 $239,130 0 $0
Aggregated Statistics For Year 2007(Based on 5 full and 4 partial tracts) A) FHA, FSA/RHS & VA B) Conventional C) Refinancings D) Home Improvement Loans E) Loans on Dwellings For 5+ Families F) Non-occupant Loans on G) Loans On Manufactured Number Average Value Number Average Value Number Average Value Number Average Value Number Average Value Number Average Value Number Average Value
LOANS ORIGINATED 21 $279,196 752 $229,390 969 $209,146 103 $124,649 10 $1,240,852 117 $211,186 6 $83,218 APPLICATIONS APPROVED, NOT ACCEPTED 0 $0 126 $211,999 205 $211,699 17 $121,081 1 $8,520 24 $202,726 4 $54,100 APPLICATIONS DENIED 2 $260,000 120 $209,204 388 $223,222 52 $100,063 0 $0 28 $215,042 9 $74,723 APPLICATIONS WITHDRAWN 4 $262,682 96 $207,984 215 $226,726 18 $143,694 1 $571,900 13 $253,071 1 $234,160 FILES CLOSED FOR INCOMPLETENESS 0 $0 14 $289,835 69 $218,790 7 $121,230 0 $0 5 $206,370 1 $42,250
Aggregated Statistics For Year 2006(Based on 5 full and 4 partial tracts) A) FHA, FSA/RHS & VA B) Conventional C) Refinancings D) Home Improvement Loans E) Loans on Dwellings For 5+ Families F) Non-occupant Loans on G) Loans On Manufactured Number Average Value Number Average Value Number Average Value Number Average Value Number Average Value Number Average Value Number Average Value
LOANS ORIGINATED 14 $218,936 1,210 $189,447 1,132 $189,455 112 $93,327 9 $2,997,109 199 $180,895 6 $149,857 APPLICATIONS APPROVED, NOT ACCEPTED 2 $302,515 172 $165,596 220 $189,770 20 $101,253 0 $0 35 $194,271 2 $49,225 APPLICATIONS DENIED 4 $272,582 208 $191,144 371 $206,262 64 $86,048 0 $0 40 $290,618 9 $109,922 APPLICATIONS WITHDRAWN 1 $180,520 144 $186,277 319 $199,185 16 $52,731 0 $0 33 $182,742 4 $258,112 FILES CLOSED FOR INCOMPLETENESS 0 $0 26 $163,809 88 $206,763 1 $99,110 0 $0 5 $149,898 0 $0
Aggregated Statistics For Year 2005(Based on 5 full and 4 partial tracts) A) FHA, FSA/RHS & VA B) Conventional C) Refinancings D) Home Improvement Loans E) Loans on Dwellings For 5+ Families F) Non-occupant Loans on G) Loans On Manufactured Number Average Value Number Average Value Number Average Value Number Average Value Number Average Value Number Average Value Number Average Value
LOANS ORIGINATED 19 $199,394 1,433 $172,393 1,321 $177,255 100 $100,522 15 $1,517,281 213 $166,120 8 $80,144 APPLICATIONS APPROVED, NOT ACCEPTED 0 $0 213 $162,404 199 $173,609 13 $85,115 0 $0 32 $164,967 10 $51,775 APPLICATIONS DENIED 4 $170,552 200 $157,580 507 $177,289 55 $91,063 2 $1,259,500 43 $163,881 6 $41,703 APPLICATIONS WITHDRAWN 0 $0 177 $156,718 407 $184,351 33 $184,046 0 $0 33 $176,258 4 $88,930 FILES CLOSED FOR INCOMPLETENESS 0 $0 39 $138,466 100 $197,724 3 $187,883 0 $0 4 $183,465 0 $0
Aggregated Statistics For Year 2004(Based on 5 full and 4 partial tracts) A) FHA, FSA/RHS & VA B) Conventional C) Refinancings D) Home Improvement Loans E) Loans on Dwellings For 5+ Families F) Non-occupant Loans on G) Loans On Manufactured Number Average Value Number Average Value Number Average Value Number Average Value Number Average Value Number Average Value Number Average Value
LOANS ORIGINATED 41 $171,745 1,105 $156,600 1,135 $159,450 48 $102,322 6 $2,773,602 163 $149,363 2 $122,560 APPLICATIONS APPROVED, NOT ACCEPTED 4 $132,682 144 $140,871 212 $162,643 20 $111,004 0 $0 30 $197,371 5 $57,866 APPLICATIONS DENIED 8 $147,742 174 $140,270 391 $163,627 54 $74,056 0 $0 37 $153,984 11 $88,085 APPLICATIONS WITHDRAWN 6 $186,247 113 $154,869 330 $173,695 13 $97,510 2 $1,323,215 26 $162,287 2 $189,975 FILES CLOSED FOR INCOMPLETENESS 4 $160,678 36 $146,872 52 $177,758 8 $86,246 0 $0 9 $169,464 0 $0
Aggregated Statistics For Year 2003(Based on 5 full and 4 partial tracts) A) FHA, FSA/RHS & VA B) Conventional C) Refinancings D) Home Improvement Loans E) Loans on Dwellings For 5+ Families F) Non-occupant Loans on Number Average Value Number Average Value Number Average Value Number Average Value Number Average Value Number Average Value
LOANS ORIGINATED 69 $171,252 1,065 $155,996 3,134 $153,963 48 $38,140 10 $1,004,603 220 $134,736 APPLICATIONS APPROVED, NOT ACCEPTED 4 $161,560 120 $148,854 330 $157,929 15 $37,361 0 $0 19 $178,404 APPLICATIONS DENIED 9 $166,424 132 $125,351 527 $160,191 29 $40,354 0 $0 51 $146,346 APPLICATIONS WITHDRAWN 5 $161,800 78 $155,369 433 $159,894 5 $50,886 0 $0 22 $154,905 FILES CLOSED FOR INCOMPLETENESS 5 $154,624 27 $151,346 71 $148,134 8 $31,406 0 $0 5 $140,310
Aggregated Statistics For Year 2002(Based on 4 full and 2 partial tracts) A) FHA, FSA/RHS & VA B) Conventional C) Refinancings D) Home Improvement Loans E) Loans on Dwellings For 5+ Families F) Non-occupant Loans on Number Average Value Number Average Value Number Average Value Number Average Value Number Average Value Number Average Value
LOANS ORIGINATED 77 $150,662 471 $136,013 1,237 $140,748 39 $34,324 6 $1,138,707 117 $126,322 APPLICATIONS APPROVED, NOT ACCEPTED 6 $111,165 61 $143,262 134 $146,018 16 $25,643 0 $0 16 $155,084 APPLICATIONS DENIED 16 $147,796 77 $136,785 215 $132,519 16 $23,598 3 $1,432,960 26 $146,738 APPLICATIONS WITHDRAWN 9 $151,858 36 $119,345 193 $140,159 10 $47,234 1 $985,070 19 $126,243 FILES CLOSED FOR INCOMPLETENESS 5 $96,438 19 $111,346 63 $149,192 4 $11,950 0 $0 3 $101,790
Aggregated Statistics For Year 2001(Based on 4 full and 2 partial tracts) A) FHA, FSA/RHS & VA B) Conventional C) Refinancings D) Home Improvement Loans E) Loans on Dwellings For 5+ Families F) Non-occupant Loans on Number Average Value Number Average Value Number Average Value Number Average Value Number Average Value Number Average Value
LOANS ORIGINATED 128 $155,946 411 $135,654 956 $137,527 51 $25,297 8 $1,333,881 92 $126,044 APPLICATIONS APPROVED, NOT ACCEPTED 7 $155,931 49 $143,450 105 $130,254 16 $25,648 0 $0 6 $116,785 APPLICATIONS DENIED 10 $154,167 52 $112,988 179 $121,519 35 $29,315 0 $0 16 $128,207 APPLICATIONS WITHDRAWN 10 $157,475 42 $142,567 164 $133,159 12 $49,235 3 $808,403 8 $88,789 FILES CLOSED FOR INCOMPLETENESS 2 $150,500 15 $98,463 49 $139,294 6 $51,532 0 $0 1 $109,140
Aggregated Statistics For Year 2000(Based on 4 full and 2 partial tracts) A) FHA, FSA/RHS & VA B) Conventional C) Refinancings D) Home Improvement Loans E) Loans on Dwellings For 5+ Families F) Non-occupant Loans on Number Average Value Number Average Value Number Average Value Number Average Value Number Average Value Number Average Value
LOANS ORIGINATED 99 $153,489 440 $139,606 188 $113,451 74 $24,651 2 $855,000 50 $125,384 APPLICATIONS APPROVED, NOT ACCEPTED 2 $112,620 35 $125,415 49 $105,354 15 $19,550 0 $0 6 $143,280 APPLICATIONS DENIED 14 $129,891 84 $114,250 89 $106,405 55 $25,034 1 $131,000 9 $112,272 APPLICATIONS WITHDRAWN 16 $138,896 48 $140,629 61 $108,203 13 $62,061 0 $0 5 $147,882 FILES CLOSED FOR INCOMPLETENESS 4 $144,070 16 $128,830 32 $136,237 0 $0 1 $131,000 3 $168,187
Aggregated Statistics For Year 1999(Based on 3 full and 5 partial tracts) A) FHA, FSA/RHS & VA B) Conventional C) Refinancings D) Home Improvement Loans E) Loans on Dwellings For 5+ Families F) Non-occupant Loans on Number Average Value Number Average Value Number Average Value Number Average Value Number Average Value Number Average Value
LOANS ORIGINATED 126 $151,419 702 $143,321 738 $124,979 130 $18,814 8 $487,038 84 $109,327 APPLICATIONS APPROVED, NOT ACCEPTED 12 $150,217 81 $139,365 138 $197,252 27 $13,905 2 $979,815 18 $659,768 APPLICATIONS DENIED 10 $141,369 133 $116,772 207 $129,362 53 $27,913 0 $0 17 $142,707 APPLICATIONS WITHDRAWN 14 $141,673 82 $132,794 121 $121,203 14 $94,126 0 $0 16 $144,902 FILES CLOSED FOR INCOMPLETENESS 7 $140,997 34 $142,852 51 $141,802 1 $22,120 0 $0 3 $199,550
Detailed mortgage data for all 9 tracts in Tigard, OR
Private Mortgage Insurance Companies Aggregated Statistics For Year 2009(Based on 5 full and 4 partial tracts) A) Conventional B) Refinancings C) Non-occupant Loans on Number Average Value Number Average Value Number Average Value
LOANS ORIGINATED 40 $260,984 22 $284,873 0 $0 APPLICATIONS APPROVED, NOT ACCEPTED 17 $300,795 10 $306,842 0 $0 APPLICATIONS DENIED 10 $243,253 3 $262,777 1 $143,280 APPLICATIONS WITHDRAWN 3 $275,667 2 $235,135 0 $0 FILES CLOSED FOR INCOMPLETENESS 1 $487,360 0 $0 0 $0
Aggregated Statistics For Year 2008(Based on 5 full and 4 partial tracts) A) Conventional B) Refinancings C) Non-occupant Loans on Number Average Value Number Average Value Number Average Value
LOANS ORIGINATED 108 $270,142 52 $289,577 2 $235,500 APPLICATIONS APPROVED, NOT ACCEPTED 19 $250,199 23 $289,758 2 $218,855 APPLICATIONS DENIED 9 $237,037 6 $304,838 1 $416,130 APPLICATIONS WITHDRAWN 7 $295,920 10 $314,709 1 $214,000 FILES CLOSED FOR INCOMPLETENESS 4 $248,495 1 $214,000 1 $353,840
Aggregated Statistics For Year 2007(Based on 5 full and 4 partial tracts) A) Conventional B) Refinancings C) Non-occupant Loans on Number Average Value Number Average Value Number Average Value
LOANS ORIGINATED 128 $266,920 58 $279,778 4 $251,905 APPLICATIONS APPROVED, NOT ACCEPTED 11 $315,095 6 $309,412 0 $0 APPLICATIONS DENIED 0 $0 3 $306,307 0 $0 APPLICATIONS WITHDRAWN 7 $314,390 2 $370,000 0 $0 FILES CLOSED FOR INCOMPLETENESS 1 $283,920 0 $0 0 $0
Aggregated Statistics For Year 2006(Based on 4 full and 4 partial tracts) A) Conventional B) Refinancings C) Non-occupant Loans on Number Average Value Number Average Value Number Average Value
LOANS ORIGINATED 46 $243,365 28 $256,558 5 $307,218 APPLICATIONS APPROVED, NOT ACCEPTED 11 $289,299 12 $256,916 1 $272,000 APPLICATIONS DENIED 0 $0 0 $0 0 $0 APPLICATIONS WITHDRAWN 6 $333,610 2 $236,940 1 $251,000 FILES CLOSED FOR INCOMPLETENESS 2 $256,000 0 $0 2 $256,000
Aggregated Statistics For Year 2005(Based on 4 full and 4 partial tracts) A) Conventional B) Refinancings C) Non-occupant Loans on Number Average Value Number Average Value Number Average Value
LOANS ORIGINATED 57 $223,474 43 $209,331 3 $282,607 APPLICATIONS APPROVED, NOT ACCEPTED 16 $237,714 14 $199,792 1 $344,930 APPLICATIONS DENIED 0 $0 1 $319,000 0 $0 APPLICATIONS WITHDRAWN 2 $271,365 0 $0 0 $0 FILES CLOSED FOR INCOMPLETENESS 0 $0 0 $0 0 $0
Aggregated Statistics For Year 2004(Based on 5 full and 4 partial tracts) A) Conventional B) Refinancings C) Non-occupant Loans on Number Average Value Number Average Value Number Average Value
LOANS ORIGINATED 89 $199,136 52 $187,483 6 $200,855 APPLICATIONS APPROVED, NOT ACCEPTED 17 $188,088 25 $174,984 4 $167,655 APPLICATIONS DENIED 0 $0 1 $199,000 0 $0 APPLICATIONS WITHDRAWN 5 $172,516 5 $202,060 1 $128,000 FILES CLOSED FOR INCOMPLETENESS 1 $265,000 0 $0 1 $265,000
Aggregated Statistics For Year 2003(Based on 5 full and 4 partial tracts) A) Conventional B) Refinancings C) Non-occupant Loans on Number Average Value Number Average Value Number Average Value
LOANS ORIGINATED 142 $190,254 200 $181,532 9 $139,368 APPLICATIONS APPROVED, NOT ACCEPTED 23 $193,461 37 $181,254 4 $198,030 APPLICATIONS DENIED 1 $276,850 1 $219,400 0 $0 APPLICATIONS WITHDRAWN 2 $144,805 7 $149,639 0 $0 FILES CLOSED FOR INCOMPLETENESS 0 $0 2 $141,960 0 $0
Aggregated Statistics For Year 2002(Based on 4 full and 2 partial tracts) A) Conventional B) Refinancings C) Non-occupant Loans on Number Average Value Number Average Value Number Average Value
LOANS ORIGINATED 98 $170,993 115 $179,658 8 $145,925 APPLICATIONS APPROVED, NOT ACCEPTED 13 $164,797 19 $162,311 1 $131,000 APPLICATIONS DENIED 6 $176,667 2 $149,700 2 $139,500 APPLICATIONS WITHDRAWN 7 $152,106 5 $199,230 1 $120,000 FILES CLOSED FOR INCOMPLETENESS 0 $0 0 $0 0 $0
Aggregated Statistics For Year 2001(Based on 4 full and 2 partial tracts) A) Conventional B) Refinancings C) Non-occupant Loans on Number Average Value Number Average Value Number Average Value
LOANS ORIGINATED 110 $163,035 86 $167,663 5 $156,332 APPLICATIONS APPROVED, NOT ACCEPTED 20 $170,904 21 $176,829 3 $174,690 APPLICATIONS DENIED 7 $145,133 6 $159,175 2 $89,585 APPLICATIONS WITHDRAWN 3 $116,657 1 $172,000 0 $0 FILES CLOSED FOR INCOMPLETENESS 0 $0 1 $77,800 0 $0
Aggregated Statistics For Year 2000(Based on 4 full and 2 partial tracts) A) Conventional B) Refinancings C) Non-occupant Loans on Number Average Value Number Average Value Number Average Value
LOANS ORIGINATED 116 $158,594 22 $165,086 7 $149,241 APPLICATIONS APPROVED, NOT ACCEPTED 10 $148,453 8 $155,292 0 $0 APPLICATIONS DENIED 5 $151,808 3 $142,597 0 $0 APPLICATIONS WITHDRAWN 6 $146,653 2 $148,500 1 $99,630 FILES CLOSED FOR INCOMPLETENESS 1 $189,000 0 $0 0 $0
Aggregated Statistics For Year 1999(Based on 3 full and 5 partial tracts) A) Conventional B) Refinancings C) Non-occupant Loans on Number Average Value Number Average Value Number Average Value
LOANS ORIGINATED 230 $167,665 81 $155,593 5 $128,894 APPLICATIONS APPROVED, NOT ACCEPTED 18 $175,064 15 $154,149 0 $0 APPLICATIONS DENIED 11 $172,422 5 $161,852 1 $57,190 APPLICATIONS WITHDRAWN 4 $187,195 4 $140,540 1 $128,070 FILES CLOSED FOR INCOMPLETENESS 3 $123,557 0 $0 0 $0
Fire-safe hotels and motels in Tigard, Oregon:
Motel 6, 17950 SW Mcewan Rd, Tigard, Oregon 97224 Phone: (503) 620-2066, Fax: (503) 639-7096
Courtyard By Marriott Portland Tigard, 15686 SW Sequoia Pkwy, Tigard, Oregon 97224 Phone: (503) 684-7900, Fax: (503) 620-3142
Phoenix Inn & Suites - Tigard, 9575 SW Locust St, Tigard, Oregon 97223 Phone: (503) 624-9000, Fax: (503) 624-8184
The Grand Hotel At Bridgeport, 7265 SW Hazelfern Rd, Tigard, Oregon 97224 Phone: (503) 968-5757, Fax: (503) 968-5755
All 4 fire-safe hotels and motels in Tigard, Oregon Tigard compared to Oregon state average:
Unemployed percentage significantly below state average. Foreign-born population percentage above state average. Length of stay since moving in above state average. House age below state average. Percentage of population with a bachelor's degree or higher above state average.
#26 on the list of "Top 101 cities with the most residents born in Other Central America (population 500+)"
#32 on the list of "Top 101 cities with the lowest minimum monthly sunshine amount (population 50,000+)"
#36 on the list of "Top 101 cities with the lowest number of assaults per 100,000 residents (population 50,000+)"
#39 on the list of "Top 101 cities with the lowest average sunshine amount (population 50,000+)"
#59 on the list of "Top 101 cities with the highest ratio of rapes to murders between 2002 and 2012 (population 50,000+)"
#64 on the list of "Top 101 cities with the most residents born in Other Northern Africa (population 500+)"
#82 on the list of "Top 101 cities with the largest city-data.com crime index decrease from 2002 to 2012 (population 50,000+)"
#85 on the list of "Top 101 cities with largest percentage of females in industries: construction (population 50,000+)"
#88 on the list of "Top 101 cities with largest percentage of females in industries: manufacturing (population 50,000+)"
#90 on the list of "Top 101 cities that people commute into (largest positive percentage daily daytime population change due to commuting) (population 50,000+)"
#94 on the list of "Top 101 cities with the largest sunshine amount differences during a year (population 50,000+)"
#99 on the list of "Top 101 cities with largest percentage of males in occupations: sales and related occupations (population 50,000+)"
#100 on the list of "Top 101 cities with largest percentage of males in occupations: architecture and engineering occupations (population 50,000+)"
#83 (97223) on the list of "Top 101 zip codes with the most finance and insurance companies in 2005"
#9 on the list of "Top 101 counties with the highest percentage of residents that exercised in the past month"
#32 on the list of "Top 101 counties with the largest increase in the number of infant deaths per 1000 residents 2000-2006 to 2007-2013 (pop. 50,000+)"
#42 on the list of "Top 101 counties with the largest number of children under 18 without health insurance coverage in 2000 (pop. 50,000+)"
#47 on the list of "Top 101 counties with the lowest number of infant deaths per 1000 residents 2007-2013 (pop. 50,000+)"
#49 on the list of "Top 101 counties with the lowest percentage of residents that smoked 100+ cigarettes in their lives"
Top Patent Applicants
Saurabh Dadu (73)
Lee D. Peyton (52)
Gary D. Mccormack (47)
Barnes Cooper (42)
Perry W. Auger (40)
Gregory William Dalcher (29)
Muhammad M. Khellah (23)
Willard M. Wiseman (22)
Mario A. Lafortune (21)
John Hurd (19)
Total of 1525 patent applications in 2008-2024.

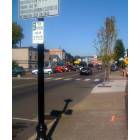
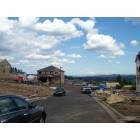
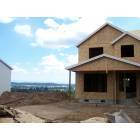
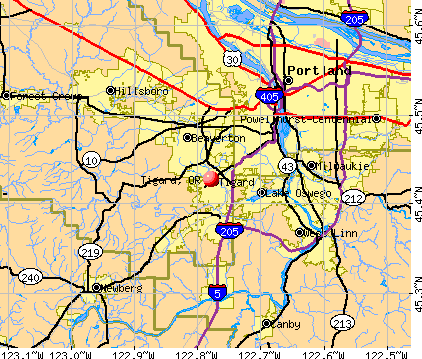


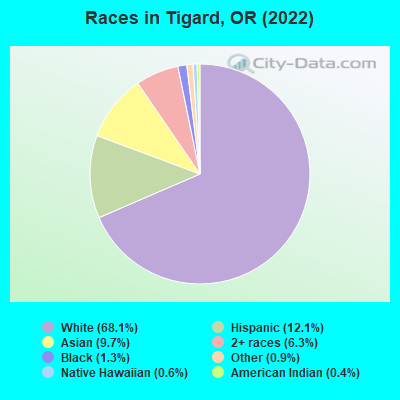
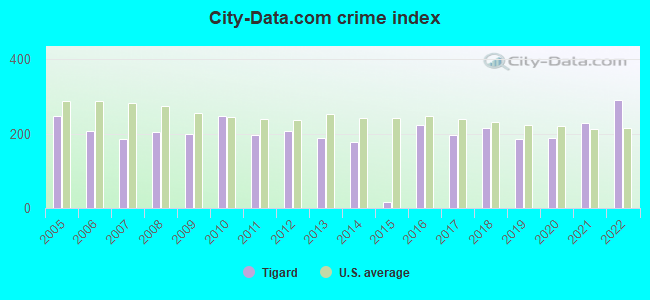
 Recent articles from our blog. Our writers, many of them Ph.D. graduates or candidates, create easy-to-read articles on a wide variety of topics.

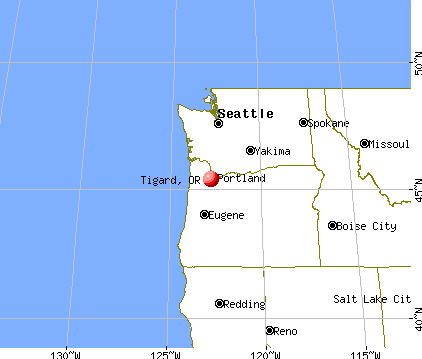
 (3.9 miles
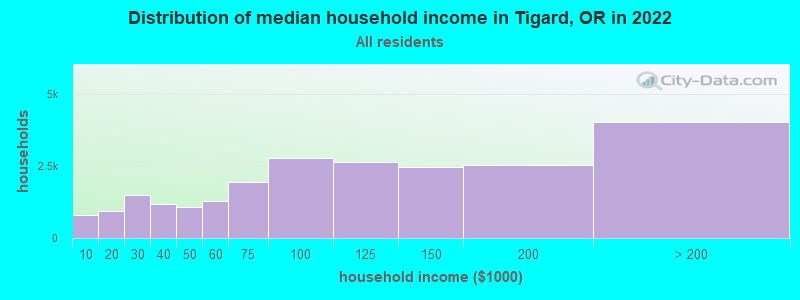
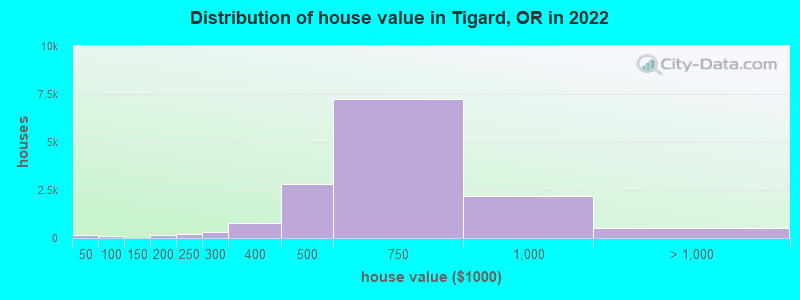

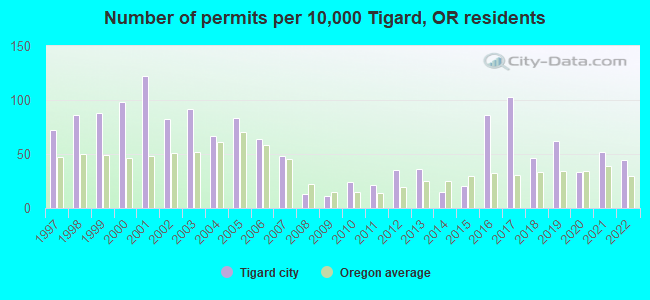
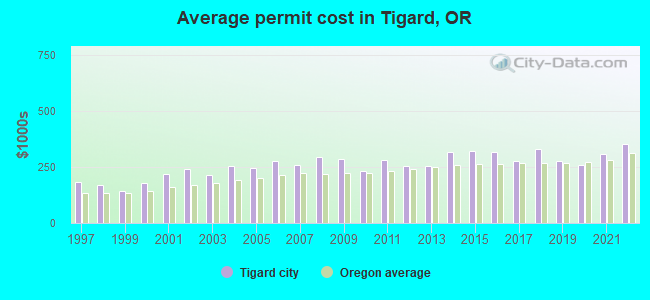
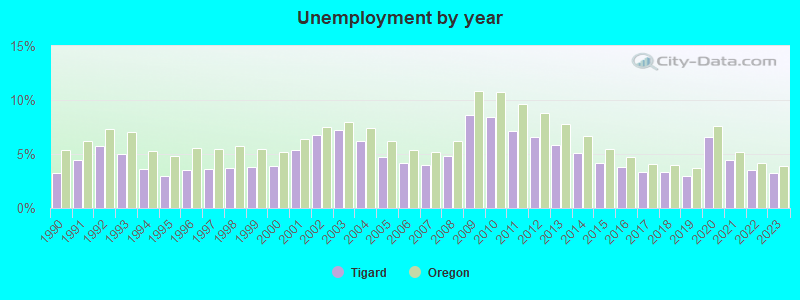
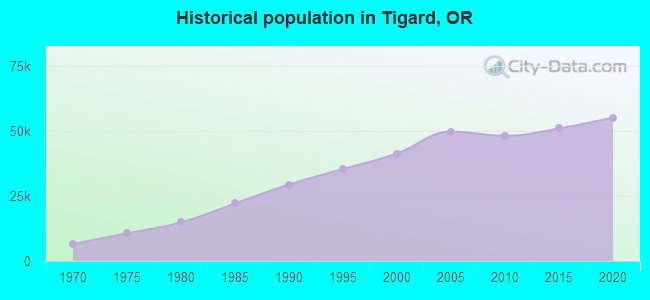

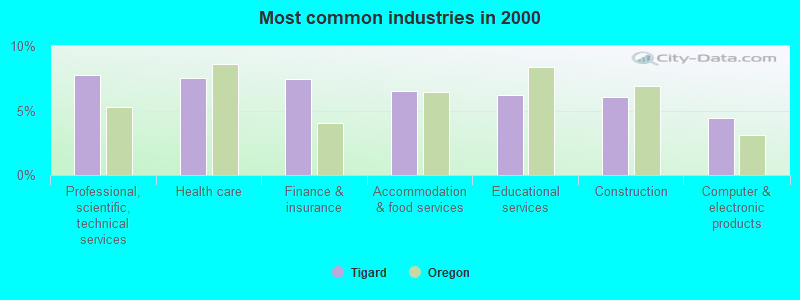
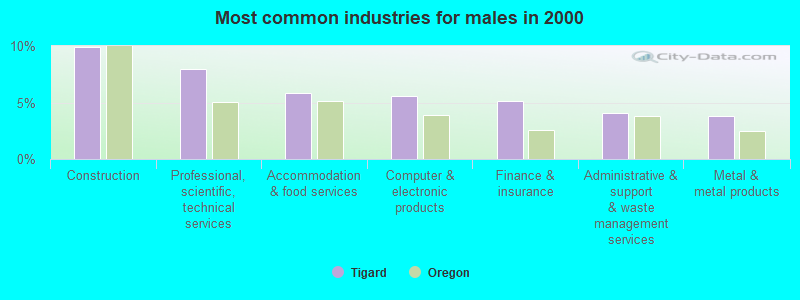
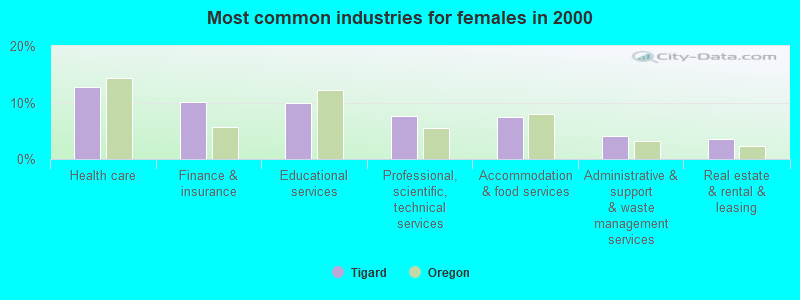
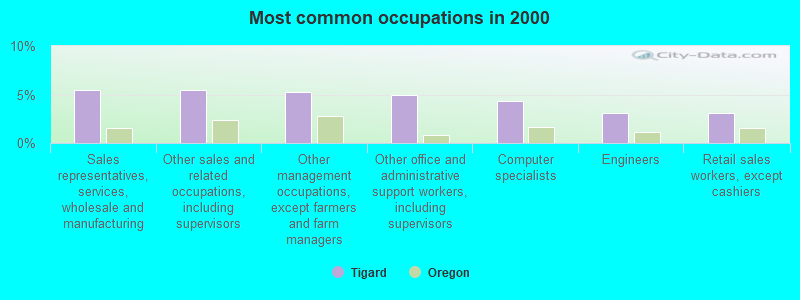
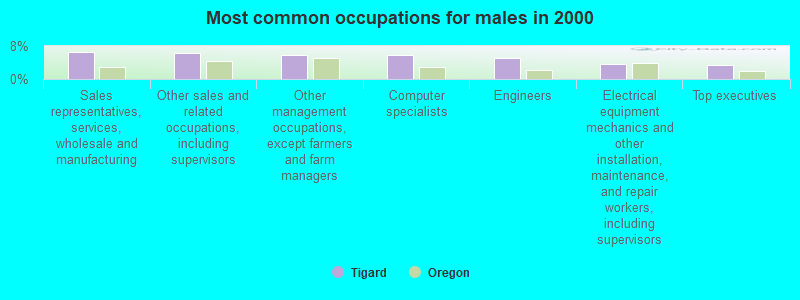
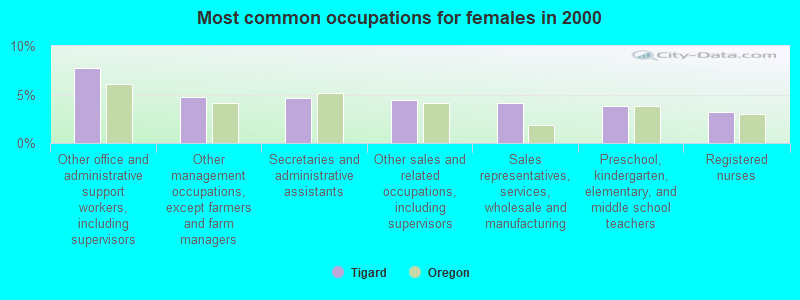

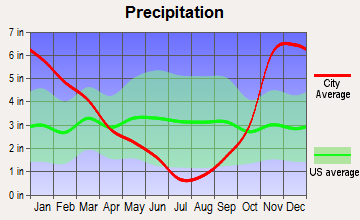
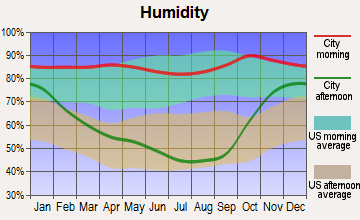
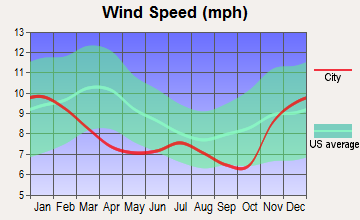
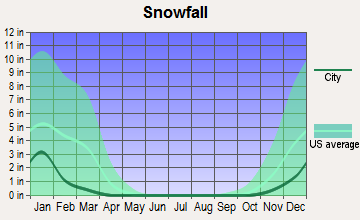
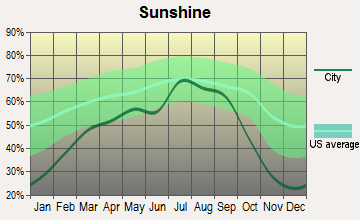
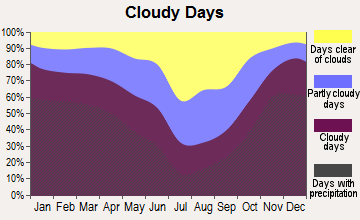
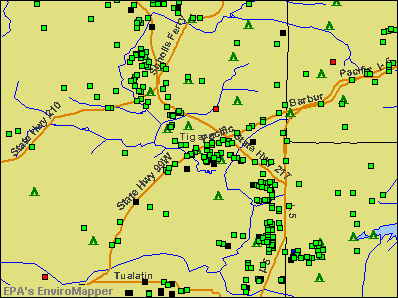

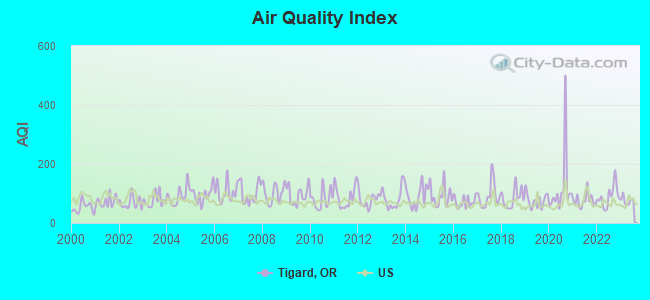
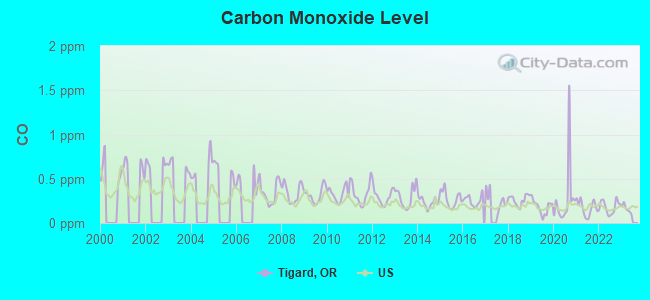
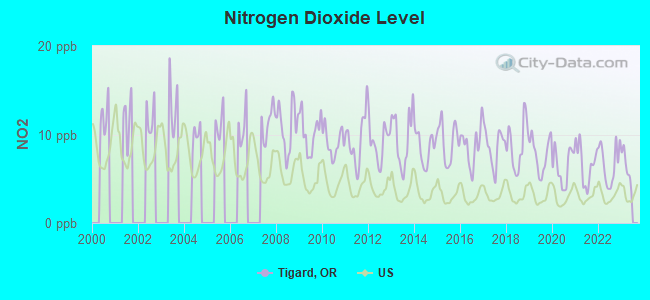
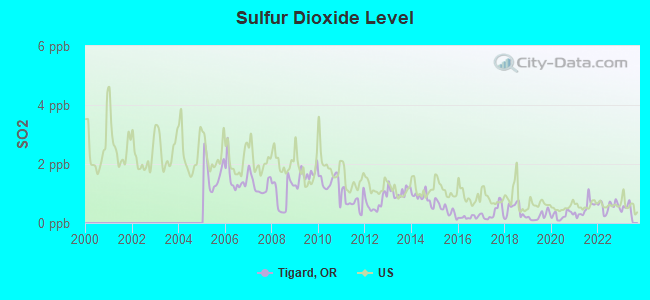
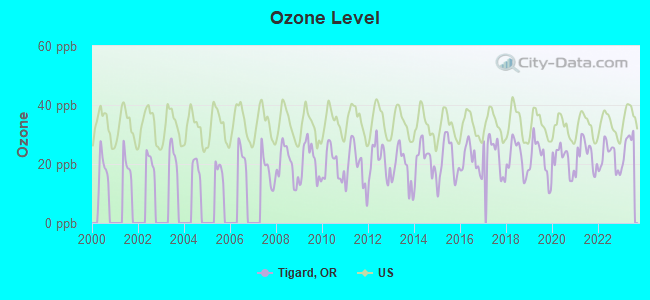
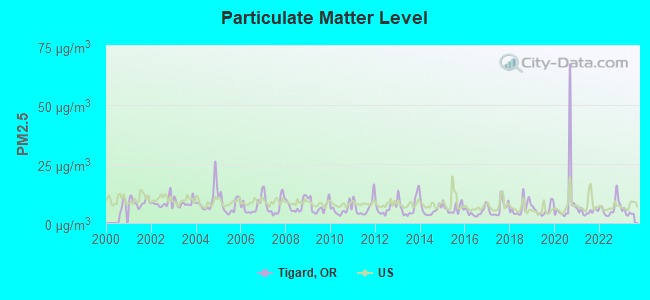
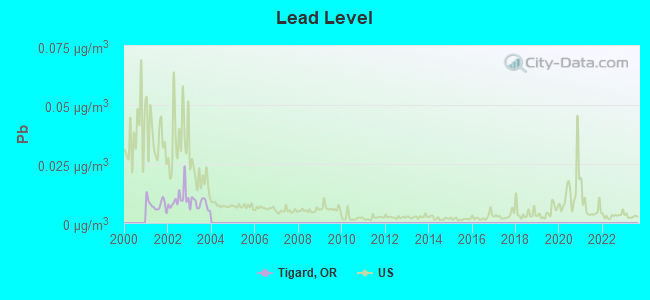
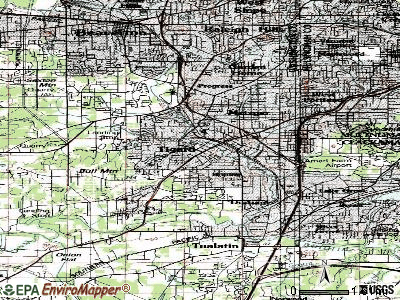
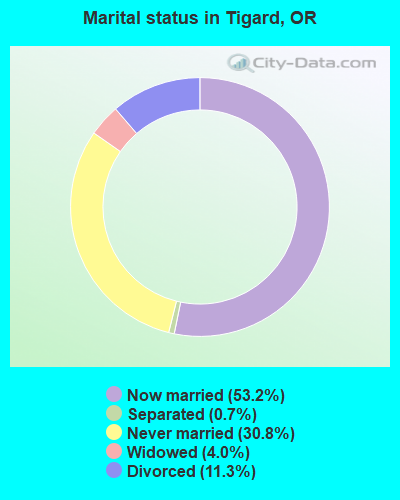
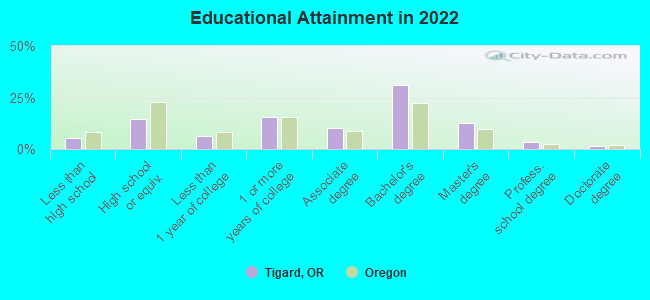
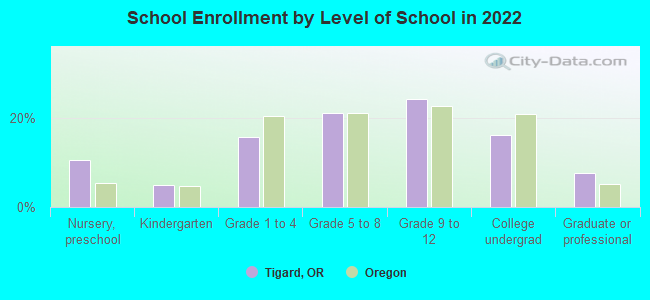
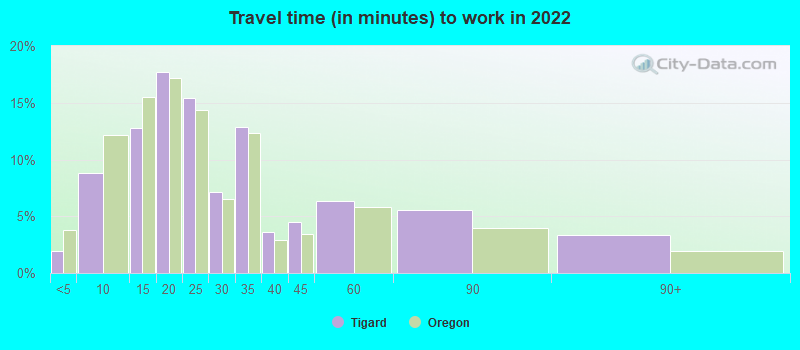
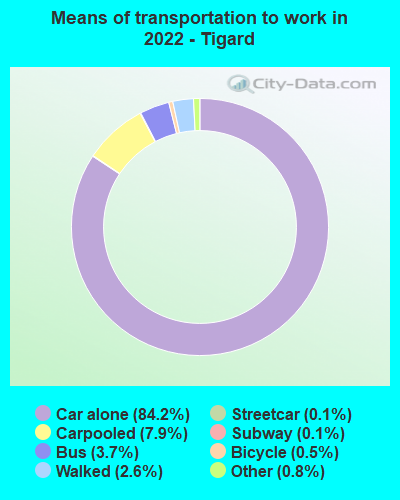
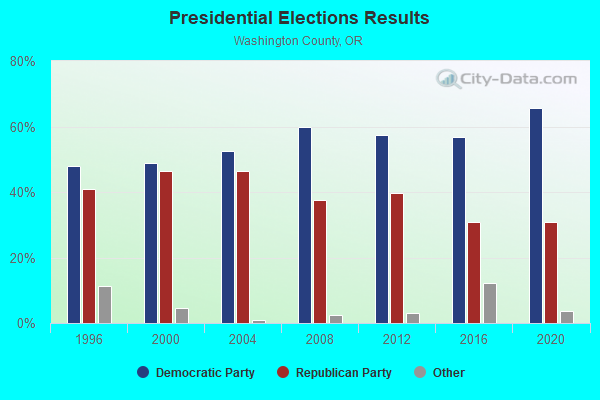
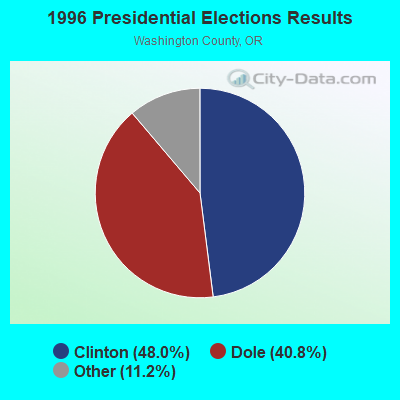
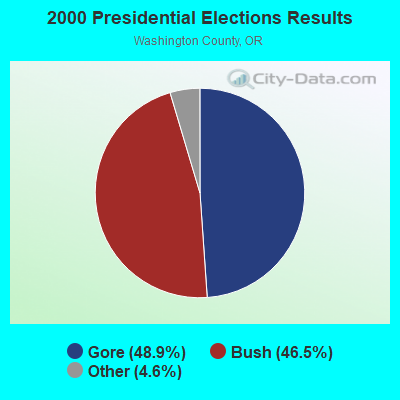
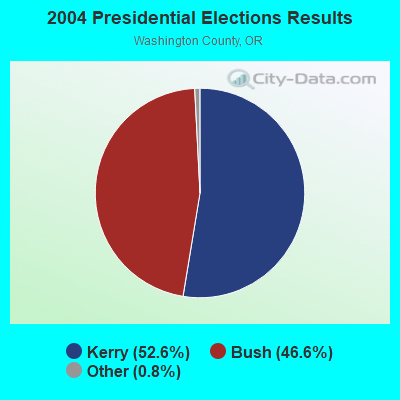
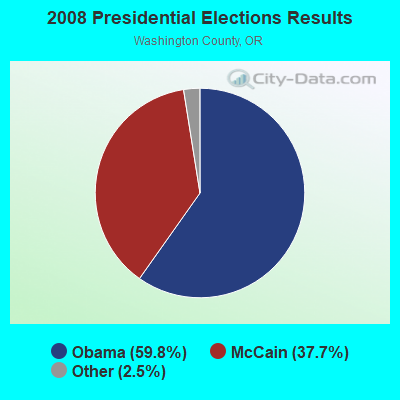
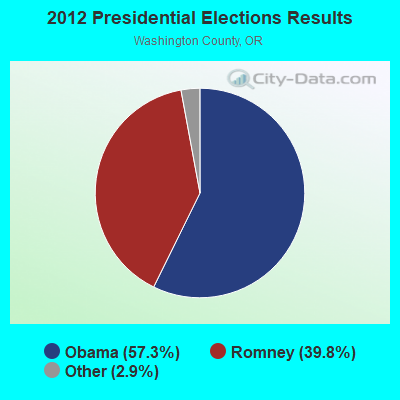
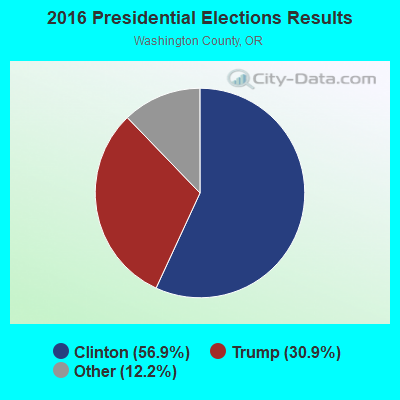
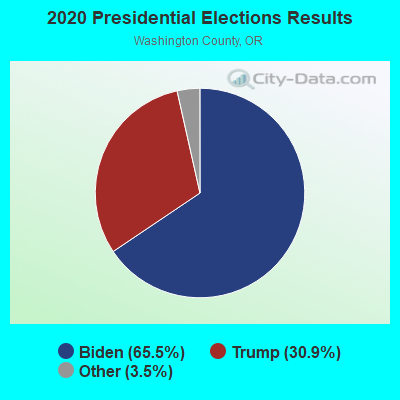
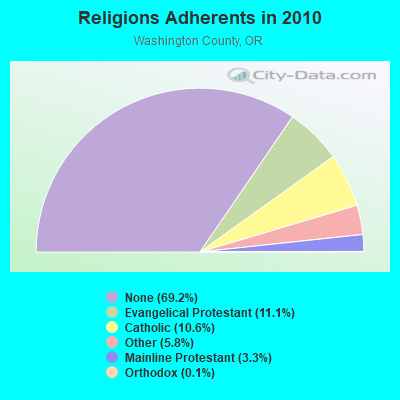
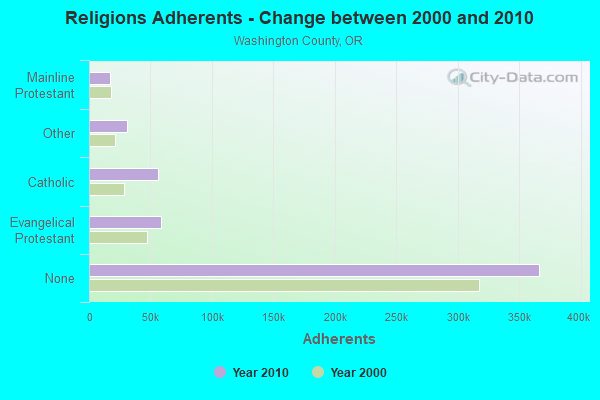
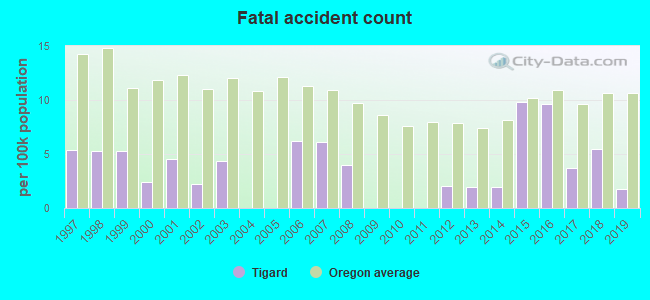
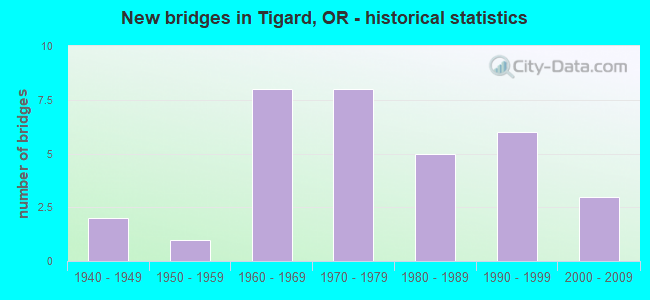
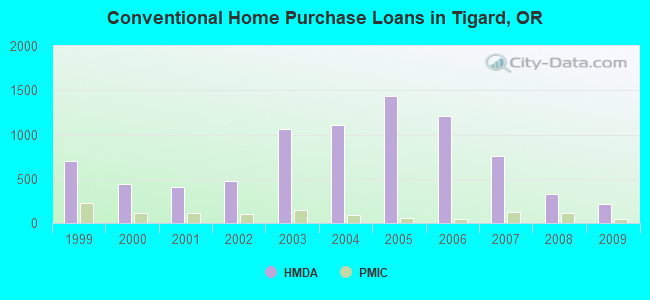
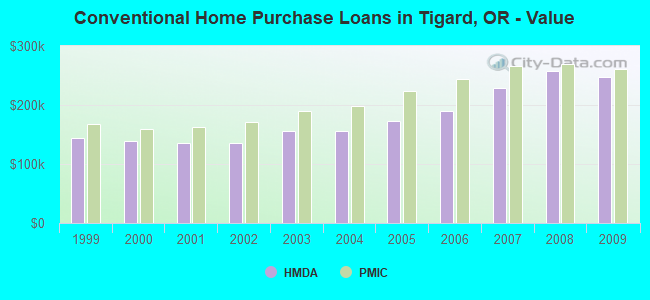
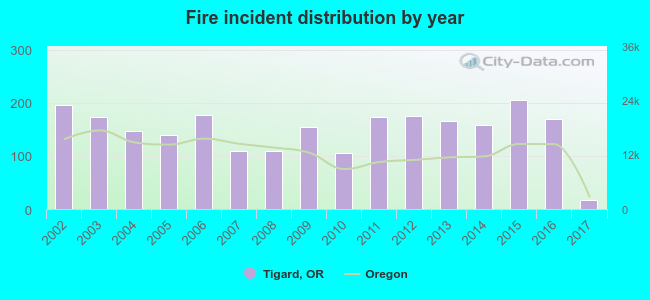 Based on the data from the years 2002 - 2017 the average number of fire incidents per year is 148. The highest number of reported fires - 205 took place in 2015, and the least - 17 in 2017. The data has a declining trend.
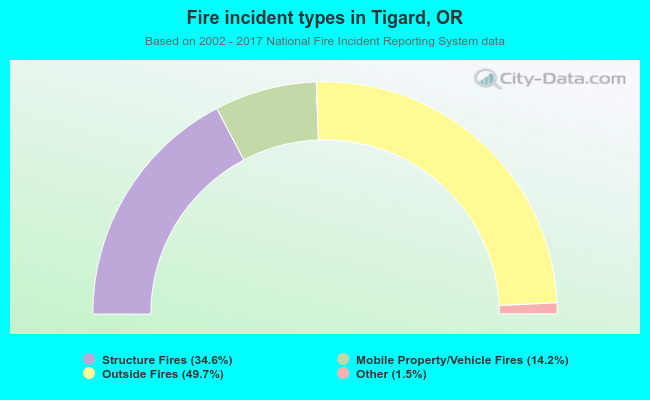 When looking into fire subcategories, the most incidents belonged to: Outside Fires (49.7%), and Structure Fires (34.6%).