West Ken-Lark, Florida
Submit your own pictures of this place and show them to the world
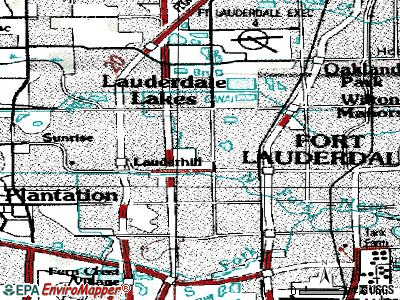
- OSM Map
- General Map
- Google Map
- MSN Map
| Males: 1,679 | |
| Females: 1,973 |
| Median resident age: | 31.8 years |
| Florida median age: | 38.7 years |
Zip codes: 33313.
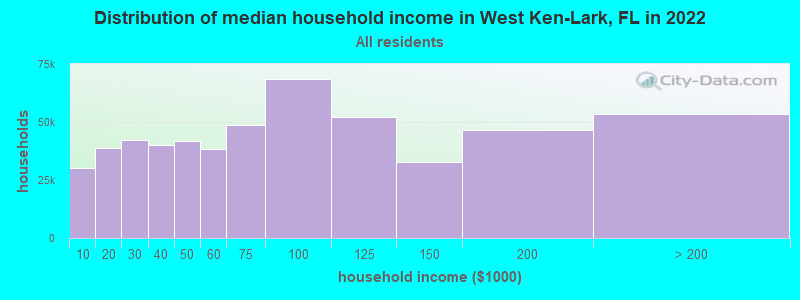
| West Ken-Lark: | $50,339 |
| FL: | $69,303 |
Estimated per capita income in 2022: $17,416 (it was $10,157 in 2000)
West Ken-Lark CDP income, earnings, and wages data
Estimated median house or condo value in 2022: $287,762 (it was $75,100 in 2000)
| West Ken-Lark: | $287,762 |
| FL: | $354,100 |
Mean prices in 2022: all housing units: $501,555; detached houses: $618,997; townhouses or other attached units: $394,360; in 2-unit structures: $434,772; in 3-to-4-unit structures: $337,258; in 5-or-more-unit structures: $307,009; mobile homes: $121,359; occupied boats, rvs, vans, etc.: $108,860
Detailed information about poverty and poor residents in West Ken-Lark, FL
Compare current foreclosures near your location:
| Photo | Address | Area | Beds / Baths | Price | Details |
|---|---|---|---|---|---|

|
#1
S High St
Columbus, OH 43207
|
1,678 sq. feet
|
2 baths 4 beds |
$31,900
|
show details |

|
#2
Bayberry Cir
Columbus, OH 43207
|
1,564 sq. feet
|
1 baths 3 beds |
$127,500
|
show details |

|
#3
E 21st Ave
Columbus, OH 43211
|
1,061 sq. feet
|
1 baths 3 beds |
$187,900
|
show details |

|
#4
N Grener Ave
Columbus, OH 43228
|
1,120 sq. feet
|
1 baths 3 beds |
show details | |

|
#5
S Chillicothe St
Plain City, OH 43064
|
1,736 sq. feet
|
2 baths 4 beds |
show details | |

|
#6
Ferris Rd
Columbus, OH 43224
|
2,218 sq. feet
|
3 baths 3 beds |
show details | |

|
#7
High Free Pike
West Jefferson, OH 43162
|
1,216 sq. feet
|
2 baths 4 beds |
show details | |

|
#8
Mink St SW
Pataskala, OH 43062
|
1,442 sq. feet
|
1 baths 3 beds |
show details | |

|
#9
Meadowbrook Dr
Columbus, OH 43207
|
1,752 sq. feet
|
2 baths 4 beds |
show details | |

|
#10
Vineyard Haven Loop
Dublin, OH 43016
|
4,625 sq. feet
|
4 baths 4 beds |
show details |
| Photo | Address | Area | Beds / Baths | Price | Details |
|---|---|---|---|---|---|

|
#11
Falls Peak Ln
Delaware, OH 43015
|
1,352 sq. feet
|
2 baths 2 beds |
show details | |

|
#12
S Hague Ave
Columbus, OH 43204
|
979 sq. feet
|
1 baths 2 beds |
show details | |

|
#13
Striebel Ct
Columbus, OH 43227
|
925 sq. feet
|
1 baths 3 beds |
show details | |

|
#14
Wrexham Ave
Columbus, OH 43223
|
1,235 sq. feet
|
1 baths 3 beds |
show details | |

|
#15
Bunch Flower Ct
Westerville, OH 43082
|
3,173 sq. feet
|
2 baths 4 beds |
show details | |

|
#16
Kingsglen Dr
Grove City, OH 43123
|
1,635 sq. feet
|
2 baths 4 beds |
show details | |

|
#17
Midland Ave
Columbus, OH 43223
|
1,518 sq. feet
|
1 baths 2 beds |
show details | |

|
#18
Derrer Rd -872
Columbus, OH 43204
|
1,667 sq. feet
|
2 baths 5 beds |
show details | |

|
#19
Mayflower Blvd
Columbus, OH 43213
|
1,591 sq. feet
|
2 baths 4 beds |
show details | |

|
#20
Bretton Pl
Columbus, OH 43211
|
1,056 sq. feet
|
1 baths 3 beds |
show details |
| Photo | Address | Area | Beds / Baths | Price | Details |
|---|---|---|---|---|---|

|
#21
Trotter Dr
Columbus, OH 43207
|
1,478 sq. feet
|
1 baths 3 beds |
show details | |

|
#22
S Richardson Ave
Columbus, OH 43204
|
1,520 sq. feet
|
2 baths 3 beds |
show details | |

|
#23
Fergus Rd
Grove City, OH 43123
|
3,312 sq. feet
|
2 baths 4 beds |
show details | |

|
#24
Stoneybrook Blvd # 21a
Hilliard, OH 43026
|
1,231 sq. feet
|
2 baths 3 beds |
show details | |

|
#25
Hiawatha Park Dr
Columbus, OH 43211
|
1,278 sq. feet
|
1 baths 4 beds |
show details | |

|
#26
Edgeview Rd
Columbus, OH 43207
|
1,700 sq. feet
|
1 baths 4 beds |
show details | |

|
#27
Belle Oak Dr
Galloway, OH 43119
|
1,296 sq. feet
|
2 baths 3 beds |
show details | |

|
#28
Scottwood Rd
Columbus, OH 43227
|
1,008 sq. feet
|
1 baths 3 beds |
show details | |

|
#29
N Roys Ave
Columbus, OH 43204
|
1,248 sq. feet
|
2 baths 3 beds |
show details | |

|
#30
Elaine Rd
Columbus, OH 43213
|
764 sq. feet
|
1 baths 2 beds |
show details |
| Photo | Address | Area | Beds / Baths | Price | Details |
|---|---|---|---|---|---|

|
#31
Fahlander Dr N
Columbus, OH 43229
|
1,338 sq. feet
|
2 baths 3 beds |
show details | |

|
#32
Brookstone Dr
Westerville, OH 43082
|
1,783 sq. feet
|
3 baths 3 beds |
show details | |

|
#33
Rosewood Ct
Powell, OH 43065
|
2,801 sq. feet
|
3 baths 4 beds |
show details | |

|
#34
Sleeping Meadow Dr
New Albany, OH 43054
|
3,211 sq. feet
|
2 baths 4 beds |
show details | |

|
#35
Marshrun Dr
Grove City, OH 43123
|
2,036 sq. feet
|
2 baths 4 beds |
show details | |

|
#36
Bernadette Rd
Columbus, OH 43204
|
1,168 sq. feet
|
1 baths 3 beds |
show details | |

|
#37
Nantucket Ave
Columbus, OH 43235
|
1,864 sq. feet
|
2 baths 3 beds |
show details | |

|
#38
Messner Dr
Hilliard, OH 43026
|
832 sq. feet
|
1 baths 2 beds |
show details | |

|
#39
Saint James Ct
Columbus, OH 43220
|
1,314 sq. feet
|
1 baths 2 beds |
show details | |

|
#40
Falene Pl
Galloway, OH 43119
|
1,178 sq. feet
|
1 baths 3 beds |
show details |
| Photo | Address | Area | Beds / Baths | Price | Details |
|---|---|---|---|---|---|

|
#41
Wesson Dr
Columbus, OH 43232
|
1,200 sq. feet
|
1 baths 3 beds |
show details | |

|
#42
Ridgebury Dr
Hilliard, OH 43026
|
832 sq. feet
|
1 baths 2 beds |
show details | |

|
#43
Tea Party Pl
Columbus, OH 43207
|
1,176 sq. feet
|
2 baths 3 beds |
show details | |

|
#44
Legionary St
Columbus, OH 43207
|
1,356 sq. feet
|
2 baths 3 beds |
show details | |

|
#45
Barthel Ave
Columbus, OH 43227
|
1,276 sq. feet
|
1 baths 3 beds |
show details | |

|
#46
Pendent Ln
Columbus, OH 43207
|
1,260 sq. feet
|
2 baths 3 beds |
show details | |

|
#47
Bloomington Blvd
Columbus, OH 43228
|
1,940 sq. feet
|
2 baths 2 beds |
show details | |

|
#48
Oreily Dr
Galloway, OH 43119
|
1,533 sq. feet
|
2 baths 3 beds |
show details | |

|
#49
Walnut Creek Dr
Columbus, OH 43224
|
1,412 sq. feet
|
1 baths 3 beds |
show details | |

|
Check over 1 million property listings on Foreclosure.com!
|
browse all offers | |||

- 3,29596.6%Black alone
- 511.5%Hispanic
- 361.1%Two or more races
- 180.5%White alone
- 60.2%Other race alone
- 30.09%American Indian alone
- 30.09%Asian alone
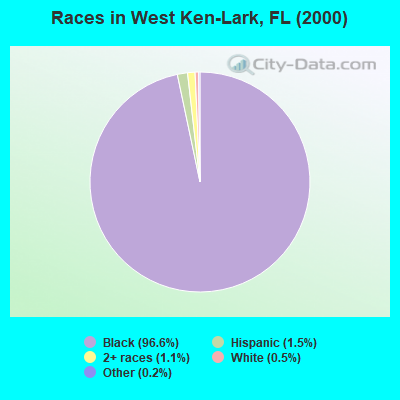
Races in West Ken-Lark detailed stats: ancestries, foreign born residents, place of birth
 Recent articles from our blog. Our writers, many of them Ph.D. graduates or candidates, create easy-to-read articles on a wide variety of topics.

Ancestries: West Indian (3.1%).
Current Local Time: EST time zone
Land area: 0.49 square miles.
Population density: 7,520 people per square mile (high).
144 residents are foreign born (4.2% Latin America).
| This place: | 4.2% |
| Florida: | 16.7% |
| West Ken-Lark CDP: | 1.3% ($992) |
| Florida: | 1.4% ($1,262) |
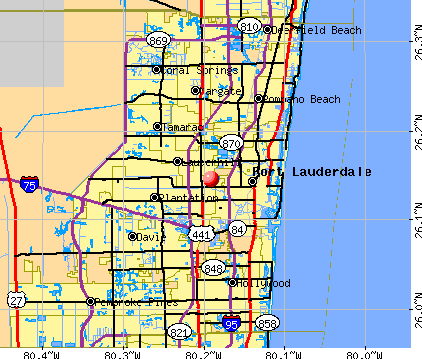
Nearest city with pop. 50,000+: Lauderhill, FL  (2.9 miles , pop. 57,585).
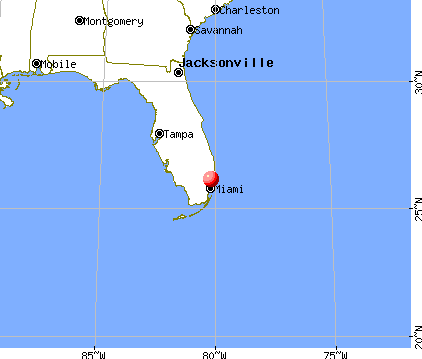
Nearest city with pop. 200,000+: Hialeah, FL (20.7 miles , pop. 226,419).
Nearest city with pop. 1,000,000+: Houston, TX (960.4 miles , pop. 1,953,631).
Nearest cities:
), ), ), ), ), ), )Latitude: 26.15 N, Longitude: 80.19 W
Property values in West Ken-Lark, FL
| Here: | 2.8% |
| Florida: | 2.9% |
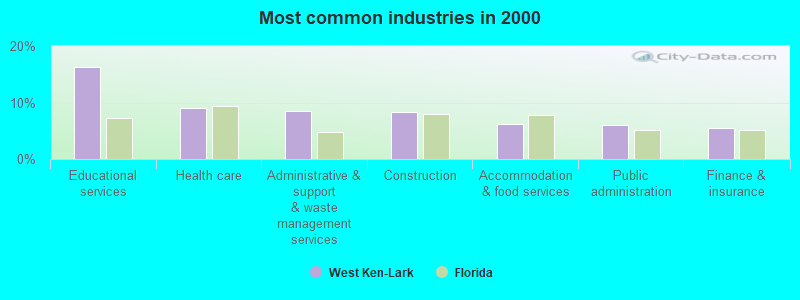
- Educational services (16.2%)
- Health care (9.0%)
- Administrative & support & waste management services (8.5%)
- Construction (8.4%)
- Accommodation & food services (6.1%)
- Public administration (6.0%)
- Finance & insurance (5.5%)
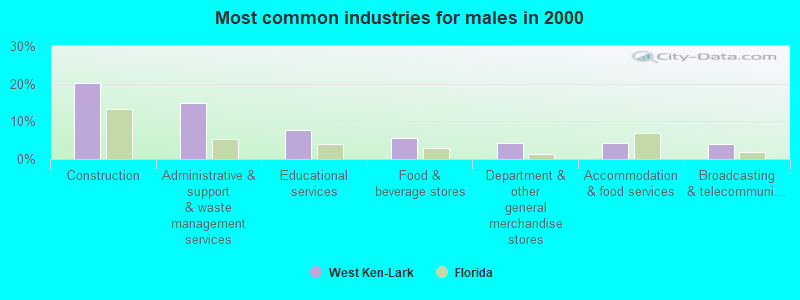
- Construction (20.1%)
- Administrative & support & waste management services (14.9%)
- Educational services (7.7%)
- Food & beverage stores (5.6%)
- Department & other general merchandise stores (4.4%)
- Accommodation & food services (4.1%)
- Broadcasting & telecommunications (3.9%)
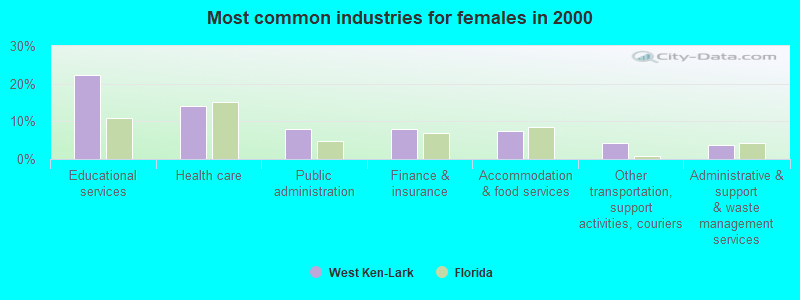
- Educational services (22.3%)
- Health care (14.2%)
- Public administration (8.0%)
- Finance & insurance (8.0%)
- Accommodation & food services (7.5%)
- Other transportation, support activities, couriers (4.1%)
- Administrative & support & waste management services (3.8%)
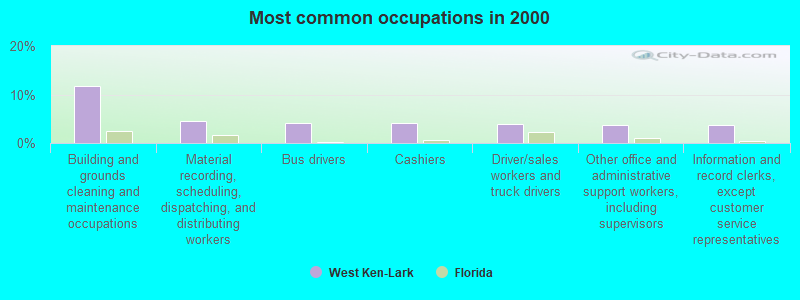
- Building and grounds cleaning and maintenance occupations (11.7%)
- Material recording, scheduling, dispatching, and distributing workers (4.5%)
- Bus drivers (4.1%)
- Cashiers (4.1%)
- Driver/sales workers and truck drivers (3.9%)
- Other office and administrative support workers, including supervisors (3.8%)
- Information and record clerks, except customer service representatives (3.6%)
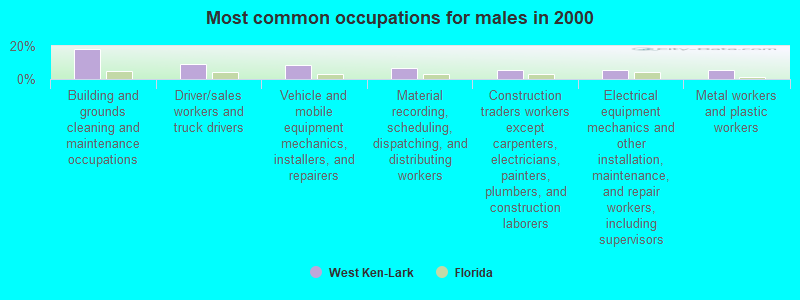
- Building and grounds cleaning and maintenance occupations (18.0%)
- Driver/sales workers and truck drivers (9.3%)
- Vehicle and mobile equipment mechanics, installers, and repairers (8.3%)
- Material recording, scheduling, dispatching, and distributing workers (6.6%)
- Construction traders workers except carpenters, electricians, painters, plumbers, and construction laborers (5.4%)
- Electrical equipment mechanics and other installation, maintenance, and repair workers, including supervisors (5.4%)
- Metal workers and plastic workers (5.2%)
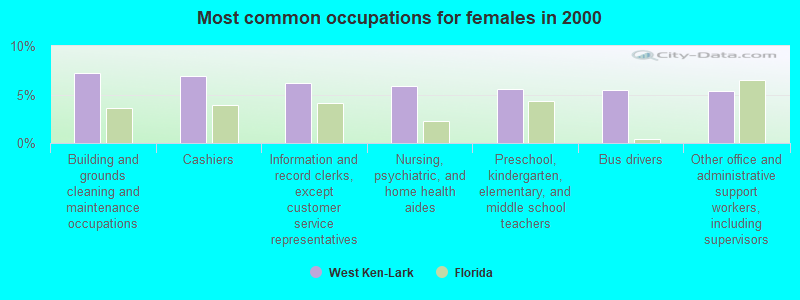
- Building and grounds cleaning and maintenance occupations (7.2%)
- Cashiers (6.9%)
- Information and record clerks, except customer service representatives (6.2%)
- Nursing, psychiatric, and home health aides (5.9%)
- Preschool, kindergarten, elementary, and middle school teachers (5.6%)
- Bus drivers (5.5%)
- Other office and administrative support workers, including supervisors (5.3%)
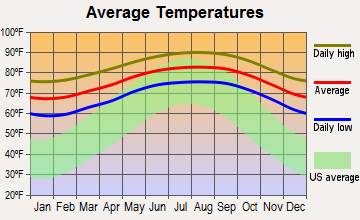
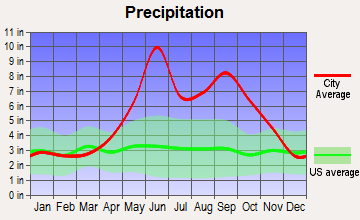
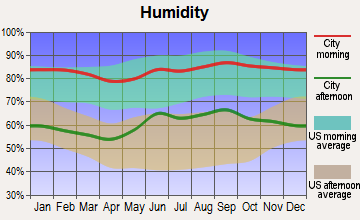
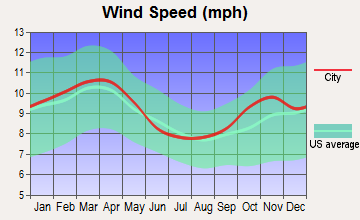
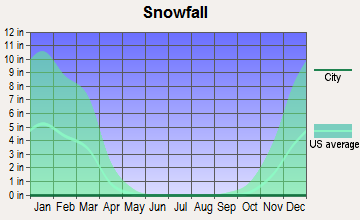
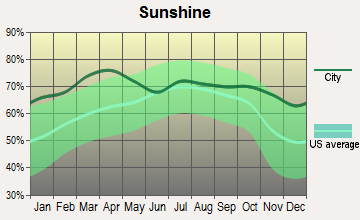
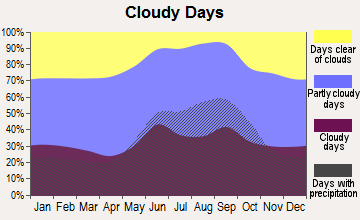
Average climate in West Ken-Lark, Florida
Based on data reported by over 4,000 weather stations
(lower is better)
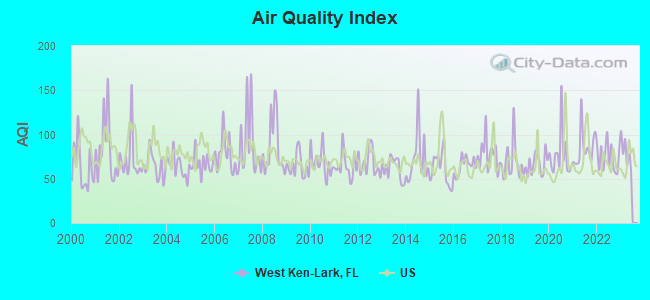
Air Quality Index (AQI) level in 2022 was 73.9. This is about average.
| City: | 73.9 |
| U.S.: | 72.6 |
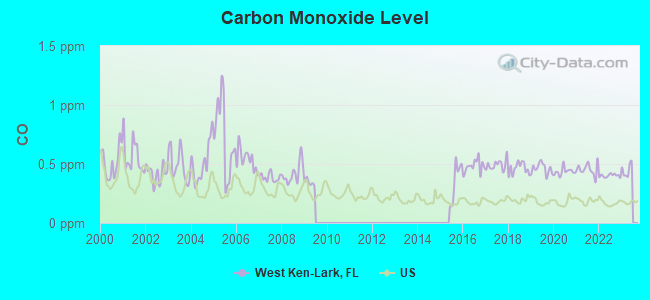
Carbon Monoxide (CO) [ppm] level in 2022 was 0.401. This is significantly worse than average. Closest monitor was 1.6 miles away from the city center.
| City: | 0.401 |
| U.S.: | 0.251 |
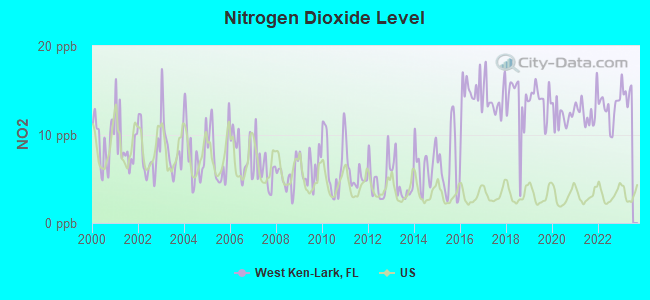
Nitrogen Dioxide (NO2) [ppb] level in 2022 was 12.8. This is significantly worse than average. Closest monitor was 1.6 miles away from the city center.
| City: | 12.8 |
| U.S.: | 5.1 |
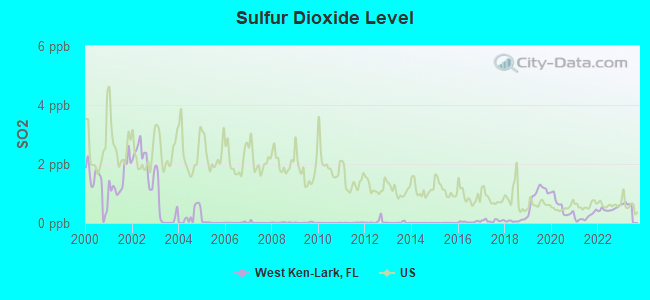
Sulfur Dioxide (SO2) [ppb] level in 2022 was 0.467. This is significantly better than average. Closest monitor was 1.8 miles away from the city center.
| City: | 0.467 |
| U.S.: | 1.515 |
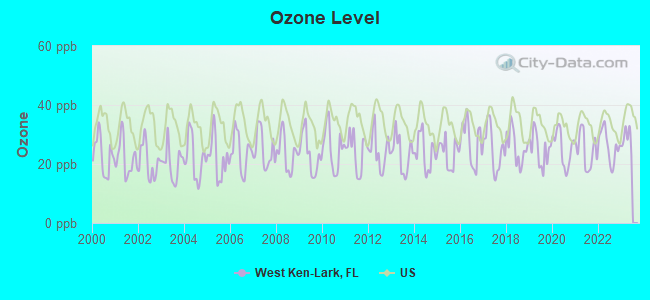
Ozone [ppb] level in 2022 was 26.2. This is better than average. Closest monitor was 2.0 miles away from the city center.
| City: | 26.2 |
| U.S.: | 33.3 |
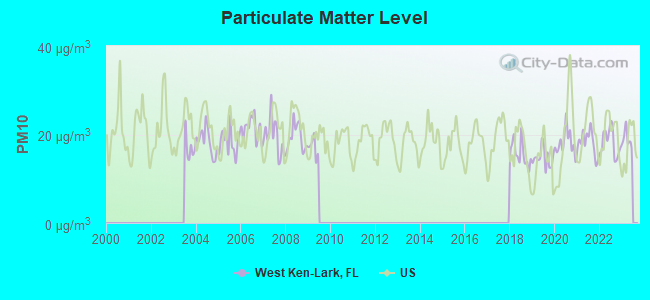
Particulate Matter (PM10) [µg/m3] level in 2022 was 18.2. This is about average. Closest monitor was 2.0 miles away from the city center.
| City: | 18.2 |
| U.S.: | 19.2 |
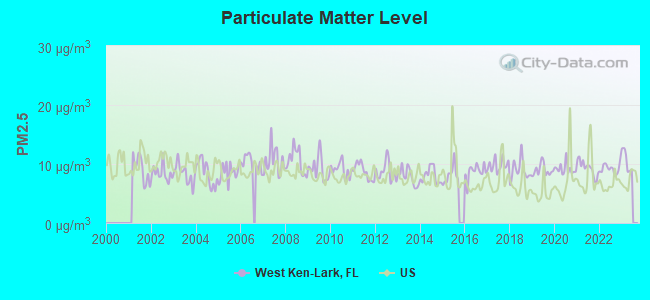
Particulate Matter (PM2.5) [µg/m3] level in 2022 was 9.24. This is about average. Closest monitor was 1.6 miles away from the city center.
| City: | 9.24 |
| U.S.: | 8.11 |
Tornado activity:
West Ken-Lark-area historical tornado activity is slightly below Florida state average. It is 25% smaller than the overall U.S. average.
On 3/1/1980, a category F3 (max. wind speeds 158-206 mph) tornado 2.1 miles away from the West Ken-Lark place center killed one person and injured 33 people and caused between $5,000,000 and $50,000,000 in damages.
On 2/23/1965, a category F3 tornado 3.4 miles away from the place center injured 6 people and caused between $50,000 and $500,000 in damages.
Earthquake activity:
West Ken-Lark-area historical earthquake activity is significantly below Florida state average. It is 99% smaller than the overall U.S. average.On 9/10/2006 at 14:56:08, a magnitude 5.9 (5.9 MB, 5.5 MS, 5.8 MW, Class: Moderate, Intensity: VI - VII) earthquake occurred 399.6 miles away from West Ken-Lark center
On 2/22/1992 at 04:21:34, a magnitude 3.2 (3.2 MB, Depth: 6.2 mi, Class: Light, Intensity: II - III) earthquake occurred 82.2 miles away from West Ken-Lark center
On 6/23/2016 at 17:20:29, a magnitude 3.8 (3.8 ML) earthquake occurred 270.1 miles away from West Ken-Lark center
On 7/16/2016 at 20:00:10, a magnitude 3.7 (3.7 MB) earthquake occurred 254.6 miles away from the city center
On 9/21/2016 at 16:30:52, a magnitude 3.8 (3.8 ML) earthquake occurred 275.0 miles away from the city center
On 9/4/2016 at 18:29:29, a magnitude 3.8 (3.8 ML) earthquake occurred 276.0 miles away from West Ken-Lark center
Magnitude types: body-wave magnitude (MB), local magnitude (ML), surface-wave magnitude (MS), moment magnitude (MW)
Natural disasters:
The number of natural disasters in Broward County (27) is a lot greater than the US average (15).Major Disasters (Presidential) Declared: 15
Emergencies Declared: 8
Causes of natural disasters: Hurricanes: 16, Fires: 3, Floods: 3, Tornadoes: 3, Freezes: 2, Tropical Storms: 2, Heavy Rain: 1, Storm: 1, Wind: 1, Other: 2 (Note: some incidents may be assigned to more than one category).
Hospitals and medical centers near West Ken-Lark:
- CATHOLIC HOME HEALTH SERVICES OF BROWARD, INC. (Home Health Center, about 2 miles away; LAUDERDALE LAKES, FL)
- SAINT JOHNS NURSING CENTER (Nursing Home, about 2 miles away; LAUDERDALE LAKES, FL)
- SILVER LIGHTNING HOME HEALTH CARE, LLC (Home Health Center, about 2 miles away; OAKLAND PARK, FL)
- COMPASSIONATE CARING HOME CARE, INC (Home Health Center, about 2 miles away; PLANTATION, FL)
- ANGEL CARE HOME HEALTH AGENCY, INC (Home Health Center, about 2 miles away; OAKLAND PARK, FL)
- PLANTATION NURSING AND REHABILITATION CENTER (Nursing Home, about 2 miles away; PLANTATION, FL)
- PLANTATION GENERAL HOSPITAL Acute Care Hospitals (about 2 miles away; PLANTATION, FL)
Amtrak stations near West Ken-Lark:
- 3 miles: FORT LAUDERDALE (200 SW 21ST TERRACE) . Services: ticket office, partially wheelchair accessible, enclosed waiting area, public restrooms, public payphones, vending machines, free short-term parking, free long-term parking, call for car rental service, call for taxi service, public transit connection.
- 10 miles: HOLLYWOOD (3001 HOLLYWOOD BLVD.) . Services: ticket office, partially wheelchair accessible, enclosed waiting area, public restrooms, public payphones, vending machines, free short-term parking, free long-term parking, taxi stand, public transit connection.
- 13 miles: DEERFIELD BEACH (1300 W. HILLSBORO BLVD.) . Services: ticket office, fully wheelchair accessible, enclosed waiting area, public restrooms, public payphones, free short-term parking, free long-term parking, call for taxi service, public transit connection.
Colleges/universities with over 2000 students nearest to West Ken-Lark:
- Keiser University-Ft Lauderdale (about 4 miles; Fort Lauderdale, FL; Full-time enrollment: 18,270)
- Broward College (about 6 miles; Fort Lauderdale, FL; FT enrollment: 30,322)
- Nova Southeastern University (about 6 miles; Fort Lauderdale, FL; FT enrollment: 25,621)
- Everest University-Pompano Beach (about 9 miles; Pompano Beach, FL; FT enrollment: 2,316)
- DeVry University-Florida (about 15 miles; Miramar, FL; FT enrollment: 3,674)
- St Thomas University (about 17 miles; Miami Gardens, FL; FT enrollment: 2,096)
- Florida Atlantic University (about 17 miles; Boca Raton, FL; FT enrollment: 24,403)
Points of interest:
Notable locations in West Ken-Lark: Swap Shop Drive-In (A), Lauderhill Fire Rescue Station 110 (B). Display/hide their locations on the map
Church in West Ken-Lark: New Mount Olive Baptist Church (A). Display/hide its location on the map
Park in West Ken-Lark: Wingate Park (1). Display/hide its location on the map
| This place: | 3.4 people |
| Florida: | 2.5 people |
| This place: | 83.1% |
| Whole state: | 66.9% |
| This place: | 3.6% |
| Whole state: | 5.8% |
Likely homosexual households (counted as self-reported same-sex unmarried-partner households)
- Lesbian couples: 0.2% of all households
- Gay men: 0.1% of all households
| This place: | 33.3% |
| Whole state: | 12.5% |
| This place: | 15.8% |
| Whole state: | 5.7% |
2 people in homes for the physically handicapped in 2000
For population 15 years and over in West Ken-Lark:
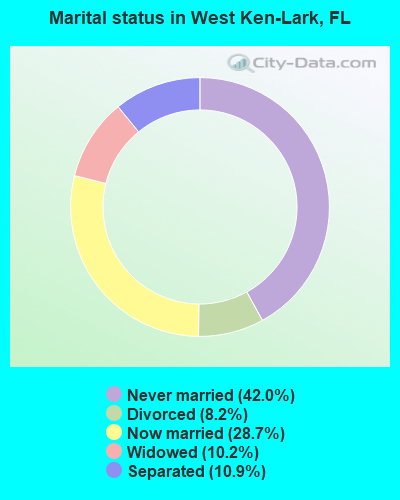
- Never married: 42.0%
- Now married: 28.7%
- Separated: 10.9%
- Widowed: 10.2%
- Divorced: 8.2%
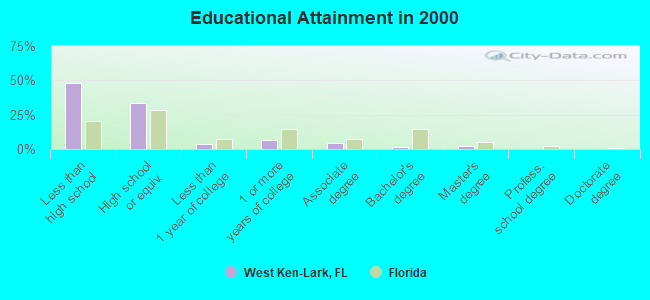
For population 25 years and over in West Ken-Lark:
- High school or higher: 52.1%
- Bachelor's degree or higher: 4.2%
- Graduate or professional degree: 2.5%
- Unemployed: 15.0%
- Mean travel time to work (commute): 26.0 minutes
| Here: | 13.0 |
| Florida average: | 12.6 |
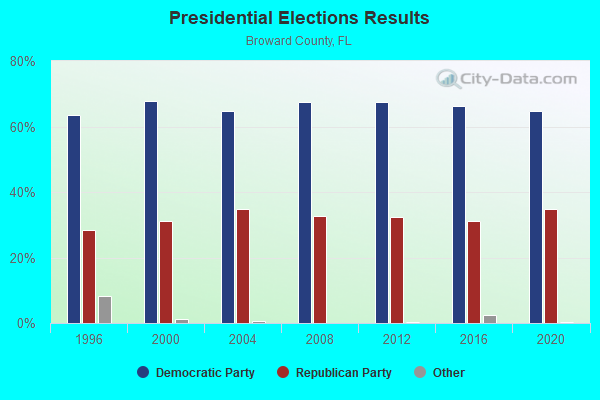
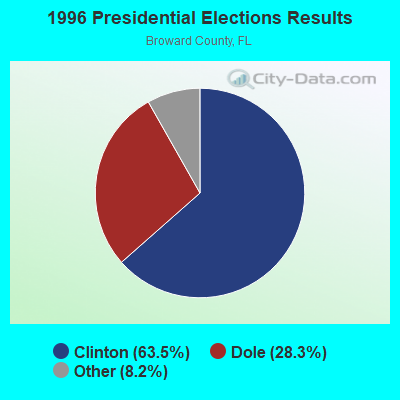
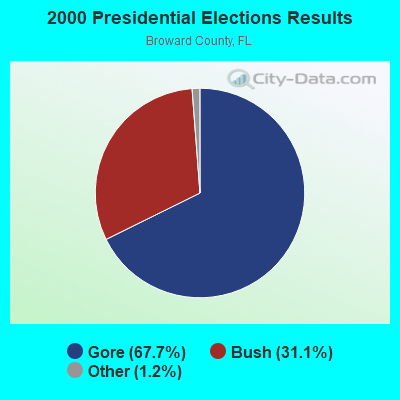
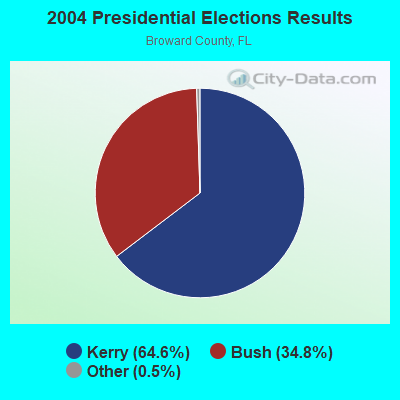
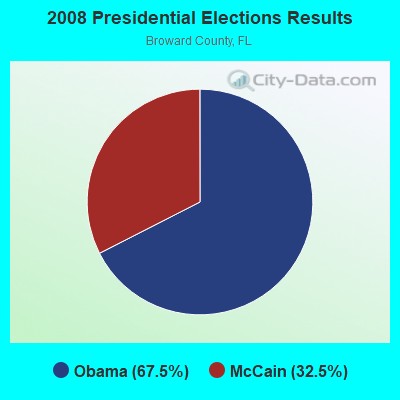
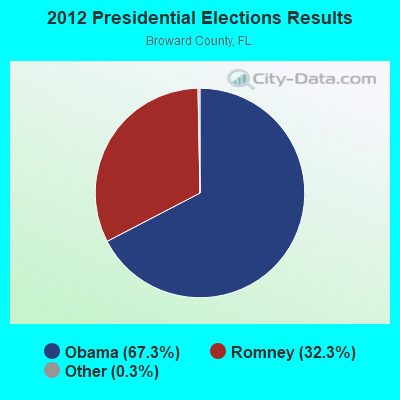
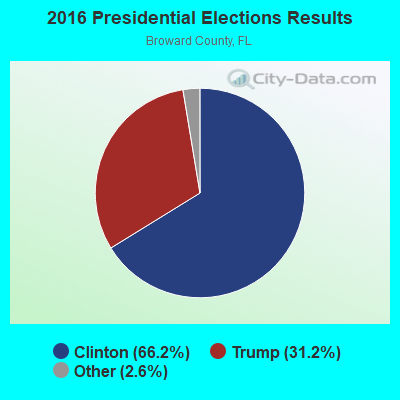
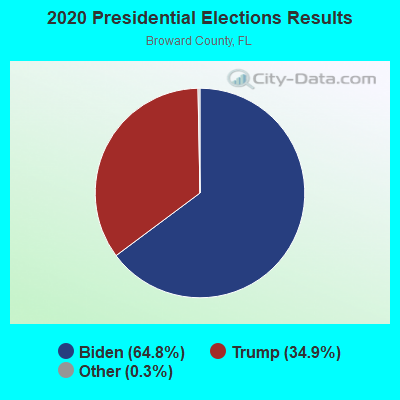
Graphs represent county-level data. Detailed 2008 Election Results
Religion statistics for West Ken-Lark, FL (based on Broward County data)
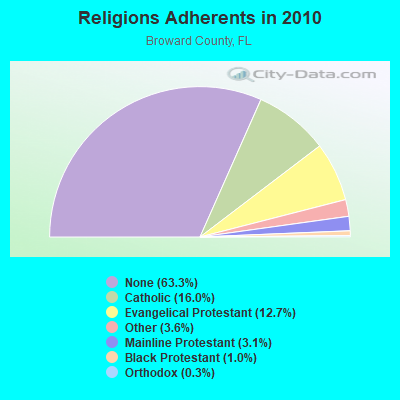
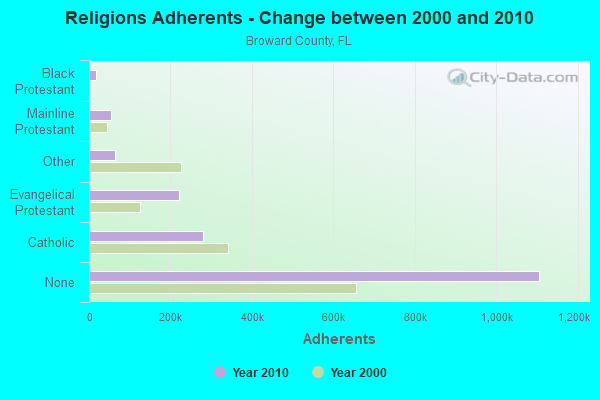
| Religion | Adherents | Congregations |
|---|---|---|
| Catholic | 280,324 | 47 |
| Evangelical Protestant | 221,258 | 701 |
| Other | 63,064 | 143 |
| Mainline Protestant | 53,412 | 88 |
| Black Protestant | 17,866 | 45 |
| Orthodox | 5,648 | 16 |
| None | 1,106,494 | - |
Food Environment Statistics:
| Broward County: | 2.05 / 10,000 pop. |
| Florida: | 2.04 / 10,000 pop. |
| Broward County: | 0.09 / 10,000 pop. |
| Florida: | 0.11 / 10,000 pop. |
| This county: | 1.53 / 10,000 pop. |
| Florida: | 1.28 / 10,000 pop. |
| Broward County: | 2.24 / 10,000 pop. |
| Florida: | 3.04 / 10,000 pop. |
| Broward County: | 8.00 / 10,000 pop. |
| Florida: | 7.45 / 10,000 pop. |
| This county: | 8.4% |
| State: | 9.2% |
| Broward County: | 20.6% |
| Florida: | 23.7% |
| Broward County: | 14.0% |
| Florida: | 14.0% |
6.62% of this county's 2021 resident taxpayers lived in other counties in 2020 ($102,632 average adjusted gross income)
| Here: | 6.62% |
| Florida average: | 8.80% |
0.03% of residents moved from foreign countries ($231 average AGI)
Broward County: 0.03% Florida average: 0.05%
Top counties from which taxpayers relocated into this county between 2020 and 2021:
| from Miami-Dade County, FL | |
| from Palm Beach County, FL | |
| from Orange County, FL |
6.99% of this county's 2020 resident taxpayers moved to other counties in 2021 ($73,182 average adjusted gross income)
| Here: | 6.99% |
| Florida average: | 7.45% |
0.03% of residents moved to foreign countries ($336 average AGI)
Broward County: 0.03% Florida average: 0.04%
Top counties to which taxpayers relocated from this county between 2020 and 2021:
| to Miami-Dade County, FL | |
| to Palm Beach County, FL | |
| to St. Lucie County, FL |
Strongest AM radio stations in West Ken-Lark:
- WWNN (1470 AM; 50 kW; POMPANO BEACH, FL; Owner: WWNN LICENSE, LLC)
- WFLL (1400 AM; 1 kW; FORT LAUDERDALE, FL; Owner: JAMES CRYSTAL ENTERPRISES LICENSES, L.L.C.)
- WEXY (1520 AM; 4 kW; WILTON MANORS, FL; Owner: MULTICULTURAL RADIO BROADCASTING, INC.)
- WRFX (940 AM; 50 kW; MIAMI, FL; Owner: CLEAR CHANNEL BROADCASTING LICENSES, INC.)
- WSRF (1580 AM; 10 kW; FORT LAUDERDALE, FL; Owner: URBAN RADIO OF FLORIDA, LLC)
- WAQI (710 AM; 50 kW; MIAMI, FL; Owner: LICENSE CORPORATION #1)
- WAVS (1170 AM; 5 kW; DAVIE, FL; Owner: RADIO WAVS, INC.)
- WNMA (1210 AM; 49 kW; MIAMI SPRINGS, FL; Owner: RADIO UNICA OF MIAMI LICENSE CORP.)
- WWFE (670 AM; 50 kW; MIAMI, FL; Owner: FENIX BROADCASTING CORP.)
- WFTL (850 AM; 50 kW; WEST PALM BEACH, FL; Owner: JAMES CRYSTAL ENTERPRISES II, L.L.C.)
- WLVJ (1040 AM; 25 kW; BOYNTON BEACH, FL; Owner: JAMES CRYSTAL BOYNTON BEACH, INC.)
- WSUA (1260 AM; 50 kW; MIAMI, FL; Owner: WSUA BROADCASTING CORPORATION)
- WQBA (1140 AM; 50 kW; MIAMI, FL; Owner: WQBA-AM LICENSE CORP.)
Strongest FM radio stations in West Ken-Lark:
- WEDR (99.1 FM; MIAMI, FL; Owner: COX RADIO, INC.)
- WBGG-FM (105.9 FM; FORT LAUDERDALE, FL; Owner: CLEAR CHANNEL BROADCASTING LICENSES, INC.)
- WHYI-FM (100.7 FM; FORT LAUDERDALE, FL; Owner: CLEAR CHANNEL BROADCASTING LICENSES, INC.)
- WKIS (99.9 FM; BOCA RATON, FL; Owner: WKIS LICENSE LIMITED PARTNERSHIP)
- WRMA (106.7 FM; FORT LAUDERDALE, FL; Owner: WRMA LICENSING, INC.)
- WLRN-FM (91.3 FM; MIAMI, FL; Owner: THE SCHOOL BOARD OF MIAMI - DADE COUNTY, FL)
- WFLC (97.3 FM; MIAMI, FL; Owner: COX RADIO, INC.)
- WPYM (93.1 FM; MIAMI, FL; Owner: COX RADIO-MIAMI, LLC)
- WHQT (105.1 FM; CORAL GABLES, FL; Owner: COX RADIO, INC.)
- WLVE (93.9 FM; MIAMI BEACH, FL; Owner: CLEAR CHANNEL BROADCASTING LICENSES, INC.)
- WMIB (103.5 FM; FORT LAUDERDALE, FL; Owner: CLEAR CHANNEL BROADCASTING LICENSES, INC.)
- WMXJ (102.7 FM; POMPANO BEACH, FL; Owner: JEFFERSON-PILOT COMMUNICATIONS CO. OF FLORIDA)
- WPOW (96.5 FM; MIAMI, FL; Owner: WPOW LICENSE LIMITED PARTNERSHIP)
- WZTA (94.9 FM; MIAMI BEACH, FL; Owner: CLEAR CHANNEL BROADCASTING LICENSES, INC.)
- WLYF (101.5 FM; MIAMI, FL; Owner: JEFFERSON-PILOT COMMUNICATIONS CO. OF FLORIDA)
- WAFG (90.3 FM; FORT LAUDERDALE, FL; Owner: WESTMINSTER ACADEMY)
- WXDJ (95.7 FM; NORTH MIAMI BEACH, FL; Owner: WXDJ LICENSING, INC.)
- WAMR-FM (107.5 FM; MIAMI, FL; Owner: WQBA-FM LICENSE CORP.)
- WEAT-FM (104.3 FM; WEST PALM BEACH, FL; Owner: INFINITY RADIO OPERATIONS INC.)
- WKPX (88.5 FM; SUNRISE, FL; Owner: SCHOOL BOARD OF BROWARD COUNTY, FLORIDA)
TV broadcast stations around West Ken-Lark:
- W58BU (Channel 58; HALLANDALE, FL; Owner: NBC STATIONS MANAGEMENT,INC.)
- WPPB-TV (Channel 63; BOCA RATON, FL; Owner: THE SCHOOL BOARD OF BROWARD COUNTY, FLORIDA)
- WPBT (Channel 2; MIAMI, FL; Owner: COMMUNITY TV FOUNDATION OF S. FLORIDA, INC.)
- WHFT-TV (Channel 45; MIAMI, FL; Owner: TRINITY BROADCASTING OF FLORIDA, INC.)
- WSVN (Channel 7; MIAMI, FL; Owner: SUNBEAM TELEVISION CORP.)
- W24CA (Channel 24; MARATHON, FL; Owner: KEY COMMUNICATIONS OF TEXAS)
- WAMI-TV (Channel 69; HOLLYWOOD, FL; Owner: TELEFUTURA MIAMI LLC)
- WHDT-LP (Channel 44; MIAMI, FL; Owner: GUENTER MARKSTEINER)
- WSCV (Channel 51; FORT LAUDERDALE, FL; Owner: TELEMUNDO OF FLORIDA LICENSE CORP.)
- WLRN-TV (Channel 17; MIAMI, FL; Owner: THE SCHOOL BOARD OF MIAMI - DADE COUNTY, FL)
- WPLG (Channel 10; MIAMI, FL; Owner: POST-NEWSWEEK STATIONS, FLORIDA, INC.)
- WLTV (Channel 23; MIAMI, FL; Owner: WLTV LICENSE PARTNERSHIP, G.P.)
- WBFS-TV (Channel 33; MIAMI, FL; Owner: VIACOM STATIONS GROUP OF MIAMI INC.)
- WPXM (Channel 35; MIAMI, FL; Owner: PAXSON COMMUNICATIONS LICENSE COMPANY, LLC)
- WBZL (Channel 39; MIAMI, FL; Owner: CHANNEL 39, INC.)
- WLMF-LP (Channel 53; MIAMI, FL; Owner: PAGING SYSTEMS, INC.)
- WFUN-CA (Channel 48; MIAMI, ETC., FL; Owner: LOCALONE TEXAS, LTD.)
- WPTV (Channel 5; WEST PALM BEACH, FL; Owner: SCRIPPS HOWARD BROADCASTING COMPANY)
- WFLX (Channel 29; WEST PALM BEACH, FL; Owner: RAYCOM NATIONAL, INC.)
- WDLP-CA (Channel 21; POMPANO BEACH, FL; Owner: WDLP BROADCASTING COMPANY, LLC)
- WXEL-TV (Channel 42; WEST PALM BEACH, FL; Owner: BARRY TELECOMMUNICATIONS, INC.)
- WTVJ (Channel 6; MIAMI, FL; Owner: NBC STATIONS MANAGEMENT, INC.)
- WPEC (Channel 12; WEST PALM BEACH, FL; Owner: FREEDOM BROADCASTING OF FLORIDA, INC)
- WFGC (Channel 61; PALM BEACH, FL; Owner: CHRISTIAN TELEVISION OF PALM BEACH COUNTY, INC.)
- WGEN-LP (Channel 55; MIAMI, FL; Owner: WDLP BROADCASTING COMPANY, LLC)
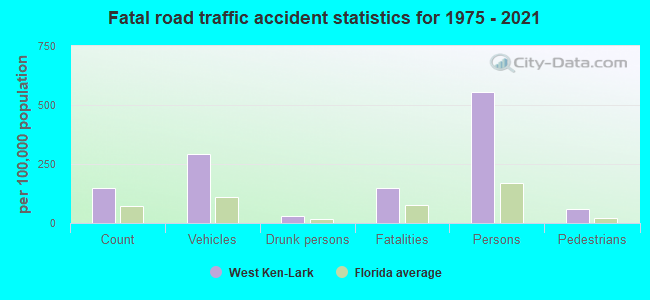
West Ken-Lark fatal accident list:
Nov 7, 2017 08:50 PM, 31st Ave, 12th St, Lat: 26.139819, Lon: -80.186564, Vehicles: 3, Persons: 6, Fatalities: 1
Jul 3, 2011 02:47 PM, Sr-838, Sunrise Blvd, Lat: 26.136442, Lon: -80.186508, Vehicles: 1, Persons: 1, Pedestrians: 1, Fatalities: 1
Jul 4, 2009 10:53 PM, Nw 31 Avenue, Sr-838, Lat: 26.139306, Lon: -80.186575, Vehicles: 1, Persons: 2, Pedestrians: 1, Fatalities: 1
Apr 13, 2005 11:30 AM, Sr-838, 31 Ave, Lat: 26.136160, Lon: -80.186510, Vehicles: 2, Persons: 5, Fatalities: 1
FCC Registered Microwave Towers:
2- MIAMI 2 MSC, 1691 Nw 31st Ave (Lat: 26.148333 Lon: -80.188056), Type: Ltower, Structure height: 38.1 m, Call Sign: WQKD378,
Assigned Frequencies: 6197.24 MHz, 6226.89 MHz, 6256.54 MHz, 6286.19 MHz, 6315.84 MHz, 6345.49 MHz, 6375.14 MHz, 6404.79 MHz, 6197.24 MHz, 6226.89 MHz... (+6 more), Grant Date: 04/02/2019, Expiration Date: 04/07/2029, Cancellation Date: 11/07/2022, Certifier: Gregory M Romano, Registrant: Verizon, 5055 Northpointe Pkwy, Alpharetta, GA 30022, Phone: (770) 797-1070, Email:
- CORE, 1725 Nw 31 Ave (Lat: 26.149028 Lon: -80.188556), Type: Ltower, Structure height: 91 m, Overall height: 96 m, Call Sign: WRDI275, Licensee ID: L00006457,
Assigned Frequencies: 6389.96 MHz, 6389.96 MHz, 6389.96 MHz, 6389.96 MHz, 6389.96 MHz, 6389.96 MHz, 6389.96 MHz, 6389.96 MHz, 6389.96 MHz, 6389.96 MHz... (+19 more), Grant Date: 05/03/2019, Expiration Date: 05/03/2029, Certifier: Jose M Dezayas, Registrant: Broward County Board Of County Commissioners, 115 S Andrews Ave, Fort Lauderdale, FL 33301, Phone: (954) 357-8012, Email:
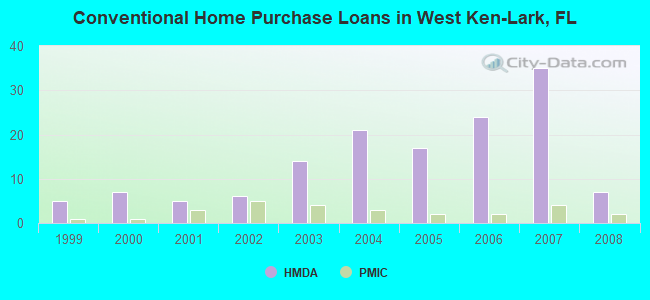
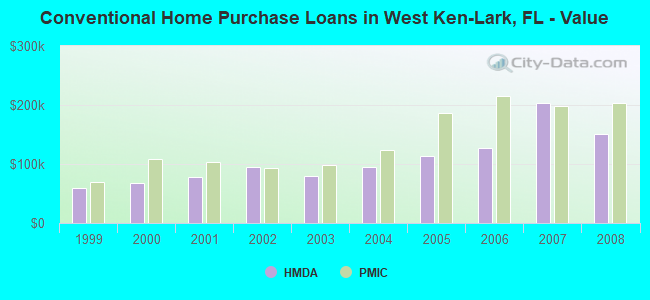
| Home Mortgage Disclosure Act Aggregated Statistics For Year 2009 (Based on 1 partial tract) | ||||||||
| A) FHA, FSA/RHS & VA Home Purchase Loans | C) Refinancings | D) Home Improvement Loans | F) Non-occupant Loans on < 5 Family Dwellings (A B C & D) | |||||
|---|---|---|---|---|---|---|---|---|
| Number | Average Value | Number | Average Value | Number | Average Value | Number | Average Value | |
| LOANS ORIGINATED | 2 | $118,245 | 1 | $224,320 | 0 | $0 | 0 | $0 |
| APPLICATIONS APPROVED, NOT ACCEPTED | 0 | $0 | 0 | $0 | 0 | $0 | 0 | $0 |
| APPLICATIONS DENIED | 0 | $0 | 6 | $114,432 | 2 | $22,625 | 2 | $104,130 |
| APPLICATIONS WITHDRAWN | 0 | $0 | 1 | $134,790 | 1 | $67,640 | 0 | $0 |
| FILES CLOSED FOR INCOMPLETENESS | 0 | $0 | 0 | $0 | 0 | $0 | 0 | $0 |
Detailed HMDA statistics for the following Tracts: 0412.00
| Private Mortgage Insurance Companies Aggregated Statistics For Year 2008 (Based on 1 partial tract) | ||
| A) Conventional Home Purchase Loans | ||
|---|---|---|
| Number | Average Value | |
| LOANS ORIGINATED | 2 | $202,910 |
| APPLICATIONS APPROVED, NOT ACCEPTED | 0 | $0 |
| APPLICATIONS DENIED | 0 | $0 |
| APPLICATIONS WITHDRAWN | 0 | $0 |
| FILES CLOSED FOR INCOMPLETENESS | 0 | $0 |
Detailed PMIC statistics for the following Tracts: 0412.00
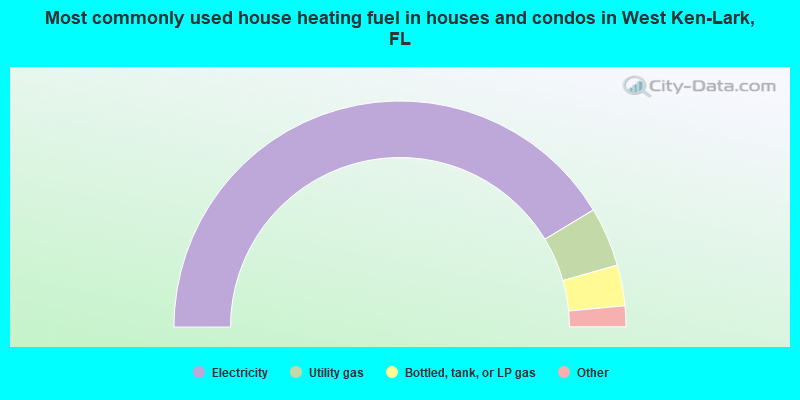
- 82.6%Electricity
- 8.5%Utility gas
- 5.8%Bottled, tank, or LP gas
- 1.8%No fuel used
- 1.2%Fuel oil, kerosene, etc.
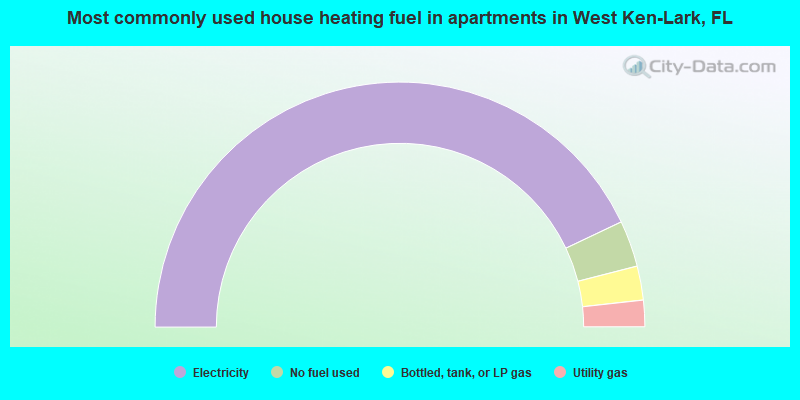
- 86.0%Electricity
- 6.1%No fuel used
- 4.5%Bottled, tank, or LP gas
- 3.5%Utility gas
West Ken-Lark compared to Florida state average:
- Black race population percentage significantly above state average.
- Hispanic race population percentage significantly below state average.
- Median age significantly below state average.
- Foreign-born population percentage significantly below state average.
- Renting percentage significantly below state average.
- Length of stay since moving in significantly above state average.
- Number of rooms per house significantly below state average.
- House age significantly below state average.
- Percentage of population with a bachelor's degree or higher significantly below state average.