Wilsonville, Oregon Submit your own pictures of this city and show them to the world
OSM Map
General Map
Google Map
MSN Map
OSM Map
General Map
Google Map
MSN Map
OSM Map
General Map
Google Map
MSN Map
OSM Map
General Map
Google Map
MSN Map
Please wait while loading the map...
Population in 2022: 26,597 (100% urban, 0% rural). Population change since 2000: +90.1%Males: 12,781 Females: 13,816
March 2022 cost of living index in Wilsonville: 106.1 (more than average, U.S. average is 100) Percentage of residents living in poverty in 2022: 8.7%for White Non-Hispanic residents , 4.1% for Black residents , 8.7% for Hispanic or Latino residents , 6.0% for American Indian residents , 2.1% for Native Hawaiian and other Pacific Islander residents , 12.4% for two or more races residents )
Profiles of local businesses
Business Search - 14 Million verified businesses
Data:
Median household income ($)
Median household income (% change since 2000)
Household income diversity
Ratio of average income to average house value (%)
Ratio of average income to average rent
Median household income ($) - White
Median household income ($) - Black or African American
Median household income ($) - Asian
Median household income ($) - Hispanic or Latino
Median household income ($) - American Indian and Alaska Native
Median household income ($) - Multirace
Median household income ($) - Other Race
Median household income for houses/condos with a mortgage ($)
Median household income for apartments without a mortgage ($)
Races - White alone (%)
Races - White alone (% change since 2000)
Races - Black alone (%)
Races - Black alone (% change since 2000)
Races - American Indian alone (%)
Races - American Indian alone (% change since 2000)
Races - Asian alone (%)
Races - Asian alone (% change since 2000)
Races - Hispanic (%)
Races - Hispanic (% change since 2000)
Races - Native Hawaiian and Other Pacific Islander alone (%)
Races - Native Hawaiian and Other Pacific Islander alone (% change since 2000)
Races - Two or more races (%)
Races - Two or more races (% change since 2000)
Races - Other race alone (%)
Races - Other race alone (% change since 2000)
Racial diversity
Unemployment (%)
Unemployment (% change since 2000)
Unemployment (%) - White
Unemployment (%) - Black or African American
Unemployment (%) - Asian
Unemployment (%) - Hispanic or Latino
Unemployment (%) - American Indian and Alaska Native
Unemployment (%) - Multirace
Unemployment (%) - Other Race
Population density (people per square mile)
Population - Males (%)
Population - Females (%)
Population - Males (%) - White
Population - Males (%) - Black or African American
Population - Males (%) - Asian
Population - Males (%) - Hispanic or Latino
Population - Males (%) - American Indian and Alaska Native
Population - Males (%) - Multirace
Population - Males (%) - Other Race
Population - Females (%) - White
Population - Females (%) - Black or African American
Population - Females (%) - Asian
Population - Females (%) - Hispanic or Latino
Population - Females (%) - American Indian and Alaska Native
Population - Females (%) - Multirace
Population - Females (%) - Other Race
Coronavirus confirmed cases (Apr 27, 2024)
Deaths caused by coronavirus (Apr 27, 2024)
Coronavirus confirmed cases (per 100k population) (Apr 27, 2024)
Deaths caused by coronavirus (per 100k population) (Apr 27, 2024)
Daily increase in number of cases (Apr 27, 2024)
Weekly increase in number of cases (Apr 27, 2024)
Cases doubled (in days) (Apr 27, 2024)
Hospitalized patients (Apr 18, 2022)
Negative test results (Apr 18, 2022)
Total test results (Apr 18, 2022)
COVID Vaccine doses distributed (per 100k population) (Sep 19, 2023)
COVID Vaccine doses administered (per 100k population) (Sep 19, 2023)
COVID Vaccine doses distributed (Sep 19, 2023)
COVID Vaccine doses administered (Sep 19, 2023)
Likely homosexual households (%)
Likely homosexual households (% change since 2000)
Likely homosexual households - Lesbian couples (%)
Likely homosexual households - Lesbian couples (% change since 2000)
Likely homosexual households - Gay men (%)
Likely homosexual households - Gay men (% change since 2000)
Cost of living index
Median gross rent ($)
Median contract rent ($)
Median monthly housing costs ($)
Median house or condo value ($)
Median house or condo value ($ change since 2000)
Mean house or condo value by units in structure - 1, detached ($)
Mean house or condo value by units in structure - 1, attached ($)
Mean house or condo value by units in structure - 2 ($)
Mean house or condo value by units in structure by units in structure - 3 or 4 ($)
Mean house or condo value by units in structure - 5 or more ($)
Mean house or condo value by units in structure - Boat, RV, van, etc. ($)
Mean house or condo value by units in structure - Mobile home ($)
Median house or condo value ($) - White
Median house or condo value ($) - Black or African American
Median house or condo value ($) - Asian
Median house or condo value ($) - Hispanic or Latino
Median house or condo value ($) - American Indian and Alaska Native
Median house or condo value ($) - Multirace
Median house or condo value ($) - Other Race
Median resident age
Resident age diversity
Median resident age - Males
Median resident age - Females
Median resident age - White
Median resident age - Black or African American
Median resident age - Asian
Median resident age - Hispanic or Latino
Median resident age - American Indian and Alaska Native
Median resident age - Multirace
Median resident age - Other Race
Median resident age - Males - White
Median resident age - Males - Black or African American
Median resident age - Males - Asian
Median resident age - Males - Hispanic or Latino
Median resident age - Males - American Indian and Alaska Native
Median resident age - Males - Multirace
Median resident age - Males - Other Race
Median resident age - Females - White
Median resident age - Females - Black or African American
Median resident age - Females - Asian
Median resident age - Females - Hispanic or Latino
Median resident age - Females - American Indian and Alaska Native
Median resident age - Females - Multirace
Median resident age - Females - Other Race
Commute - mean travel time to work (minutes)
Travel time to work - Less than 5 minutes (%)
Travel time to work - Less than 5 minutes (% change since 2000)
Travel time to work - 5 to 9 minutes (%)
Travel time to work - 5 to 9 minutes (% change since 2000)
Travel time to work - 10 to 19 minutes (%)
Travel time to work - 10 to 19 minutes (% change since 2000)
Travel time to work - 20 to 29 minutes (%)
Travel time to work - 20 to 29 minutes (% change since 2000)
Travel time to work - 30 to 39 minutes (%)
Travel time to work - 30 to 39 minutes (% change since 2000)
Travel time to work - 40 to 59 minutes (%)
Travel time to work - 40 to 59 minutes (% change since 2000)
Travel time to work - 60 to 89 minutes (%)
Travel time to work - 60 to 89 minutes (% change since 2000)
Travel time to work - 90 or more minutes (%)
Travel time to work - 90 or more minutes (% change since 2000)
Marital status - Never married (%)
Marital status - Now married (%)
Marital status - Separated (%)
Marital status - Widowed (%)
Marital status - Divorced (%)
Median family income ($)
Median family income (% change since 2000)
Median non-family income ($)
Median non-family income (% change since 2000)
Median per capita income ($)
Median per capita income (% change since 2000)
Median family income ($) - White
Median family income ($) - Black or African American
Median family income ($) - Asian
Median family income ($) - Hispanic or Latino
Median family income ($) - American Indian and Alaska Native
Median family income ($) - Multirace
Median family income ($) - Other Race
Median year house/condo built
Median year apartment built
Year house built - Built 2005 or later (%)
Year house built - Built 2000 to 2004 (%)
Year house built - Built 1990 to 1999 (%)
Year house built - Built 1980 to 1989 (%)
Year house built - Built 1970 to 1979 (%)
Year house built - Built 1960 to 1969 (%)
Year house built - Built 1950 to 1959 (%)
Year house built - Built 1940 to 1949 (%)
Year house built - Built 1939 or earlier (%)
Average household size
Household density (households per square mile)
Average household size - White
Average household size - Black or African American
Average household size - Asian
Average household size - Hispanic or Latino
Average household size - American Indian and Alaska Native
Average household size - Multirace
Average household size - Other Race
Occupied housing units (%)
Vacant housing units (%)
Owner occupied housing units (%)
Renter occupied housing units (%)
Vacancy status - For rent (%)
Vacancy status - For sale only (%)
Vacancy status - Rented or sold, not occupied (%)
Vacancy status - For seasonal, recreational, or occasional use (%)
Vacancy status - For migrant workers (%)
Vacancy status - Other vacant (%)
Residents with income below the poverty level (%)
Residents with income below 50% of the poverty level (%)
Children below poverty level (%)
Poor families by family type - Married-couple family (%)
Poor families by family type - Male, no wife present (%)
Poor families by family type - Female, no husband present (%)
Poverty status for native-born residents (%)
Poverty status for foreign-born residents (%)
Poverty among high school graduates not in families (%)
Poverty among people who did not graduate high school not in families (%)
Residents with income below the poverty level (%) - White
Residents with income below the poverty level (%) - Black or African American
Residents with income below the poverty level (%) - Asian
Residents with income below the poverty level (%) - Hispanic or Latino
Residents with income below the poverty level (%) - American Indian and Alaska Native
Residents with income below the poverty level (%) - Multirace
Residents with income below the poverty level (%) - Other Race
Air pollution - Air Quality Index (AQI)
Air pollution - CO
Air pollution - NO2
Air pollution - SO2
Air pollution - Ozone
Air pollution - PM10
Air pollution - PM25
Air pollution - Pb
Crime - Murders per 100,000 population
Crime - Rapes per 100,000 population
Crime - Robberies per 100,000 population
Crime - Assaults per 100,000 population
Crime - Burglaries per 100,000 population
Crime - Thefts per 100,000 population
Crime - Auto thefts per 100,000 population
Crime - Arson per 100,000 population
Crime - City-data.com crime index
Crime - Violent crime index
Crime - Property crime index
Crime - Murders per 100,000 population (5 year average)
Crime - Rapes per 100,000 population (5 year average)
Crime - Robberies per 100,000 population (5 year average)
Crime - Assaults per 100,000 population (5 year average)
Crime - Burglaries per 100,000 population (5 year average)
Crime - Thefts per 100,000 population (5 year average)
Crime - Auto thefts per 100,000 population (5 year average)
Crime - Arson per 100,000 population (5 year average)
Crime - City-data.com crime index (5 year average)
Crime - Violent crime index (5 year average)
Crime - Property crime index (5 year average)
1996 Presidential Elections Results (%) - Democratic Party (Clinton)
1996 Presidential Elections Results (%) - Republican Party (Dole)
1996 Presidential Elections Results (%) - Other
2000 Presidential Elections Results (%) - Democratic Party (Gore)
2000 Presidential Elections Results (%) - Republican Party (Bush)
2000 Presidential Elections Results (%) - Other
2004 Presidential Elections Results (%) - Democratic Party (Kerry)
2004 Presidential Elections Results (%) - Republican Party (Bush)
2004 Presidential Elections Results (%) - Other
2008 Presidential Elections Results (%) - Democratic Party (Obama)
2008 Presidential Elections Results (%) - Republican Party (McCain)
2008 Presidential Elections Results (%) - Other
2012 Presidential Elections Results (%) - Democratic Party (Obama)
2012 Presidential Elections Results (%) - Republican Party (Romney)
2012 Presidential Elections Results (%) - Other
2016 Presidential Elections Results (%) - Democratic Party (Clinton)
2016 Presidential Elections Results (%) - Republican Party (Trump)
2016 Presidential Elections Results (%) - Other
2020 Presidential Elections Results (%) - Democratic Party (Biden)
2020 Presidential Elections Results (%) - Republican Party (Trump)
2020 Presidential Elections Results (%) - Other
Ancestries Reported - Arab (%)
Ancestries Reported - Czech (%)
Ancestries Reported - Danish (%)
Ancestries Reported - Dutch (%)
Ancestries Reported - English (%)
Ancestries Reported - French (%)
Ancestries Reported - French Canadian (%)
Ancestries Reported - German (%)
Ancestries Reported - Greek (%)
Ancestries Reported - Hungarian (%)
Ancestries Reported - Irish (%)
Ancestries Reported - Italian (%)
Ancestries Reported - Lithuanian (%)
Ancestries Reported - Norwegian (%)
Ancestries Reported - Polish (%)
Ancestries Reported - Portuguese (%)
Ancestries Reported - Russian (%)
Ancestries Reported - Scotch-Irish (%)
Ancestries Reported - Scottish (%)
Ancestries Reported - Slovak (%)
Ancestries Reported - Subsaharan African (%)
Ancestries Reported - Swedish (%)
Ancestries Reported - Swiss (%)
Ancestries Reported - Ukrainian (%)
Ancestries Reported - United States (%)
Ancestries Reported - Welsh (%)
Ancestries Reported - West Indian (%)
Ancestries Reported - Other (%)
Educational Attainment - No schooling completed (%)
Educational Attainment - Less than high school (%)
Educational Attainment - High school or equivalent (%)
Educational Attainment - Less than 1 year of college (%)
Educational Attainment - 1 or more years of college (%)
Educational Attainment - Associate degree (%)
Educational Attainment - Bachelor's degree (%)
Educational Attainment - Master's degree (%)
Educational Attainment - Professional school degree (%)
Educational Attainment - Doctorate degree (%)
School Enrollment - Nursery, preschool (%)
School Enrollment - Kindergarten (%)
School Enrollment - Grade 1 to 4 (%)
School Enrollment - Grade 5 to 8 (%)
School Enrollment - Grade 9 to 12 (%)
School Enrollment - College undergrad (%)
School Enrollment - Graduate or professional (%)
School Enrollment - Not enrolled in school (%)
School enrollment - Public schools (%)
School enrollment - Private schools (%)
School enrollment - Not enrolled (%)
Median number of rooms in houses and condos
Median number of rooms in apartments
Housing units lacking complete plumbing facilities (%)
Housing units lacking complete kitchen facilities (%)
Density of houses
Urban houses (%)
Rural houses (%)
Households with people 60 years and over (%)
Households with people 65 years and over (%)
Households with people 75 years and over (%)
Households with one or more nonrelatives (%)
Households with no nonrelatives (%)
Population in households (%)
Family households (%)
Nonfamily households (%)
Population in families (%)
Family households with own children (%)
Median number of bedrooms in owner occupied houses
Mean number of bedrooms in owner occupied houses
Median number of bedrooms in renter occupied houses
Mean number of bedrooms in renter occupied houses
Median number of vehichles in owner occupied houses
Mean number of vehichles in owner occupied houses
Median number of vehichles in renter occupied houses
Mean number of vehichles in renter occupied houses
Mortgage status - with mortgage (%)
Mortgage status - with second mortgage (%)
Mortgage status - with home equity loan (%)
Mortgage status - with both second mortgage and home equity loan (%)
Mortgage status - without a mortgage (%)
Average family size
Average family size - White
Average family size - Black or African American
Average family size - Asian
Average family size - Hispanic or Latino
Average family size - American Indian and Alaska Native
Average family size - Multirace
Average family size - Other Race
Geographical mobility - Same house 1 year ago (%)
Geographical mobility - Moved within same county (%)
Geographical mobility - Moved from different county within same state (%)
Geographical mobility - Moved from different state (%)
Geographical mobility - Moved from abroad (%)
Place of birth - Born in state of residence (%)
Place of birth - Born in other state (%)
Place of birth - Native, outside of US (%)
Place of birth - Foreign born (%)
Housing units in structures - 1, detached (%)
Housing units in structures - 1, attached (%)
Housing units in structures - 2 (%)
Housing units in structures - 3 or 4 (%)
Housing units in structures - 5 to 9 (%)
Housing units in structures - 10 to 19 (%)
Housing units in structures - 20 to 49 (%)
Housing units in structures - 50 or more (%)
Housing units in structures - Mobile home (%)
Housing units in structures - Boat, RV, van, etc. (%)
House/condo owner moved in on average (years ago)
Renter moved in on average (years ago)
Year householder moved into unit - Moved in 1999 to March 2000 (%)
Year householder moved into unit - Moved in 1995 to 1998 (%)
Year householder moved into unit - Moved in 1990 to 1994 (%)
Year householder moved into unit - Moved in 1980 to 1989 (%)
Year householder moved into unit - Moved in 1970 to 1979 (%)
Year householder moved into unit - Moved in 1969 or earlier (%)
Means of transportation to work - Drove car alone (%)
Means of transportation to work - Carpooled (%)
Means of transportation to work - Public transportation (%)
Means of transportation to work - Bus or trolley bus (%)
Means of transportation to work - Streetcar or trolley car (%)
Means of transportation to work - Subway or elevated (%)
Means of transportation to work - Railroad (%)
Means of transportation to work - Ferryboat (%)
Means of transportation to work - Taxicab (%)
Means of transportation to work - Motorcycle (%)
Means of transportation to work - Bicycle (%)
Means of transportation to work - Walked (%)
Means of transportation to work - Other means (%)
Working at home (%)
Industry diversity
Most Common Industries - Agriculture, forestry, fishing and hunting, and mining (%)
Most Common Industries - Agriculture, forestry, fishing and hunting (%)
Most Common Industries - Mining, quarrying, and oil and gas extraction (%)
Most Common Industries - Construction (%)
Most Common Industries - Manufacturing (%)
Most Common Industries - Wholesale trade (%)
Most Common Industries - Retail trade (%)
Most Common Industries - Transportation and warehousing, and utilities (%)
Most Common Industries - Transportation and warehousing (%)
Most Common Industries - Utilities (%)
Most Common Industries - Information (%)
Most Common Industries - Finance and insurance, and real estate and rental and leasing (%)
Most Common Industries - Finance and insurance (%)
Most Common Industries - Real estate and rental and leasing (%)
Most Common Industries - Professional, scientific, and management, and administrative and waste management services (%)
Most Common Industries - Professional, scientific, and technical services (%)
Most Common Industries - Management of companies and enterprises (%)
Most Common Industries - Administrative and support and waste management services (%)
Most Common Industries - Educational services, and health care and social assistance (%)
Most Common Industries - Educational services (%)
Most Common Industries - Health care and social assistance (%)
Most Common Industries - Arts, entertainment, and recreation, and accommodation and food services (%)
Most Common Industries - Arts, entertainment, and recreation (%)
Most Common Industries - Accommodation and food services (%)
Most Common Industries - Other services, except public administration (%)
Most Common Industries - Public administration (%)
Occupation diversity
Most Common Occupations - Management, business, science, and arts occupations (%)
Most Common Occupations - Management, business, and financial occupations (%)
Most Common Occupations - Management occupations (%)
Most Common Occupations - Business and financial operations occupations (%)
Most Common Occupations - Computer, engineering, and science occupations (%)
Most Common Occupations - Computer and mathematical occupations (%)
Most Common Occupations - Architecture and engineering occupations (%)
Most Common Occupations - Life, physical, and social science occupations (%)
Most Common Occupations - Education, legal, community service, arts, and media occupations (%)
Most Common Occupations - Community and social service occupations (%)
Most Common Occupations - Legal occupations (%)
Most Common Occupations - Education, training, and library occupations (%)
Most Common Occupations - Arts, design, entertainment, sports, and media occupations (%)
Most Common Occupations - Healthcare practitioners and technical occupations (%)
Most Common Occupations - Health diagnosing and treating practitioners and other technical occupations (%)
Most Common Occupations - Health technologists and technicians (%)
Most Common Occupations - Service occupations (%)
Most Common Occupations - Healthcare support occupations (%)
Most Common Occupations - Protective service occupations (%)
Most Common Occupations - Fire fighting and prevention, and other protective service workers including supervisors (%)
Most Common Occupations - Law enforcement workers including supervisors (%)
Most Common Occupations - Food preparation and serving related occupations (%)
Most Common Occupations - Building and grounds cleaning and maintenance occupations (%)
Most Common Occupations - Personal care and service occupations (%)
Most Common Occupations - Sales and office occupations (%)
Most Common Occupations - Sales and related occupations (%)
Most Common Occupations - Office and administrative support occupations (%)
Most Common Occupations - Natural resources, construction, and maintenance occupations (%)
Most Common Occupations - Farming, fishing, and forestry occupations (%)
Most Common Occupations - Construction and extraction occupations (%)
Most Common Occupations - Installation, maintenance, and repair occupations (%)
Most Common Occupations - Production, transportation, and material moving occupations (%)
Most Common Occupations - Production occupations (%)
Most Common Occupations - Transportation occupations (%)
Most Common Occupations - Material moving occupations (%)
People in Group quarters - Institutionalized population (%)
People in Group quarters - Correctional institutions (%)
People in Group quarters - Federal prisons and detention centers (%)
People in Group quarters - Halfway houses (%)
People in Group quarters - Local jails and other confinement facilities (including police lockups) (%)
People in Group quarters - Military disciplinary barracks (%)
People in Group quarters - State prisons (%)
People in Group quarters - Other types of correctional institutions (%)
People in Group quarters - Nursing homes (%)
People in Group quarters - Hospitals/wards, hospices, and schools for the handicapped (%)
People in Group quarters - Hospitals/wards and hospices for chronically ill (%)
People in Group quarters - Hospices or homes for chronically ill (%)
People in Group quarters - Military hospitals or wards for chronically ill (%)
People in Group quarters - Other hospitals or wards for chronically ill (%)
People in Group quarters - Hospitals or wards for drug/alcohol abuse (%)
People in Group quarters - Mental (Psychiatric) hospitals or wards (%)
People in Group quarters - Schools, hospitals, or wards for the mentally retarded (%)
People in Group quarters - Schools, hospitals, or wards for the physically handicapped (%)
People in Group quarters - Institutions for the deaf (%)
People in Group quarters - Institutions for the blind (%)
People in Group quarters - Orthopedic wards and institutions for the physically handicapped (%)
People in Group quarters - Wards in general hospitals for patients who have no usual home elsewhere (%)
People in Group quarters - Wards in military hospitals for patients who have no usual home elsewhere (%)
People in Group quarters - Juvenile institutions (%)
People in Group quarters - Long-term care (%)
People in Group quarters - Homes for abused, dependent, and neglected children (%)
People in Group quarters - Residential treatment centers for emotionally disturbed children (%)
People in Group quarters - Training schools for juvenile delinquents (%)
People in Group quarters - Short-term care, detention or diagnostic centers for delinquent children (%)
People in Group quarters - Type of juvenile institution unknown (%)
People in Group quarters - Noninstitutionalized population (%)
People in Group quarters - College dormitories (includes college quarters off campus) (%)
People in Group quarters - Military quarters (%)
People in Group quarters - On base (%)
People in Group quarters - Barracks, unaccompanied personnel housing (UPH), (Enlisted/Officer), ;and similar group living quarters for military personnel (%)
People in Group quarters - Transient quarters for temporary residents (%)
People in Group quarters - Military ships (%)
People in Group quarters - Group homes (%)
People in Group quarters - Homes or halfway houses for drug/alcohol abuse (%)
People in Group quarters - Homes for the mentally ill (%)
People in Group quarters - Homes for the mentally retarded (%)
People in Group quarters - Homes for the physically handicapped (%)
People in Group quarters - Other group homes (%)
People in Group quarters - Religious group quarters (%)
People in Group quarters - Dormitories (%)
People in Group quarters - Agriculture workers' dormitories on farms (%)
People in Group quarters - Job Corps and vocational training facilities (%)
People in Group quarters - Other workers' dormitories (%)
People in Group quarters - Crews of maritime vessels (%)
People in Group quarters - Other nonhousehold living situations (%)
People in Group quarters - Other noninstitutional group quarters (%)
Residents speaking English at home (%)
Residents speaking English at home - Born in the United States (%)
Residents speaking English at home - Native, born elsewhere (%)
Residents speaking English at home - Foreign born (%)
Residents speaking Spanish at home (%)
Residents speaking Spanish at home - Born in the United States (%)
Residents speaking Spanish at home - Native, born elsewhere (%)
Residents speaking Spanish at home - Foreign born (%)
Residents speaking other language at home (%)
Residents speaking other language at home - Born in the United States (%)
Residents speaking other language at home - Native, born elsewhere (%)
Residents speaking other language at home - Foreign born (%)
Class of Workers - Employee of private company (%)
Class of Workers - Self-employed in own incorporated business (%)
Class of Workers - Private not-for-profit wage and salary workers (%)
Class of Workers - Local government workers (%)
Class of Workers - State government workers (%)
Class of Workers - Federal government workers (%)
Class of Workers - Self-employed workers in own not incorporated business and Unpaid family workers (%)
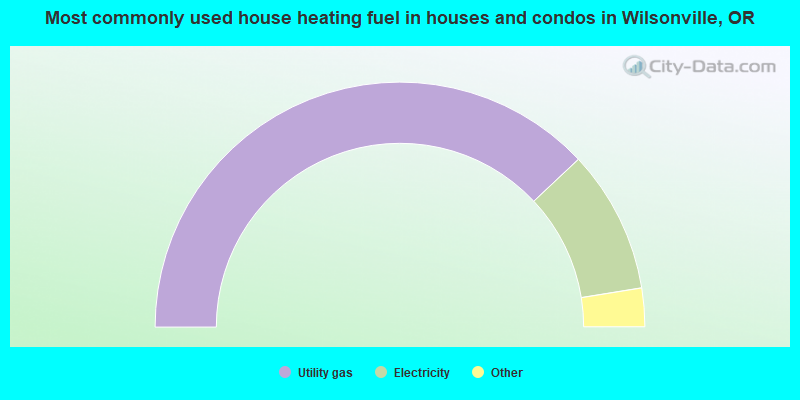
House heating fuel used in houses and condos - Utility gas (%)
House heating fuel used in houses and condos - Bottled, tank, or LP gas (%)
House heating fuel used in houses and condos - Electricity (%)
House heating fuel used in houses and condos - Fuel oil, kerosene, etc. (%)
House heating fuel used in houses and condos - Coal or coke (%)
House heating fuel used in houses and condos - Wood (%)
House heating fuel used in houses and condos - Solar energy (%)
House heating fuel used in houses and condos - Other fuel (%)
House heating fuel used in houses and condos - No fuel used (%)
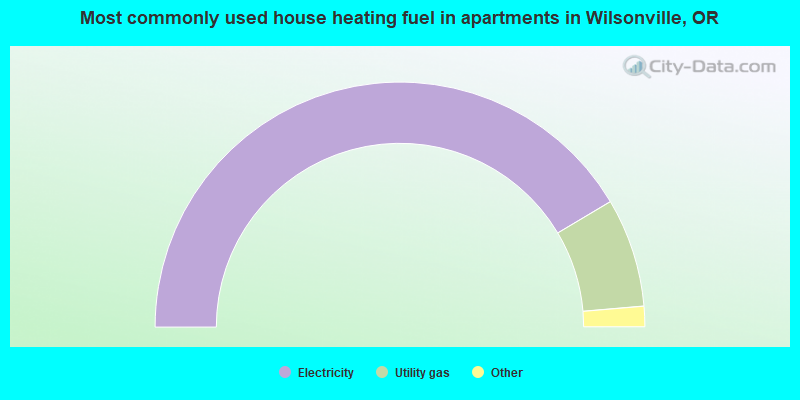
House heating fuel used in apartments - Utility gas (%)
House heating fuel used in apartments - Bottled, tank, or LP gas (%)
House heating fuel used in apartments - Electricity (%)
House heating fuel used in apartments - Fuel oil, kerosene, etc. (%)
House heating fuel used in apartments - Coal or coke (%)
House heating fuel used in apartments - Wood (%)
House heating fuel used in apartments - Solar energy (%)
House heating fuel used in apartments - Other fuel (%)
House heating fuel used in apartments - No fuel used (%)
Armed forces status - In Armed Forces (%)
Armed forces status - Civilian (%)
Armed forces status - Civilian - Veteran (%)
Armed forces status - Civilian - Nonveteran (%)
Fatal accidents locations in years 2005-2021
Fatal accidents locations in 2005
Fatal accidents locations in 2006
Fatal accidents locations in 2007
Fatal accidents locations in 2008
Fatal accidents locations in 2009
Fatal accidents locations in 2010
Fatal accidents locations in 2011
Fatal accidents locations in 2012
Fatal accidents locations in 2013
Fatal accidents locations in 2014
Fatal accidents locations in 2015
Fatal accidents locations in 2016
Fatal accidents locations in 2017
Fatal accidents locations in 2018
Fatal accidents locations in 2019
Fatal accidents locations in 2020
Fatal accidents locations in 2021
Alcohol use - People drinking some alcohol every month (%)
Alcohol use - People not drinking at all (%)
Alcohol use - Average days/month drinking alcohol
Alcohol use - Average drinks/week
Alcohol use - Average days/year people drink much
Audiometry - Average condition of hearing (%)
Audiometry - People that can hear a whisper from across a quiet room (%)
Audiometry - People that can hear normal voice from across a quiet room (%)
Audiometry - Ears ringing, roaring, buzzing (%)
Audiometry - Had a job exposure to loud noise (%)
Audiometry - Had off-work exposure to loud noise (%)
Blood Pressure & Cholesterol - Has high blood pressure (%)
Blood Pressure & Cholesterol - Checking blood pressure at home (%)
Blood Pressure & Cholesterol - Frequently checking blood cholesterol (%)
Blood Pressure & Cholesterol - Has high cholesterol level (%)
Consumer Behavior - Money monthly spent on food at supermarket/grocery store
Consumer Behavior - Money monthly spent on food at other stores
Consumer Behavior - Money monthly spent on eating out
Consumer Behavior - Money monthly spent on carryout/delivered foods
Consumer Behavior - Income spent on food at supermarket/grocery store (%)
Consumer Behavior - Income spent on food at other stores (%)
Consumer Behavior - Income spent on eating out (%)
Consumer Behavior - Income spent on carryout/delivered foods (%)
Current Health Status - General health condition (%)
Current Health Status - Blood donors (%)
Current Health Status - Has blood ever tested for HIV virus (%)
Current Health Status - Left-handed people (%)
Dermatology - People using sunscreen (%)
Diabetes - Diabetics (%)
Diabetes - Had a blood test for high blood sugar (%)
Diabetes - People taking insulin (%)
Diet Behavior & Nutrition - Diet health (%)
Diet Behavior & Nutrition - Milk product consumption (# of products/month)
Diet Behavior & Nutrition - Meals not home prepared (#/week)
Diet Behavior & Nutrition - Meals from fast food or pizza place (#/week)
Diet Behavior & Nutrition - Ready-to-eat foods (#/month)
Diet Behavior & Nutrition - Frozen meals/pizza (#/month)
Drug Use - People that ever used marijuana or hashish (%)
Drug Use - Ever used hard drugs (%)
Drug Use - Ever used any form of cocaine (%)
Drug Use - Ever used heroin (%)
Drug Use - Ever used methamphetamine (%)
Health Insurance - People covered by health insurance (%)
Kidney Conditions-Urology - Avg. # of times urinating at night
Medical Conditions - People with asthma (%)
Medical Conditions - People with anemia (%)
Medical Conditions - People with psoriasis (%)
Medical Conditions - People with overweight (%)
Medical Conditions - Elderly people having difficulties in thinking or remembering (%)
Medical Conditions - People who ever received blood transfusion (%)
Medical Conditions - People having trouble seeing even with glass/contacts (%)
Medical Conditions - People with arthritis (%)
Medical Conditions - People with gout (%)
Medical Conditions - People with congestive heart failure (%)
Medical Conditions - People with coronary heart disease (%)
Medical Conditions - People with angina pectoris (%)
Medical Conditions - People who ever had heart attack (%)
Medical Conditions - People who ever had stroke (%)
Medical Conditions - People with emphysema (%)
Medical Conditions - People with thyroid problem (%)
Medical Conditions - People with chronic bronchitis (%)
Medical Conditions - People with any liver condition (%)
Medical Conditions - People who ever had cancer or malignancy (%)
Mental Health - People who have little interest in doing things (%)
Mental Health - People feeling down, depressed, or hopeless (%)
Mental Health - People who have trouble sleeping or sleeping too much (%)
Mental Health - People feeling tired or having little energy (%)
Mental Health - People with poor appetite or overeating (%)
Mental Health - People feeling bad about themself (%)
Mental Health - People who have trouble concentrating on things (%)
Mental Health - People moving or speaking slowly or too fast (%)
Mental Health - People having thoughts they would be better off dead (%)
Oral Health - Average years since last visit a dentist
Oral Health - People embarrassed because of mouth (%)
Oral Health - People with gum disease (%)
Oral Health - General health of teeth and gums (%)
Oral Health - Average days a week using dental floss/device
Oral Health - Average days a week using mouthwash for dental problem
Oral Health - Average number of teeth
Pesticide Use - Households using pesticides to control insects (%)
Pesticide Use - Households using pesticides to kill weeds (%)
Physical Activity - People doing vigorous-intensity work activities (%)
Physical Activity - People doing moderate-intensity work activities (%)
Physical Activity - People walking or bicycling (%)
Physical Activity - People doing vigorous-intensity recreational activities (%)
Physical Activity - People doing moderate-intensity recreational activities (%)
Physical Activity - Average hours a day doing sedentary activities
Physical Activity - Average hours a day watching TV or videos
Physical Activity - Average hours a day using computer
Physical Functioning - People having limitations keeping them from working (%)
Physical Functioning - People limited in amount of work they can do (%)
Physical Functioning - People that need special equipment to walk (%)
Physical Functioning - People experiencing confusion/memory problems (%)
Physical Functioning - People requiring special healthcare equipment (%)
Prescription Medications - Average number of prescription medicines taking
Preventive Aspirin Use - Adults 40+ taking low-dose aspirin (%)
Reproductive Health - Vaginal deliveries (%)
Reproductive Health - Cesarean deliveries (%)
Reproductive Health - Deliveries resulted in a live birth (%)
Reproductive Health - Pregnancies resulted in a delivery (%)
Reproductive Health - Women breastfeeding newborns (%)
Reproductive Health - Women that had a hysterectomy (%)
Reproductive Health - Women that had both ovaries removed (%)
Reproductive Health - Women that have ever taken birth control pills (%)
Reproductive Health - Women taking birth control pills (%)
Reproductive Health - Women that have ever used Depo-Provera or injectables (%)
Reproductive Health - Women that have ever used female hormones (%)
Sexual Behavior - People 18+ that ever had sex (vaginal, anal, or oral) (%)
Sexual Behavior - Males 18+ that ever had vaginal sex with a woman (%)
Sexual Behavior - Males 18+ that ever performed oral sex on a woman (%)
Sexual Behavior - Males 18+ that ever had anal sex with a woman (%)
Sexual Behavior - Males 18+ that ever had any sex with a man (%)
Sexual Behavior - Females 18+ that ever had vaginal sex with a man (%)
Sexual Behavior - Females 18+ that ever performed oral sex on a man (%)
Sexual Behavior - Females 18+ that ever had anal sex with a man (%)
Sexual Behavior - Females 18+ that ever had any kind of sex with a woman (%)
Sexual Behavior - Average age people first had sex
Sexual Behavior - Average number of female sex partners in lifetime (males 18+)
Sexual Behavior - Average number of female vaginal sex partners in lifetime (males 18+)
Sexual Behavior - Average age people first performed oral sex on a woman (18+)
Sexual Behavior - Average number of woman performed oral sex on in lifetime (18+)
Sexual Behavior - Average number of male sex partners in lifetime (males 18+)
Sexual Behavior - Average number of male anal sex partners in lifetime (males 18+)
Sexual Behavior - Average age people first performed oral sex on a man (18+)
Sexual Behavior - Average number of male oral sex partners in lifetime (18+)
Sexual Behavior - People using protection when performing oral sex (%)
Sexual Behavior - Average number of times people have vaginal or anal sex a year
Sexual Behavior - People having sex without condom (%)
Sexual Behavior - Average number of male sex partners in lifetime (females 18+)
Sexual Behavior - Average number of male vaginal sex partners in lifetime (females 18+)
Sexual Behavior - Average number of female sex partners in lifetime (females 18+)
Sexual Behavior - Circumcised males 18+ (%)
Sleep Disorders - Average hours sleeping at night
Sleep Disorders - People that has trouble sleeping (%)
Smoking-Cigarette Use - People smoking cigarettes (%)
Taste & Smell - People 40+ having problems with smell (%)
Taste & Smell - People 40+ having problems with taste (%)
Taste & Smell - People 40+ that ever had wisdom teeth removed (%)
Taste & Smell - People 40+ that ever had tonsils teeth removed (%)
Taste & Smell - People 40+ that ever had a loss of consciousness because of a head injury (%)
Taste & Smell - People 40+ that ever had a broken nose or other serious injury to face or skull (%)
Taste & Smell - People 40+ that ever had two or more sinus infections (%)
Weight - Average height (inches)
Weight - Average weight (pounds)
Weight - Average BMI
Weight - People that are obese (%)
Weight - People that ever were obese (%)
Weight - People trying to lose weight (%)
Latest news from Wilsonville, OR collected exclusively by city-data.com from local newspapers, TV, and radio stations
Wilsonville, OR City Guides: Ancestries: English (11.3%), German (10.1%), American (6.9%), Irish (6.6%), European (6.0%), Norwegian (2.9%).
Current Local Time:
Land area: 6.71 square miles.
Population density: 3,964 people per square mile (average).
2,923 residents are foreign born (5.0% Asia , 3.1% Latin America ).
This city:
11.2%Oregon:
9.8%
Median real estate property taxes paid for housing units with mortgages in 2022: $6,227 (1.0%)Median real estate property taxes paid for housing units with no mortgage in 2022: $5,704 (0.9%)
Nearest city with pop. 50,000+: Northwest Clackamas, OR (9.5 miles
Nearest city with pop. 1,000,000+: Los Angeles, CA
Nearest cities:
Barlow, OR (2.1 miles),
Latitude: 45.31 N, Longitude: 122.77 W
Daytime population change due to commuting: +7,264 (+27.8%)Workers who live and work in this city: 5,089 (38.4%)
Area code commonly used in this area: 503
Property values in Wilsonville, OR
Single-family new house construction building permits:
2022: 47 buildings , average cost: $389,5002021: 117 buildings , average cost: $370,3002020: 82 buildings , average cost: $290,3002019: 111 buildings , average cost: $275,1002018: 118 buildings , average cost: $226,9002017: 267 buildings , average cost: $233,9002016: 187 buildings , average cost: $269,9002015: 352 buildings , average cost: $267,1002014: 242 buildings , average cost: $211,2002013: 198 buildings , average cost: $185,3002012: 99 buildings , average cost: $227,6002011: 81 buildings , average cost: $225,1002010: 29 buildings , average cost: $252,0002009: 20 buildings , average cost: $273,3002008: 34 buildings , average cost: $276,0002007: 94 buildings , average cost: $237,6002006: 146 buildings , average cost: $247,0002005: 96 buildings , average cost: $242,0002004: 103 buildings , average cost: $249,8002003: 76 buildings , average cost: $232,5002002: 45 buildings , average cost: $278,0002001: 53 buildings , average cost: $231,6002000: 90 buildings , average cost: $182,4001999: 81 buildings , average cost: $164,9001998: 96 buildings , average cost: $154,9001997: 115 buildings , average cost: $142,700Unemployment in December 2023:
Population change in the 1990s: +6,425 (+84.9%).
Most common occupations in Wilsonville, OR (%)
Both Males Females
Other management occupations, except farmers and farm managers (6.0%)
Other sales and related occupations, including supervisors (5.0%)
Sales representatives, services, wholesale and manufacturing (4.7%)
Other office and administrative support workers, including supervisors (4.3%)
Computer specialists (3.5%)
Retail sales workers, except cashiers (3.2%)
Top executives (3.1%)
Other management occupations, except farmers and farm managers (7.6%)
Sales representatives, services, wholesale and manufacturing (6.6%)
Computer specialists (5.7%)
Other sales and related occupations, including supervisors (5.3%)
Top executives (4.6%)
Engineers (4.0%)
Advertising, marketing, promotions, public relations, and sales managers (3.5%)
Other office and administrative support workers, including supervisors (6.0%)
Secretaries and administrative assistants (5.8%)
Preschool, kindergarten, elementary, and middle school teachers (5.6%)
Bookkeeping, accounting, and auditing clerks (4.9%)
Other sales and related occupations, including supervisors (4.8%)
Information and record clerks, except customer service representatives (4.6%)
Registered nurses (4.0%)
Earthquake activity:
Wilsonville-area historical earthquake activity is significantly above Oregon state average. It is 1445% greater than the overall U.S. average. On 4/13/1949 at 19:55:42, a magnitude 7.0 (7.0 UK, Class: Major, Intensity: VIII - XII) earthquake occurred 135.0 miles away from the city center, causing $80,000,000 total damage On 2/28/2001 at 18:54:32, a magnitude 6.8 (6.5 MB, 6.6 MS, 6.8 MW, Class: Strong, Intensity: VII - IX) earthquake occurred 123.7 miles away from the city center, causing $2,000,000,000 total damage and $305,000,000 insured lossesOn 2/28/2001 at 18:54:32, a magnitude 6.8 (6.8 MD, Depth: 32.2 mi) earthquake occurred 127.4 miles away from the city center On 1/31/1922 at 13:17:28, a magnitude 7.6 (7.6 UK) earthquake occurred 348.4 miles away from Wilsonville center On 4/29/1965 at 15:28:43, a magnitude 6.6 (6.6 UK) earthquake occurred 140.6 miles away from the city center, causing $28,000,000 total damage On 11/8/1980 at 10:27:34, a magnitude 7.2 (6.2 MB, 7.2 MS, 7.2 MW, 7.0 ML) earthquake occurred 300.4 miles away from the city center Magnitude types: body-wave magnitude (MB), duration magnitude (MD), local magnitude (ML), surface-wave magnitude (MS), moment magnitude (MW) Natural disasters: The number of natural disasters in Clackamas County (13) is near the US average (15).Major Disasters (Presidential) Declared: 11Emergencies Declared: 1Floods: 7, Landslides: 4, Mudslides: 4, Storms: 4, Winter Storms: 4, Snows: 2, Winds: 2, Earthquake: 1, Fire: 1, Heavy Rain: 1, Hurricane: 1, Other: 1 (Note: some incidents may be assigned to more than one category). Main business address for: HOLLYWOOD ENTERTAINMENT CORP SERVICES-VIDEO TAPE RENTAL ), INFOCUS CORP COMPUTER PERIPHERAL EQUIPMENT, NEC ), MENTOR GRAPHICS CORP SERVICES-COMPUTER INTEGRATED SYSTEMS DESIGN ).
Hospitals and medical centers in Wilsonville: DAMMASCH STATE HOSPITAL (28801 S.W. 110TH ST) SIGNATURE HOSPICE (25117 SW PARKWAY, SUITE F) INNOVATIVE SENIOR CARE HOME HEALTH (8855 SW HOLLY LANE SUITE 123)
SIGNATURE HOME HEALTH CARE (25117 SW PARKWAY, SUITE F)
MARQUIS CARE AT WILSONVILLE (30900 SW PARKWAY AVENUE)
Amtrak stations near Wilsonville: 10 miles: OREGON CITY (1757 WASHINGTON ST.) 16 miles: PORTLAND (800 NW 6TH AVE.) Services: ticket office, fully wheelchair accessible, enclosed waiting area, public restrooms, public payphones, full-service food facilities, paid short-term parking, paid long-term parking, call for car rental service, taxi stand, intercity bus service, public transit connection.
College/University in Wilsonville: Pioneer Pacific College Full-time enrollment: 2,194; Location: 27501 SW Parkway Ave; Private, for-profit; Website: www.pioneerpacific.edu)
Other colleges/universities with over 2000 students near Wilsonville:
Portland Community College (about 10 miles; Portland, OR ; Full-time enrollment: 23,600)
Clackamas Community College (about 10 miles; Oregon City, OR ; FT enrollment: 4,261)
George Fox University (about 10 miles; Newberg, OR ; FT enrollment: 2,954)
Lewis & Clark College (about 11 miles; Portland, OR ; FT enrollment: 2,864)
Portland State University (about 15 miles; Portland, OR ; FT enrollment: 21,450)
University of Portland (about 19 miles; Portland, OR ; FT enrollment: 4,030)
Concordia University-Portland (about 20 miles; Portland, OR ; FT enrollment: 3,996)
Public high schools in Wilsonville: WILSONVILLE HIGH SCHOOL Students: 1,031, Location: 6800 WILSONVILLE RD, Grades: 9-12)ARTS AND TECHNOLOGY HIGH SCHOOL Location: 29796 SW TOWN CENTER LOOP, Grades: 9-12)
Public elementary/middle schools in Wilsonville:
Private elementary/middle school in Wilsonville: VICTORY ACADEMY Students: 23, Location: 27960 SW CANYON CREEK RD, Grades: KG-5)
See full list of schools located in Wilsonville Library in Wilsonville: WILSONVILLE PUBLIC LIBRARY Operating income: $835,330; Location: 8200 SW WILSONVILLE RD; 92,757 books ; 14,947 audio materials ; 12,000 video materials ; 3 local licensed databases ; 27 state licensed databases ; 12 other licensed databases ; 173 print serial subscriptions ; 6 electronic serial subscriptions )
Notable locations in Wilsonville: (A) , Wilsonville Wastewater Treatment Plant (B) , Cherriots Wilsonville Station (C) , Boones Ferry (D) , Wilsonville Memorial Park Boat Dock (E) , Cherriots Transit Wilsonville Park and Ride (F) , Charbonneau Golf Course (G) , Wilsonville City Hall (H) , Wilsonville Municipal Court (I) , Wilsonville Public Library (J) , Wilsonville Public Works (K) , Tualatin Valley Fire and Rescue Station 56 Elligsen Road (L) , Tualatin Valley Fire and Rescue Station 52 Wilsonville (M) . Display/hide their locations on the map
Main business address in Wilsonville include: (A) , INFOCUS CORP (B) , MENTOR GRAPHICS CORP (C) . Display/hide their locations on the map
Churches in Wilsonville include: (A) , Christian Missionary Alliance (B) , Living Enrichment Center (C) , Saint Francis Episcopal Church (D) , Creekside Bible Church (E) , Grace Chapel (F) , Saint Cyril Catholic Church (G) , Meridian United Church of Christ (H) , Valley Christian Church (I) . Display/hide their locations on the map
Creeks: (A) , Boeckman Creek (B) , Corral Creek (C) , Tapman Creek (D) . Display/hide their locations on the map
Parks in Wilsonville include: (1) , Boones Ferry City Park (2) , Courtside City Park (3) , River Fox City Park (4) , Memorial City Park (5) , Park at Merryfield (6) , Montebello City Park (7) , Town Center City Park (8) , Tranquil City Park (9) . Display/hide their locations on the map
Tourist attractions:
Hotels:
Birthplace of: Derek Devine - Football player.
Clackamas County has a predicted average indoor radon screening level less than 2 pCi/L (pico curies per liter) - Low Potential Drinking water stations with addresses in Wilsonville and their reported violations in the past:
CENTURY MEADOWS INC (Population served: 480, Groundwater):
Past monitoring violations:
3 routine major monitoring violations
52 regular monitoring violations
Population served: 267, Groundwater):
Past health violations:
MCL, Monthly (TCR) - Between OCT-2010 and DEC-2010, Contaminant: Coliform. Follow-up actions: St Public Notif received (NOV-15-2010), St Public Notif requested (DEC-20-2010), St Violation/Reminder Notice (DEC-27-2010), St Compliance achieved (FEB-03-2011)
MCL, Monthly (TCR) - In NOV-2009, Contaminant: Coliform. Follow-up actions: St Compliance achieved (OCT-02-2009), St Public Notif requested (DEC-11-2009), St Violation/Reminder Notice (DEC-28-2009)
Past monitoring violations:
Monitoring, Source Water (GWR) - In NOV-01-2010, Contaminant: E. COLI. Follow-up actions: St Violation/Reminder Notice (DEC-27-2010), St Compliance achieved (DEC-31-2010)
7 routine major monitoring violations
2 minor monitoring violations
One regular monitoring violation
Drinking water stations with addresses in Wilsonville that have no violations reported:
SUBWAY HWY 34 & I5 (Population served: 100, Primary Water Source Type: Groundwater)
Average household size: This city:
2.3 peopleOregon:
2.5 people
Percentage of family households: This city:
59.3%Whole state:
63.4%
Percentage of households with unmarried partners: This city:
7.2%Whole state:
8.0%
Likely homosexual households (counted as self-reported same-sex unmarried-partner households)
Lesbian couples: 0.4% of all households Gay men: 0.2% of all households
People in group quarters in Wilsonville in 2010:
1,548 people in state prisons
32 people in other noninstitutional facilities
10 people in workers' group living quarters and job corps centers
6 people in nursing facilities/skilled-nursing facilities
people in other noninstitutional group quarters in 2000Banks with most branches in Wilsonville (2011 data):
U.S. Bank National Association: Wilsonville Branch at 29112 Southwest Town Center Loop West, branch established on 1975/07/21; Wilsonville Fred Meyer at 30300 Southwest Boones Ferry Road, branch established on 2011/07/15. Info updated 2012/01/30: Bank assets: $330,470.8 mil, Deposits: $236,091.5 mil, headquarters in Cincinnati, OH, positive income , 3121 total offices , Holding Company: U.S. Bancorp
JPMorgan Chase Bank, National Association: Wilsonville & Boone Ferry Banking Ce at 30060 Sw Boone Ferry Rd, Ste 42, branch established on 2011/09/15; Wilsonville at 8231 Sw Wilsonville Rd, branch established on 1993/03/29. Info updated 2011/11/10: Bank assets: $1,811,678.0 mil, Deposits: $1,190,738.0 mil, headquarters in Columbus, OH, positive income , International Specialization, 5577 total offices , Holding Company: Jpmorgan Chase & Co.
Wells Fargo Bank, National Association: Wilsonville Branch at 8699 Sw Main Street, branch established on 2000/02/23. Info updated 2011/04/05: Bank assets: $1,161,490.0 mil, Deposits: $905,653.0 mil, headquarters in Sioux Falls, SD, positive income , 6395 total offices , Holding Company: Wells Fargo & Company
Washington Federal: Wilsonville Branch at 29028 Southwest Town Center Loop E, branch established on 1975/01/01. Info updated 2011/12/19: Bank assets: $13,653.0 mil, Deposits: $8,905.8 mil, headquarters in Seattle, WA, positive income , Mortgage Lending Specialization, 174 total offices
Sterling Savings Bank: Wilsonvillee Branch at 25529 Southwest Gwen Drive, branch established on 2004/06/01. Info updated 2012/03/21: Bank assets: $9,207.8 mil, Deposits: $6,454.1 mil, headquarters in Spokane, WA, positive income , Commercial Lending Specialization, 192 total offices , Holding Company: Sterling Financial Corporation
West Coast Bank: Wilsonville Branch at 29702 Southwest Town Center Loop West, branch established on 1991/06/16. Info updated 2010/09/16: Bank assets: $2,424.8 mil, Deposits: $1,925.6 mil, headquarters in Lake Oswego, OR, positive income , Commercial Lending Specialization, 63 total offices , Holding Company: West Coast Bancorp
Bank of America, National Association: Wilsonville Branch at 29778 Southwest Town Center, Loop West, branch established on 1968/02/17. Info updated 2009/11/18: Bank assets: $1,451,969.3 mil, Deposits: $1,077,176.8 mil, headquarters in Charlotte, NC, positive income , 5782 total offices , Holding Company: Bank Of America Corporation
KeyBank National Association: Wilsonville Deycenter Branch at 9490 Sw Wilsonville Road, branch established on 2004/09/13. Info updated 2008/03/03: Bank assets: $86,198.8 mil, Deposits: $64,214.8 mil, headquarters in Cleveland, OH, positive income , Commercial Lending Specialization, 1067 total offices , Holding Company: Keycorp
Heritage Bank: Springridge Branch at 32200 Sw French Prairie Rd, branch established on 1999/04/01. Info updated 2011/09/02: Bank assets: $1,202.8 mil, Deposits: $1,009.5 mil, headquarters in Olympia, WA, positive income , Commercial Lending Specialization, 28 total offices , Holding Company: Heritage Financial Corporation
For population 15 years and over in Wilsonville:
Never married: 31.8%Now married: 50.6%Separated: 0.5%Widowed: 5.2%Divorced: 11.9% For population 25 years and over in Wilsonville:
High school or higher: 95.3%Bachelor's degree or higher: 46.2%Graduate or professional degree: 15.6%Unemployed: 4.0%Mean travel time to work (commute): 20.6 minutes
Education Gini index (Inequality in education) Here:
10.6Oregon average:
11.6
Religion statistics for Wilsonville, OR (based on Clackamas County data)
Religion Adherents Congregations Evangelical Protestant 49,829 194 Catholic 27,128 13 Other 15,447 51 Mainline Protestant 15,118 49 Orthodox 2,275 5 None 266,195 -
Source: Clifford Grammich, Kirk Hadaway, Richard Houseal, Dale E.Jones, Alexei Krindatch, Richie Stanley and Richard H.Taylor. 2012. 2010 U.S.Religion Census: Religious Congregations & Membership Study. Association of Statisticians of American Religious Bodies. Jones, Dale E., et al. 2002. Congregations and Membership in the United States 2000. Nashville, TN: Glenmary Research Center. Graphs represent county-level data
Food Environment Statistics: Number of grocery stores : 56Here :
1.49 / 10,000 pop.State :
2.03 / 10,000 pop.
Number of supercenters and club stores : 10Clackamas County :
0.27 / 10,000 pop.Oregon :
0.33 / 10,000 pop.
Number of convenience stores (no gas) : 55Here :
1.47 / 10,000 pop.Oregon :
2.01 / 10,000 pop.
Number of convenience stores (with gas) : 59This county :
1.57 / 10,000 pop.Oregon :
1.69 / 10,000 pop.
Number of full-service restaurants : 284This county :
7.57 / 10,000 pop.Oregon :
9.93 / 10,000 pop.
Adult diabetes rate : This county :
6.9%Oregon :
7.4%
Low-income preschool obesity rate : Health and Nutrition:
Average overall health of teeth and gums : This city:
51.4%Oregon:
46.8%
Average BMI : Wilsonville:
28.2Oregon:
28.5
People feeling badly about themselves : This city:
19.3%Oregon:
21.2%
People not drinking alcohol at all : Wilsonville:
9.1%State:
10.1%
Average hours sleeping at night : Wilsonville:
6.9Oregon:
6.8
Overweight people : Wilsonville:
33.1%Oregon:
33.3%
General health condition : Wilsonville:
59.5%Oregon:
56.5%
Average condition of hearing : More about Health and Nutrition of Wilsonville, OR Residents
Local government employment and payroll (March 2022)
Function
Full-time employees
Monthly full-time payroll
Average yearly full-time wage
Part-time employees
Monthly part-time payroll
Transit
38 $229,311 $72,414 8 $23,923 Other and Unallocable
25 $162,794 $78,141 1 $1,882 Financial Administration
17 $130,304 $91,979 4 $12,602 Other Government Administration
15 $122,215 $97,772 0 $0 Parks and Recreation
13 $72,095 $66,549 0 $0 Sewerage
6 $26,735 $53,470 0 $0 Water Supply
6 $32,488 $64,976 0 $0 Local Libraries
5 $31,622 $75,893 24 $49,392 Streets and Highways
3 $14,019 $56,076 0 $0 Judicial and Legal
3 $39,248 $156,992 1 $1,107 Welfare
3 $18,215 $72,860 3 $7,772 Housing and Community Development (Local)
2 $20,938 $125,628 0 $0
Totals for Government
136 $899,985 $79,410 41 $96,678
Wilsonville government finances - Expenditure in 2021 (per resident):
Construction - Regular Highways: $6,735,000 ($253.22)
Sewerage: $5,435,000 ($204.35)Parks and Recreation: $3,548,000 ($133.40)Water Utilities: $2,821,000 ($106.06)General Public Buildings: $2,465,000 ($92.68)Natural Resources - Other: $1,174,000 ($44.14)Transit Utilities: $300,000 ($11.28)Current Operations - Central Staff Services: $6,373,000 ($239.61)
Transit Utilities: $5,538,000 ($208.22)Police Protection: $5,060,000 ($190.25)Water Utilities: $4,394,000 ($165.21)Sewerage: $3,720,000 ($139.87)General - Other: $2,379,000 ($89.45)Parks and Recreation: $2,064,000 ($77.60)Libraries: $2,027,000 ($76.21)Financial Administration: $1,444,000 ($54.29)Protective Inspection and Regulation - Other: $1,180,000 ($44.37)General Public Buildings: $1,018,000 ($38.27)Regular Highways: $989,000 ($37.18)Natural Resources - Other: $872,000 ($32.79)Judicial and Legal Services: $772,000 ($29.03)Public Welfare - Other: $695,000 ($26.13)General - Interest on Debt: $1,736,000 ($65.27)
Other Capital Outlay - Water Utilities: $189,000 ($7.11)
Sewerage: $88,000 ($3.31)General - Other: $51,000 ($1.92)Natural Resources - Other: $48,000 ($1.80)Regular Highways: $10,000 ($0.38)General Public Building: $6,000 ($0.23)Parks and Recreation: $6,000 ($0.23)Total Salaries and Wages: $18,463,000 ($694.18)
Wilsonville government finances - Revenue in 2021 (per resident):
Charges - Sewerage: $7,868,000 ($295.82)
Other: $3,932,000 ($147.84)Regular Highways: $2,184,000 ($82.11)Parks and Recreation: $111,000 ($4.17)Miscellaneous Commercial Activities: $109,000 ($4.10)Federal Intergovernmental - Transit Utilities: $689,000 ($25.91)
Other: $171,000 ($6.43)Local Intergovernmental - Highways: $2,949,000 ($110.88)
Other: $1,466,000 ($55.12)Water Utilities: $846,000 ($31.81)Public Welfare: $203,000 ($7.63)Transit Utilities: $64,000 ($2.41)Housing and Community Development: $51,000 ($1.92)Miscellaneous - Special Assessments: $8,183,000 ($307.67)
Interest Earnings: $1,835,000 ($68.99)Rents: $388,000 ($14.59)Fines and Forfeits: $263,000 ($9.89)Donations From Private Sources: $17,000 ($0.64)General Revenue - Other: $17,000 ($0.64)Sale of Property: $2,000 ($0.08)Revenue - Water Utilities: $9,497,000 ($357.07)
State Intergovernmental - Highways: $1,919,000 ($72.15)
Transit Utilities: $1,343,000 ($50.49)General Local Government Support: $1,012,000 ($38.05)Housing and Community Development: $95,000 ($3.57)Other: $4,000 ($0.15)Tax - Property: $17,795,000 ($669.06)
Other License: $5,298,000 ($199.20)Public Utilities Sales: $3,500,000 ($131.59)Occupation and Business License - Other: $2,719,000 ($102.23)Other: $368,000 ($13.84)
Wilsonville government finances - Debt in 2021 (per resident):
Long Term Debt - Beginning Outstanding - Unspecified Public Purpose: $56,246,000 ($2114.75)
Outstanding Unspecified Public Purpose: $50,353,000 ($1893.18)Retired Unspecified Public Purpose: $30,232,000 ($1136.67)Issue, Unspecified Public Purpose: $24,340,000 ($915.14)
Wilsonville government finances - Cash and Securities in 2021 (per resident):
Other Funds - Cash and Securities: $102,220,000 ($3843.29)
Sinking Funds - Cash and Securities: $51,829,000 ($1948.68)
9.10% of this county's 2021 resident taxpayers lived in other counties in 2020 ($99,084 average adjusted gross income )
Here:
9.10%Oregon average:
8.20%
0.01% of residents moved from foreign countries ($71 average AGI )Clackamas County:
0.01%Oregon average:
0.01%
Top counties from which taxpayers relocated into this county between 2020 and 2021:
Businesses in Wilsonville, OR
Name Count Name Count
7-Eleven 1 McDonald's 1 AT&T 1 Nike 1 Ace Hardware 1 Nissan 1 Albertsons 1 Office Depot 1 Arby's 1 Panda Express 1 Audi 1 Payless 1 Bally Total Fitness 1 Penske 1 Baskin-Robbins 1 PetSmart 1 Burger King 2 Pier 1 Imports 1 Chevrolet 1 Quality 1 Costco 1 Quiznos 1 Curves 1 Red Robin 1 DHL 1 Rite Aid 1 Decora Cabinetry 2 SONIC Drive-In 1 Dennys 1 Sprint Nextel 1 Discount Tire 1 Starbucks 3 Domino's Pizza 1 Subway 3 FedEx 5 Super 8 2 GNC 1 T-Mobile 2 GameStop 1 Taco Bell 1 H&R Block 1 Target 1 Holiday Inn 1 Toyota 1 Honda 1 U-Haul 1 Jamba Juice 1 UPS 4 LA Fitness 1 Walgreens 1 La Quinta 1 Wendy's 1 MasterBrand Cabinets 5
Strongest AM radio stations in Wilsonville:
KPOJ (620 AM; 50 kW; PORTLAND, OR; Owner: CITICASTERS LICENSES, L.P.)
KEX (1190 AM; 50 kW; PORTLAND, OR; Owner: CITICASTERS LICENSES, L.P.)
KKSN (1520 AM; 50 kW; OREGON CITY, OR; Owner: ENTERCOM PORTLAND LICENSE, LLC)
KXL (750 AM; 50 kW; PORTLAND, OR; Owner: ROSE CITY RADIO CORPORATION)
KOTK (1080 AM; 50 kW; PORTLAND, OR; Owner: FISHER BROADCASTING - PORTLAND RADIO, L.L.C.)
KPAM (860 AM; 50 kW; TROUTDALE, OR; Owner: PAMPLIN BROADCASTING-OREGON, INC.)
KKSL (1290 AM; 10 kW; LAKE OSWEGO, OR; Owner: ABC, INC.)
KKAD (1550 AM; 50 kW; VANCOUVER, WA; Owner: PAMPLIN BROADCASTING-WASHINGTON, INC)
KDZR (1640 AM; 10 kW; LAKE OSWEGO, OR; Owner: ABC, INC.)
KUPL (970 AM; 5 kW; PORTLAND, OR; Owner: INFINITY RADIO OPERATIONS INC.)
KFXX (910 AM; 10 kW; VANCOUVER, WA; Owner: ENTERCOM PORTLAND LICENSE, LLC (DE))
KBNP (1410 AM; 5 kW; PORTLAND, OR; Owner: KBNP RADIO, INC.)
KUIK (1360 AM; 5 kW; HILLSBORO, OR; Owner: DOLPHIN COMMUNICATIONS, INC.)
Strongest FM radio stations in Wilsonville:
KINK (101.9 FM; PORTLAND, OR; Owner: INFINITY RADIO OPERATIONS INC.)
KKCW (103.3 FM; BEAVERTON, OR; Owner: CITICASTERS LICENSES, L.P.)
K225AI (92.9 FM; PORTLAND, OR; Owner: EDUCATIONAL MEDIA FOUNDATION)
KNRK (94.7 FM; CAMAS, WA; Owner: ENTERCOM PORTLAND LICENSE, LLC (DE))
KPDQ-FM (93.7 FM; PORTLAND, OR; Owner: SALEM MEDIA OF OREGON, INC.)
KOPB-FM (91.5 FM; PORTLAND, OR; Owner: OREGON PUBLIC BROADCASTING)
KKRZ (100.3 FM; PORTLAND, OR; Owner: CITICASTERS LICENSES, L.P.)
KGON (92.3 FM; PORTLAND, OR; Owner: ENTERCOM PORTLAND LICENSE, LLC (DE))
KKSN-FM (97.1 FM; PORTLAND, OR; Owner: ENTERCOM PORTLAND LICENSE, LLC (DE))
KXJM (95.5 FM; PORTLAND, OR; Owner: ROSE CITY RADIO CORPORATION)
KBOO (90.7 FM; PORTLAND, OR; Owner: THE KBOO FOUNDATION)
KWJJ-FM (99.5 FM; PORTLAND, OR; Owner: FISHER BROADCASTING - PORTLAND RADIO, L.L.C.)
KMHD (89.1 FM; GRESHAM, OR; Owner: MT. HOOD COMMUNITY COLLEGE DISTRICT)
KVMX (107.5 FM; BANKS, OR; Owner: INFINITY RADIO OPERATIONS INC.)
KUFO-FM (101.1 FM; PORTLAND, OR; Owner: INFINITY RADIO OPERATIONS INC.)
KLTH (106.7 FM; LAKE OSWEGO, OR; Owner: INIFINITY RADIO OF PORTLAND INC.)
KUPL-FM (98.7 FM; PORTLAND, OR; Owner: INFINITY RADIO OF PORTLAND INC.)
KFIS (104.1 FM; SCAPPOOSE, OR; Owner: CARON BROADCASTING, INC.)
KBVM (88.3 FM; PORTLAND, OR; Owner: CATHOLIC BROADCASTING NORTHWEST, INC)
KRRC (104.1 FM; PORTLAND, OR; Owner: THE REED INSTITUTE)
TV broadcast stations around Wilsonville:
KATU (Channel 2; PORTLAND, OR; Owner: FISHER BROADCASTING - PORTLAND TV, L.L.C.)
KPDX (Channel 49; VANCOUVER, WA; Owner: MEREDITH CORPORATION)
KPTV (Channel 12; PORTLAND, OR; Owner: MEREDITH CORPORATION)
K57IF (Channel 57; SALEM, OR; Owner: LaGRANDE BROADCASTING, INC.)
KOIN (Channel 6; PORTLAND, OR; Owner: EMMIS TELEVISION LICENSE CORPORATION)
KNMT (Channel 24; PORTLAND, OR; Owner: NATIONAL MINORITY T.V., INC.)
KGW (Channel 8; PORTLAND, OR; Owner: KING BROADCASTING COMPANY)
KWBP-LP (Channel 4; PORTLAND, OR; Owner: TRIBUNE BROADCASTING HOLDINGS, INC.)
KOPB-TV (Channel 10; PORTLAND, OR; Owner: OREGON PUBLIC BROADCASTING)
KPXG-LP (Channel 54; PORTLAND, OR; Owner: PAXSON COMMUNICATIONS LICENSE COMPANY, LLC)
K18EL (Channel 18; NEWBERG/TIGARD, OR; Owner: MEREDITH CORPORATION)
KPXG (Channel 22; SALEM, OR; Owner: PAXSON SALEM LICENSE, INC.)
K14HN (Channel 14; VANCOUVER/CAMAS, WA; Owner: MEREDITH CORPORATION)
KWBP (Channel 32; SALEM, OR; Owner: TRIBUNE BROADCAST HOLDINGS, INC.)
KOXO-CA (Channel 51; NEWBERG, OR; Owner: WATCHTV, INC.)
KORK-CA (Channel 35; PORTLAND, OR; Owner: WATCHTV, INC.)
K58CO (Channel 58; PORTLAND, OR; Owner: NORTHWEST CHRISTIAN BROADCASTING)
K16CB (Channel 16; HAPPY VALLEY, OR; Owner: MEREDITH CORPORATION)
National Bridge Inventory (NBI) Statistics 35 Number of bridges492ft / 150m Total length $343,000 Total costs1,316,538 Total average daily traffic207,944 Total average daily truck traffic
New bridges - historical statistics
6 1950-1959 5 1960-1969 9 1970-1979 1 1980-1989 4 1990-1999 8 2000-2009 2 2010-2019
See full National Bridge Inventory statistics for Wilsonville, OR
Home Mortgage Disclosure Act Aggregated Statistics For Year 2009(Based on 3 partial tracts) A) FHA, FSA/RHS & VA B) Conventional C) Refinancings D) Home Improvement Loans F) Non-occupant Loans on Number Average Value Number Average Value Number Average Value Number Average Value Number Average Value
LOANS ORIGINATED 27 $255,163 40 $272,000 229 $262,781 3 $161,277 10 $247,790 APPLICATIONS APPROVED, NOT ACCEPTED 3 $168,753 7 $327,729 22 $269,560 0 $0 2 $157,540 APPLICATIONS DENIED 3 $275,670 7 $332,094 51 $297,459 4 $170,705 3 $238,030 APPLICATIONS WITHDRAWN 4 $218,025 9 $247,601 53 $271,876 1 $260,480 5 $169,048 FILES CLOSED FOR INCOMPLETENESS 2 $229,265 2 $282,030 10 $299,847 0 $0 0 $0
Aggregated Statistics For Year 2008(Based on 3 partial tracts) A) FHA, FSA/RHS & VA B) Conventional C) Refinancings D) Home Improvement Loans E) Loans on Dwellings For 5+ Families F) Non-occupant Loans on G) Loans On Manufactured Number Average Value Number Average Value Number Average Value Number Average Value Number Average Value Number Average Value Number Average Value
LOANS ORIGINATED 13 $267,357 54 $318,835 99 $277,438 3 $206,957 3 $10,916,303 5 $317,098 1 $181,580 APPLICATIONS APPROVED, NOT ACCEPTED 1 $258,530 6 $258,142 18 $312,798 1 $111,840 0 $0 1 $243,870 2 $38,100 APPLICATIONS DENIED 5 $291,504 16 $318,377 38 $287,233 13 $167,740 0 $0 3 $233,047 2 $91,475 APPLICATIONS WITHDRAWN 1 $239,410 8 $343,838 31 $277,176 2 $281,015 0 $0 1 $338,450 0 $0 FILES CLOSED FOR INCOMPLETENESS 0 $0 1 $281,810 7 $296,741 0 $0 0 $0 1 $92,610 0 $0
Aggregated Statistics For Year 2007(Based on 3 partial tracts) A) FHA, FSA/RHS & VA B) Conventional C) Refinancings D) Home Improvement Loans E) Loans on Dwellings For 5+ Families F) Non-occupant Loans on G) Loans On Manufactured Number Average Value Number Average Value Number Average Value Number Average Value Number Average Value Number Average Value Number Average Value
LOANS ORIGINATED 2 $155,000 133 $286,587 128 $261,117 7 $110,394 1 $25,119,860 17 $232,811 1 $92,930 APPLICATIONS APPROVED, NOT ACCEPTED 1 $156,140 25 $238,446 27 $266,917 3 $195,307 0 $0 5 $137,560 1 $88,970 APPLICATIONS DENIED 0 $0 32 $215,930 47 $318,038 12 $258,611 0 $0 8 $338,022 4 $65,120 APPLICATIONS WITHDRAWN 1 $223,260 20 $280,372 22 $309,350 5 $152,732 0 $0 0 $0 0 $0 FILES CLOSED FOR INCOMPLETENESS 0 $0 3 $198,187 11 $260,515 0 $0 0 $0 0 $0 0 $0
Aggregated Statistics For Year 2006(Based on 3 partial tracts) A) FHA, FSA/RHS & VA B) Conventional C) Refinancings D) Home Improvement Loans F) Non-occupant Loans on G) Loans On Manufactured Number Average Value Number Average Value Number Average Value Number Average Value Number Average Value Number Average Value
LOANS ORIGINATED 3 $173,067 243 $250,742 151 $278,944 15 $131,920 38 $248,852 2 $40,900 APPLICATIONS APPROVED, NOT ACCEPTED 0 $0 29 $196,339 29 $353,304 4 $75,685 3 $674,437 2 $45,060 APPLICATIONS DENIED 2 $90,315 45 $241,033 58 $271,122 13 $107,756 9 $245,988 2 $47,650 APPLICATIONS WITHDRAWN 0 $0 41 $242,947 39 $310,589 2 $102,890 7 $180,299 0 $0 FILES CLOSED FOR INCOMPLETENESS 0 $0 7 $241,649 13 $226,992 2 $74,820 2 $135,475 0 $0
Aggregated Statistics For Year 2005(Based on 3 partial tracts) A) FHA, FSA/RHS & VA B) Conventional C) Refinancings D) Home Improvement Loans E) Loans on Dwellings For 5+ Families F) Non-occupant Loans on G) Loans On Manufactured Number Average Value Number Average Value Number Average Value Number Average Value Number Average Value Number Average Value Number Average Value
LOANS ORIGINATED 4 $124,240 191 $260,772 196 $230,165 15 $136,234 1 $18,004,210 28 $211,609 3 $133,300 APPLICATIONS APPROVED, NOT ACCEPTED 0 $0 22 $274,263 30 $159,167 1 $260,940 0 $0 2 $262,905 2 $50,960 APPLICATIONS DENIED 1 $43,630 40 $274,042 61 $244,997 9 $108,444 0 $0 5 $283,364 8 $60,785 APPLICATIONS WITHDRAWN 0 $0 24 $340,252 45 $242,288 5 $124,430 0 $0 6 $189,227 0 $0 FILES CLOSED FOR INCOMPLETENESS 0 $0 4 $537,808 14 $250,168 3 $95,687 0 $0 0 $0 0 $0
Aggregated Statistics For Year 2004(Based on 3 partial tracts) A) FHA, FSA/RHS & VA B) Conventional C) Refinancings D) Home Improvement Loans F) Non-occupant Loans on G) Loans On Manufactured Number Average Value Number Average Value Number Average Value Number Average Value Number Average Value Number Average Value
LOANS ORIGINATED 6 $117,480 204 $191,898 129 $210,024 9 $89,246 23 $168,740 1 $174,090 APPLICATIONS APPROVED, NOT ACCEPTED 2 $137,465 24 $153,570 26 $194,044 3 $100,873 7 $200,244 4 $36,265 APPLICATIONS DENIED 3 $180,690 37 $141,454 38 $209,455 8 $78,542 6 $226,117 8 $49,478 APPLICATIONS WITHDRAWN 1 $107,920 14 $185,660 43 $190,503 3 $99,313 2 $119,035 0 $0 FILES CLOSED FOR INCOMPLETENESS 0 $0 4 $114,828 7 $213,504 2 $38,530 0 $0 0 $0
Aggregated Statistics For Year 2003(Based on 3 partial tracts) A) FHA, FSA/RHS & VA B) Conventional C) Refinancings D) Home Improvement Loans F) Non-occupant Loans on Number Average Value Number Average Value Number Average Value Number Average Value Number Average Value
LOANS ORIGINATED 13 $148,999 153 $185,242 401 $177,253 4 $56,712 20 $138,976 APPLICATIONS APPROVED, NOT ACCEPTED 2 $168,005 15 $174,130 48 $169,428 2 $18,175 2 $187,795 APPLICATIONS DENIED 1 $94,140 24 $122,764 52 $209,484 7 $35,431 5 $144,424 APPLICATIONS WITHDRAWN 0 $0 11 $221,522 57 $182,264 1 $46,700 3 $111,053 FILES CLOSED FOR INCOMPLETENESS 0 $0 2 $199,995 12 $169,054 0 $0 2 $183,665
Aggregated Statistics For Year 1999(Based on 1 partial tract) A) FHA, FSA/RHS & VA B) Conventional C) Refinancings D) Home Improvement Loans F) Non-occupant Loans on Number Average Value Number Average Value Number Average Value Number Average Value Number Average Value
LOANS ORIGINATED 10 $120,135 67 $155,264 49 $173,516 8 $41,582 7 $126,080 APPLICATIONS APPROVED, NOT ACCEPTED 1 $114,190 9 $135,794 6 $172,605 2 $23,285 1 $73,570 APPLICATIONS DENIED 1 $191,220 18 $121,978 16 $182,308 3 $40,623 2 $94,620 APPLICATIONS WITHDRAWN 1 $117,910 9 $156,794 7 $169,463 1 $86,450 0 $0 FILES CLOSED FOR INCOMPLETENESS 1 $110,720 1 $361,150 4 $127,752 0 $0 0 $0
Detailed HMDA statistics for the following Tracts:
0227.03
, 0227.04 , 0321.06
Private Mortgage Insurance Companies Aggregated Statistics For Year 2009(Based on 3 partial tracts) A) Conventional B) Refinancings Number Average Value Number Average Value
LOANS ORIGINATED 4 $324,280 2 $437,245 APPLICATIONS APPROVED, NOT ACCEPTED 2 $250,605 3 $213,240 APPLICATIONS DENIED 1 $286,240 1 $370,440 APPLICATIONS WITHDRAWN 0 $0 0 $0 FILES CLOSED FOR INCOMPLETENESS 0 $0 0 $0
Aggregated Statistics For Year 2008(Based on 3 partial tracts) A) Conventional B) Refinancings Number Average Value Number Average Value
LOANS ORIGINATED 17 $318,169 5 $192,850 APPLICATIONS APPROVED, NOT ACCEPTED 4 $260,130 2 $348,695 APPLICATIONS DENIED 1 $506,630 0 $0 APPLICATIONS WITHDRAWN 1 $180,630 0 $0 FILES CLOSED FOR INCOMPLETENESS 0 $0 0 $0
Aggregated Statistics For Year 2007(Based on 3 partial tracts) A) Conventional B) Refinancings C) Non-occupant Loans on Number Average Value Number Average Value Number Average Value
LOANS ORIGINATED 15 $273,569 4 $287,242 1 $264,790 APPLICATIONS APPROVED, NOT ACCEPTED 2 $188,225 2 $293,655 0 $0 APPLICATIONS DENIED 0 $0 0 $0 0 $0 APPLICATIONS WITHDRAWN 0 $0 0 $0 0 $0 FILES CLOSED FOR INCOMPLETENESS 0 $0 0 $0 0 $0
Aggregated Statistics For Year 2006(Based on 3 partial tracts) A) Conventional B) Refinancings Number Average Value Number Average Value
LOANS ORIGINATED 9 $241,130 1 $188,950 APPLICATIONS APPROVED, NOT ACCEPTED 1 $50,520 0 $0 APPLICATIONS DENIED 0 $0 0 $0 APPLICATIONS WITHDRAWN 0 $0 0 $0 FILES CLOSED FOR INCOMPLETENESS 0 $0 0 $0
Aggregated Statistics For Year 2005(Based on 3 partial tracts) A) Conventional B) Refinancings C) Non-occupant Loans on Number Average Value Number Average Value Number Average Value
LOANS ORIGINATED 5 $242,078 9 $219,956 1 $238,800 APPLICATIONS APPROVED, NOT ACCEPTED 2 $264,340 2 $172,625 0 $0 APPLICATIONS DENIED 0 $0 0 $0 0 $0 APPLICATIONS WITHDRAWN 0 $0 1 $147,720 0 $0 FILES CLOSED FOR INCOMPLETENESS 0 $0 0 $0 0 $0
Aggregated Statistics For Year 2004(Based on 3 partial tracts) A) Conventional B) Refinancings C) Non-occupant Loans on Number Average Value Number Average Value Number Average Value
LOANS ORIGINATED 12 $258,494 6 $240,930 0 $0 APPLICATIONS APPROVED, NOT ACCEPTED 5 $204,490 1 $143,640 1 $213,550 APPLICATIONS DENIED 0 $0 0 $0 0 $0 APPLICATIONS WITHDRAWN 2 $198,380 0 $0 1 $171,450 FILES CLOSED FOR INCOMPLETENESS 1 $141,600 0 $0 0 $0
Aggregated Statistics For Year 2003(Based on 3 partial tracts) A) Conventional B) Refinancings C) Non-occupant Loans on Number Average Value Number Average Value Number Average Value
LOANS ORIGINATED 13 $209,632 28 $186,517 1 $111,750 APPLICATIONS APPROVED, NOT ACCEPTED 2 $152,055 10 $172,739 0 $0 APPLICATIONS DENIED 2 $127,055 0 $0 0 $0 APPLICATIONS WITHDRAWN 0 $0 3 $175,670 0 $0 FILES CLOSED FOR INCOMPLETENESS 0 $0 0 $0 0 $0
Aggregated Statistics For Year 1999(Based on 1 partial tract) A) Conventional B) Refinancings Number Average Value Number Average Value
LOANS ORIGINATED 21 $176,728 7 $182,307 APPLICATIONS APPROVED, NOT ACCEPTED 1 $233,830 0 $0 APPLICATIONS DENIED 0 $0 1 $174,130 APPLICATIONS WITHDRAWN 1 $131,780 0 $0 FILES CLOSED FOR INCOMPLETENESS 0 $0 0 $0
Detailed PMIC statistics for the following Tracts:
0227.03
, 0227.04 , 0321.06 Fire-safe hotels and motels in Wilsonville, Oregon:
Comfort Inn Wilsonville, 8855 SW Citizens Dr, Wilsonville, Oregon 97070 Phone: (503) 682-9000, Fax: (503) 682-6874
Quality Inn & Conference Center Wilsonville, 30800 SW Pkwy Ave, Wilsonville, Oregon 97070 Phone: (503) 682-2288, Fax: (503) 682-1088
Best Western Wilsonville Inn & Suites, 26769 S W Boones Ferry Rd, Wilsonville, Oregon 97070 Phone: (503) 570-9700, Fax: (503) 570-0467
La Quinta Inn & Suites, 8815 SW Sun Pl, Wilsonville, Oregon 97070 Phone: (503) 682-3184, Fax: (503) 682-2351
Quality Inn Wilsonville, 30800 SW Parkway Ave, Wilsonville, Oregon 97070 Phone: (503) 682-2288, Fax: (503) 682-1088
Holiday Inn Portland South Wilsonville, 25425 SW 95th Ave, Wilsonville, Oregon 97070 Phone: (503) 682-2211, Fax: (503) 218-2024
All 6 fire-safe hotels and motels in Wilsonville, Oregon
Most common first names in Wilsonville, OR among deceased individuals Name Count Lived (average)
John 73 78.0 years Robert 65 76.3 years William 57 78.9 years Mary 52 80.8 years James 43 74.5 years Charles 36 82.5 years Margaret 36 84.7 years Richard 35 77.3 years Dorothy 33 80.1 years Donald 33 71.1 years
Most common last names in Wilsonville, OR among deceased individuals Last name Count Lived (average)
Smith 30 74.8 years Miller 21 75.3 years Johnson 16 75.9 years White 14 77.8 years Davis 13 72.2 years Jones 12 75.1 years Wilson 12 82.6 years Taylor 12 72.7 years Brown 11 75.6 years Anderson 11 76.1 years
Wilsonville compared to Oregon state average:
Unemployed percentage significantly below state average. Black race population percentage above state average. Hispanic race population percentage above state average. Foreign-born population percentage above state average. House age significantly below state average. Institutionalized population percentage significantly above state average. Percentage of population with a bachelor's degree or higher above state average. Wilsonville on our top lists :
#43 on the list of "Top 101 cities with the largest city-data.com crime index decrease from 2002 to 2012 (population 5,000+)"
#81 on the list of "Top 101 cities with largest percentage of males in occupations: architecture and engineering occupations (population 5,000+)"
#27 on the list of "Top 101 counties with the highest percentage of residents that exercised in the past month"
#31 on the list of "Top 101 counties with the highest surface withdrawal of fresh water for public supply"
#44 on the list of "Top 101 counties with the highest total withdrawal of fresh water for public supply"
#48 on the list of "Top 101 counties with the highest percentage of residents that keep firearms around their homes"
#78 on the list of "Top 101 counties with the lowest number of births per 1000 residents 2007-2013"
Top Patent Applicants
Janet N. Egger (83)
Stephen F. Gass (31)
David L. Knierim (27)
Richard A. Leinen (25)
Nilanjan Mukherjee (24)
Mark Kassab (17)
Bo Wu (14)
Juan Andres Torres Robles (14)
Dhiraj Goswami (13)
Manish Sharma (13)
Total of 644 patent applications in 2008-2024.
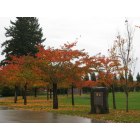
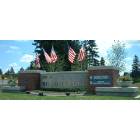
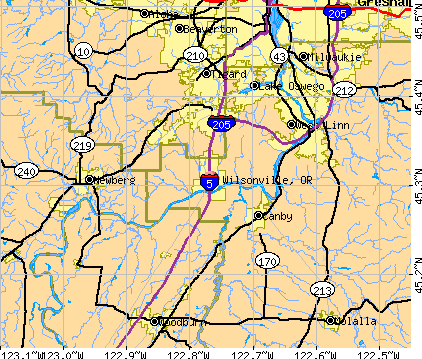


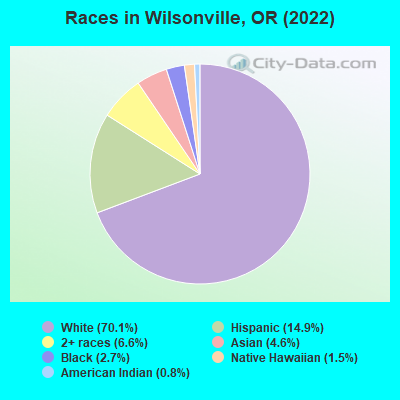
 Recent articles from our blog. Our writers, many of them Ph.D. graduates or candidates, create easy-to-read articles on a wide variety of topics.

 , pop. 224,220).
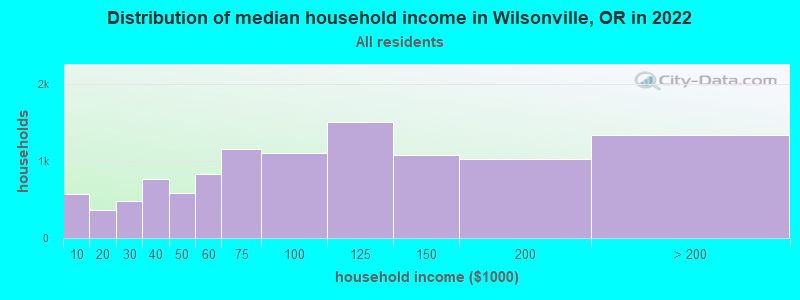
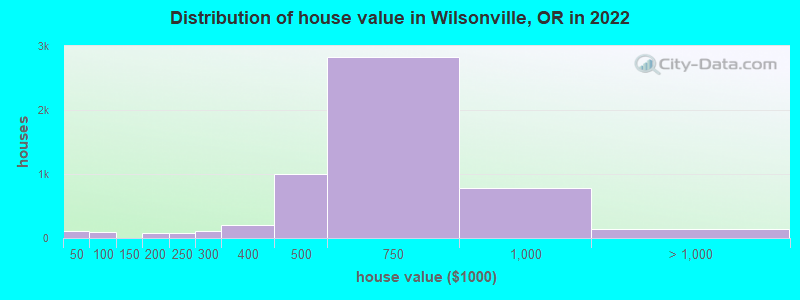

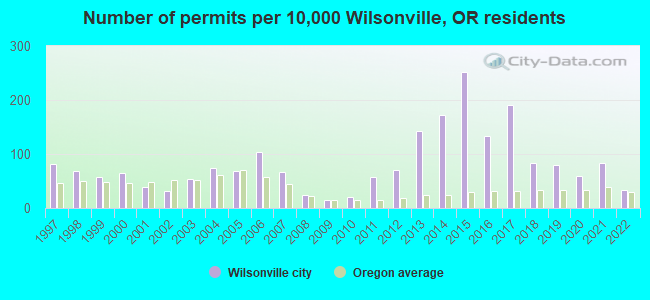
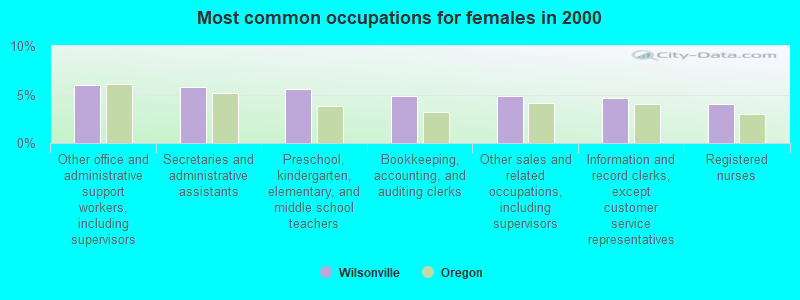


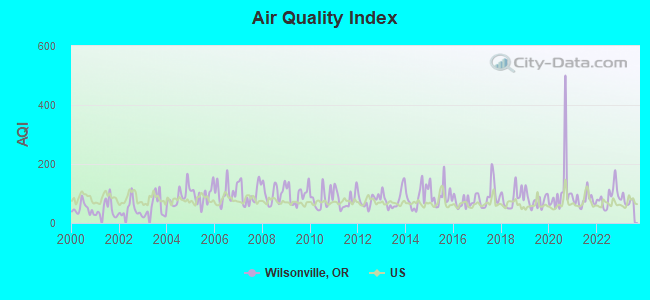
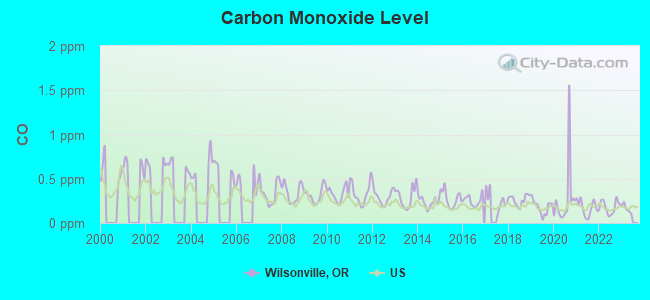
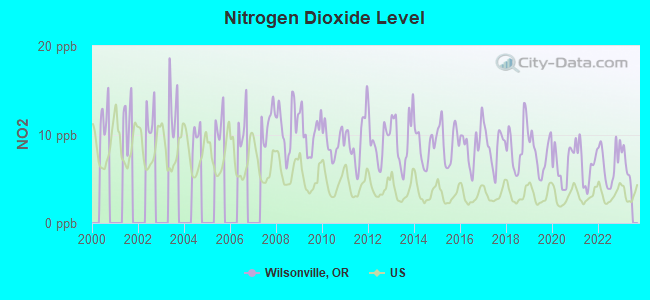
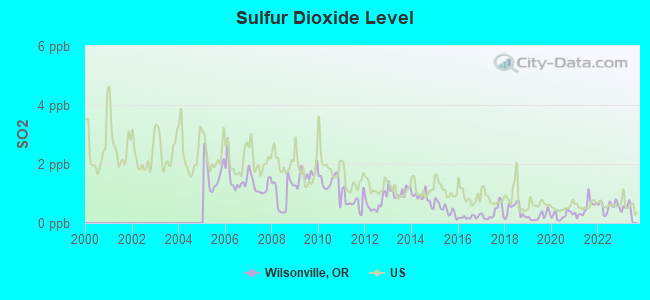
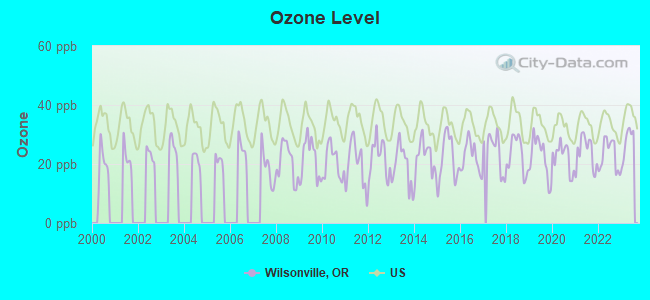

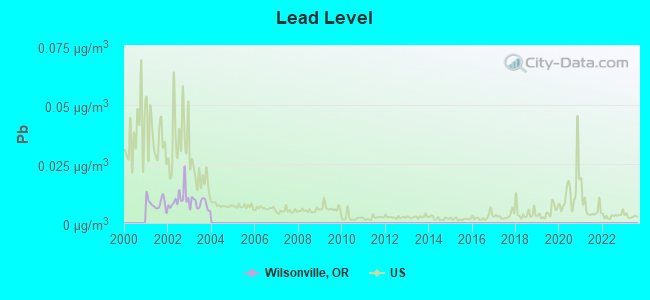
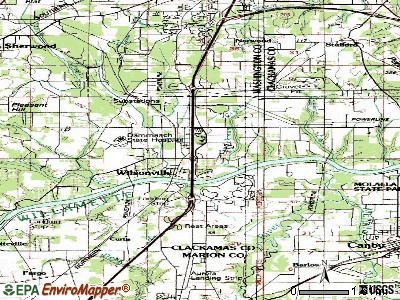

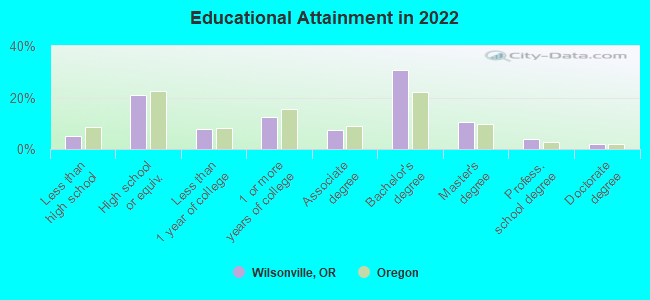
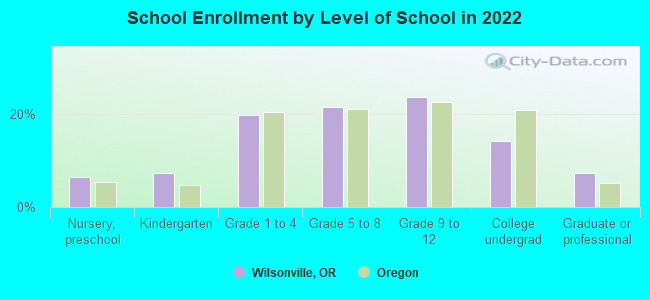
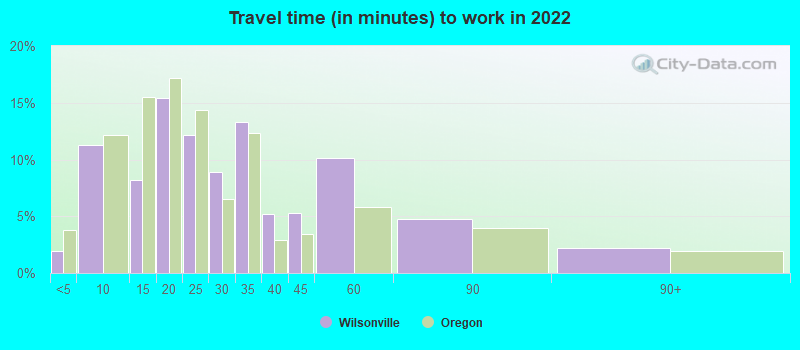
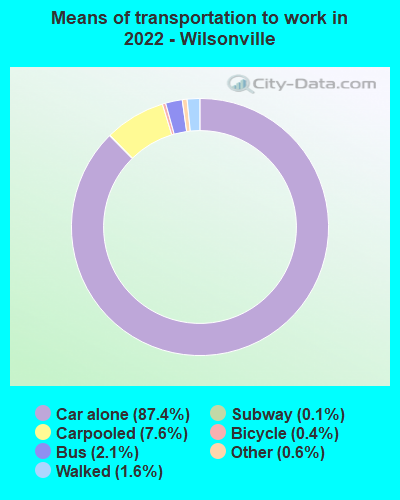
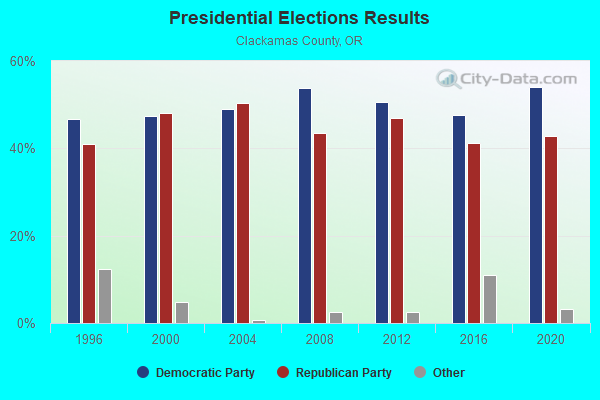
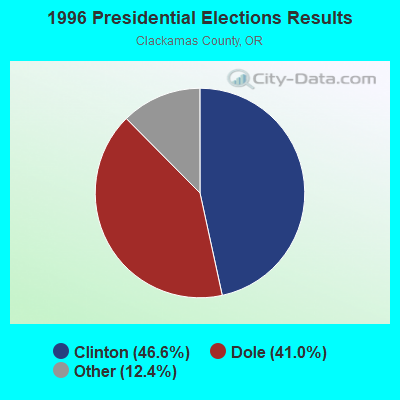
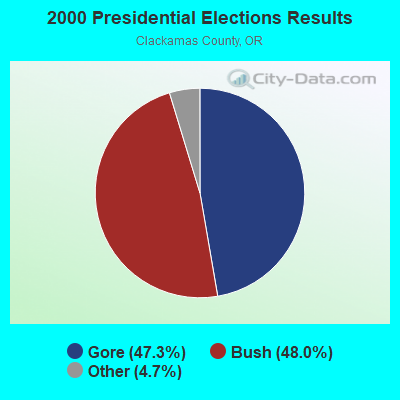
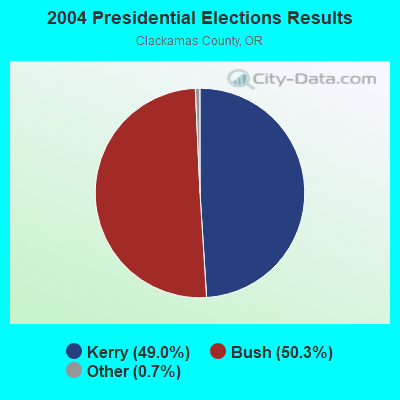

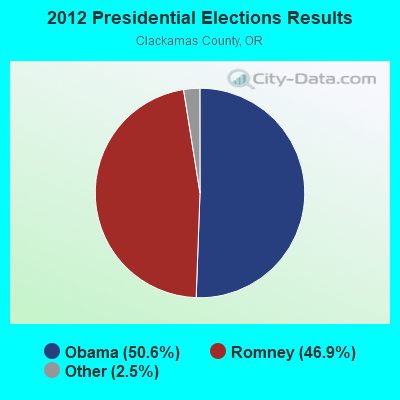
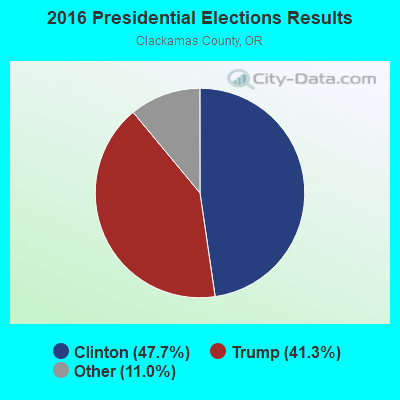
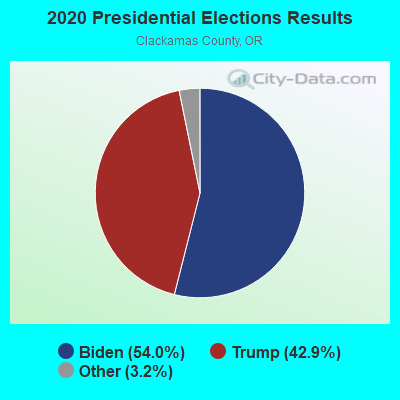
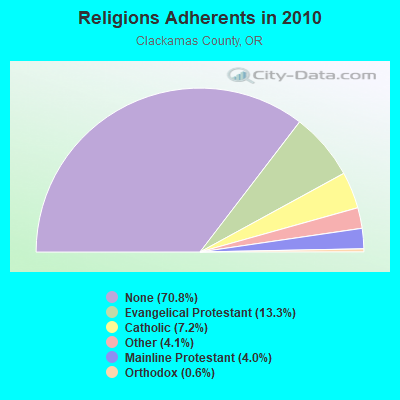
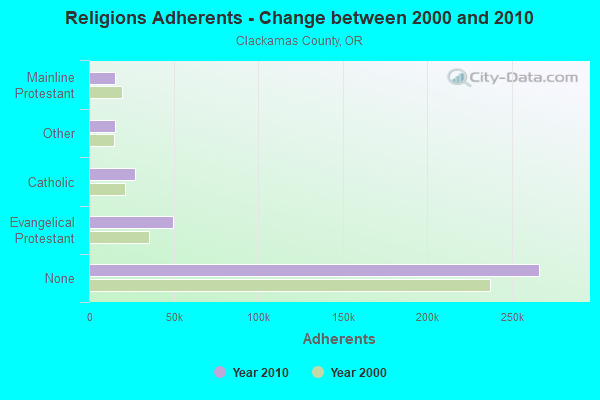

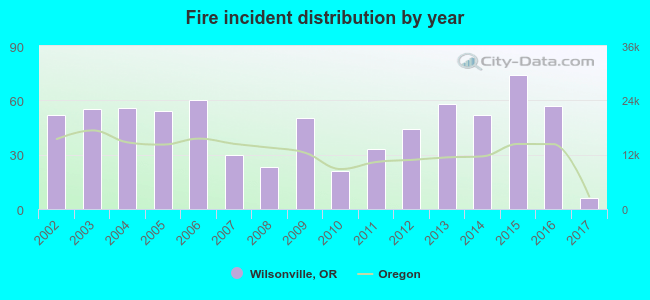 According to the data from the years 2002 - 2017 the average number of fire incidents per year is 45. The highest number of reported fires - 74 took place in 2015, and the least - 6 in 2017. The data has a dropping trend.
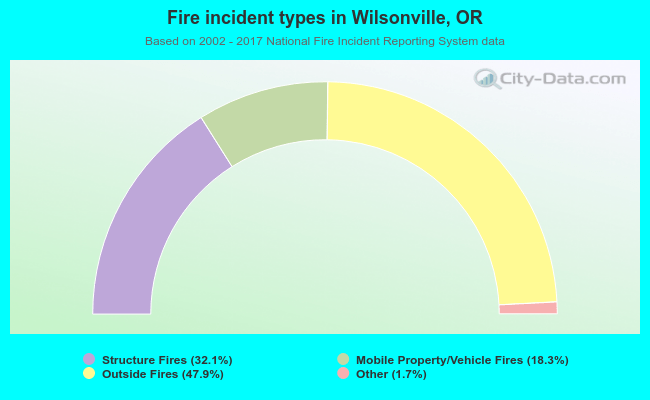 When looking into fire subcategories, the most reports belonged to: Outside Fires (47.9%), and Structure Fires (32.1%).