Baltimore, MD, and Elizabeth, NJ, are two unique cities each offering distinct living conditions. Baltimore, a seaport city in Maryland, is known for its maritime history, arts scene, higher education institutions, and healthcare sectors. On the other hand, Elizabeth, NJ is recognized for its strategic location close to Manhattan, diverse cultural scene, and the presence of varied industries. This detailed guide compares these two cities on various aspects, including crime and safety, weather, and cost of living among others, to help you make an informed decision whether you're considering relocating or just visiting.
Distance between
Baltimore, MD and
Elizabeth, NJ : 158.1 miles
Baltimore's population is larger by 326%. Its population has decreased by 74,656 people (11.5%) since 2000. The population of Elizabeth has grown by 14,839 people (12.3%) during that time.
Baltimore has higher crime rates compared to Elizabeth. Although Baltimore has been working to decrease crime rates, residents and visitors are advised to take precautions, especially after dark or in less crowded areas. Elizabeth, on the other hand, has a lower crime rate, making it safer. Despite this, it's always advisable to take standard safety measures when living in or visiting a new city.
City-data.com crime index counts serious crimes and violent crime more heavily. It adjusts for the number of visitors and daily workers commuting into cities. (higher means more crime, U.S. average = 301.1)
City-data.com crime index counts serious crimes and violent crime more heavily. It adjusts for the number of visitors and daily workers commuting into cities. (higher means more crime, U.S. average = 301.1)
Sex Offenders
According to our data, there are 1,557 registered sex offenders living in Baltimore and 112 registered sex offenders living in . The ratio of residents to sex offenders in Baltimore is 395 to 1; the ratio in Elizabeth is 1,149 to 1. The number of registered sex offenders compared to the number of residents is much larger in Baltimore than that in Elizabeth.
Cost of Living
Living costs in Baltimore are generally lower than those in Elizabeth. Housing is more affordable in Baltimore than in Elizabeth. Groceries, utilities, and transportation also cost less in Baltimore. However, healthcare services in Baltimore are comparatively more expensive.
Income Tax
Income tax in Maryland is progressive, with rates ranging from 2-5.75%, with an additional local income tax in Baltimore of 3.2%. In contrast, New Jersey has a progressive state income tax that ranges from 1.4-10.75%, with no additional city income tax.
Property Tax
Baltimore has a relatively high property tax rate of 2.248%, while Elizabeth has an even larger rate of 3.132%.
Sales Tax
Maryland’s state sales tax, applicable in Baltimore, is 6% with no additional city sales tax. Elizabeth, being in New Jersey, has a slightly lower state sales tax rate at 6.625%, but a 3.5% reduced rate is applied in Urban Enterprise Zones.
Income
Type
Baltimore
Elizabeth
Estimated median household income
$54,652
$51,549
Estimated per capita income
$35,091
$24,973
Cost of living index (U.S. average is 100)
105.7
119.1
If you make $50,000 in Baltimore, you will have to make $56,339 in Elizabeth to maintain the same standard of living.
Geographical Conditions
Baltimore lies in the arm of the Chesapeake Bay, a coastal city with numerous waterways and parks. Elizabeth is located on Newark Bay and is endowed with coastal areas, while also being in proximity to Manhattan’s urban landscape.
Baltimore boasts of reputable higher education institutions like Johns Hopkins University and University of Maryland. On the other side, Elizabeth also has good public and private schools, along with access to numerous colleges and universities within commuting distance, including Kean University and Union County College.
Baltimore has a diverse economy with major sectors including healthcare, science, technology, and the arts. Whereas, Elizabeth's economy is vibrant with industries like manufacturing, shipping, and retail thriving. Both cities offer numerous job opportunities but the industries vary.
Biggest Employers
Johns Hopkins University and Johns Hopkins Hospital System are the largest employers in Baltimore. Meanwhile, in Elizabeth, Trinitas Regional Medical Center and Wakefern Food Corporation, are among the major employers.
There were 191 building permits issued in Baltimore in 2012 (116 more than in 2011) compared to 4 building permits issued in Elizabeth in 2012 (2 more than in 2011).
In Baltimore (Baltimore city), 87.4% voted for Democrats and 11.1% for Republicans in 2012 Presidential Election. In Elizabeth (Union County), 66.9% voted for Democrats and 32.7% for Republicans.
Elections
Type
Democrats
Republicans
Other
Year
Baltimore
Elizabeth
Baltimore
Elizabeth
Baltimore
Elizabeth
2020
87.5%
67.2%
10.7%
31.6%
1.8%
1.3%
2016
84.8%
66.2%
10.5%
30.6%
4.6%
3.1%
2012
87.4%
66.9%
11.1%
32.7%
1.4%
0.5%
2008
87.6%
63.9%
11.7%
35.6%
0.6%
0.5%
2004
82.5%
58.8%
17.1%
40.7%
0.5%
0.5%
2000
82.9%
60.4%
14.2%
37.0%
2.9%
2.7%
1996
79.3%
56.8%
15.5%
34.6%
5.1%
8.5%
Breakdown of population affiliated with a religious congregation
Type
Adherents
Congregations
Religion
Baltimore
Elizabeth
Baltimore
Elizabeth
CATHOLIC CHURCH
11.0%
46.1%
8.2%
11.0%
EPISCOPAL CHURCH
1.6%
1.3%
4.0%
3.7%
AMERICAN BAPTIST CHURCHES IN THE USA
1.4%
2.1%
2.2%
7.1%
SOUTHERN BAPTIST CONVENTION
1.4%
0.2%
7.3%
2.1%
EVANGELICAL LUTHERAN CHURCH IN AMERICA
1.0%
0.6%
4.3%
2.6%
MUSLIM ESTIMATE
0.6%
2.0%
1.5%
2.1%
SEVENTH DAY ADVENTIST CHURCH
0.5%
0.4%
1.5%
3.1%
LUTHERAN CHURCH
0.4%
0.2%
1.8%
1.3%
Weather
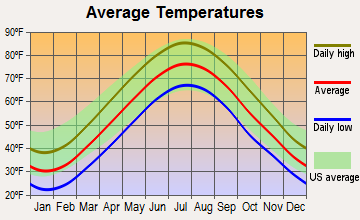
Baltimore experiences a humid subtropical climate with hot humid summers and moderate to heavy snowfall in winters. Elizabeth, NJ also experiences similar weather. The major difference is that Baltimore is slightly hotter in summer and a tad colder in winter, but overall, the climate differences between the two cities are not very drastic.
Weather and climate
Type
Baltimore
Elizabeth
Temperature - Average
54.5°F
53.6°F
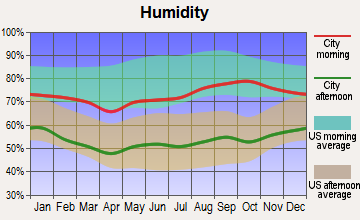
Humidity - Average morning or afternoon humidity
70.4%
67.3%
Humidity - Differences between morning and afternoon humidity
36%
30%
Humidity - Maximum monthly morning or afternoon humidity
84%
77%
Humidity - Minimum monthly morning or afternoon humidity
48%
47%
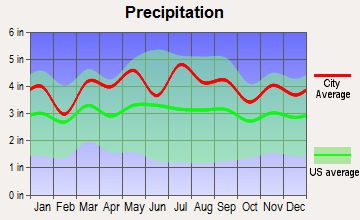
Precipitation - Yearly average
42.9 in
47.9 in
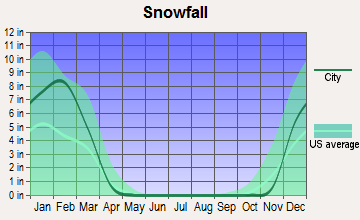
Snowfall - Yearly average
39.6 in
60.4 in
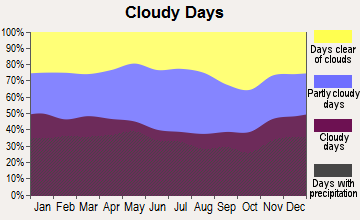
Clouds - Number of days clear of clouds
17.5%
15.7%
Sunshine amount - Average
60.3%
60.2%
Sunshine amount - Differences during a year
16%
20%
Sunshine amount - Maximum monthly
63%
64%
Sunshine amount - Minimum monthly
47%
44%
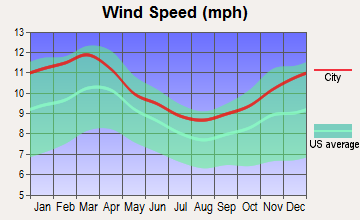
Wind speed - Average
7.9 mph
10.6 mph
Average climate in Baltimore, Maryland
Average climate in Elizabeth, New Jersey
Air pollution
Type
AQI
CO
NO2
OZONE
PB
PM10
PM25
SO2
Year
Baltimore
Elizabeth
Baltimore
Elizabeth
Baltimore
Elizabeth
Baltimore
Elizabeth
Elizabeth
Baltimore
Elizabeth
Baltimore
Elizabeth
Baltimore
Elizabeth
2018
89
94
0.23
0.38
11.8
19.5
28.3
23.9
N/A
N/A
N/A
N/A
7.9
10.5
0.1
0.4
2017
89
98
0.25
0.35
12.1
19.4
27.7
23.6
N/A
N/A
N/A
N/A
8.2
10.4
0.2
0.2
2016
102
94
0.26
0.42
13.0
20.3
28.3
24.3
N/A
N/A
N/A
N/A
7.7
10.1
0.3
0.2
2015
89
100
0.28
0.40
12.4
22.2
28.3
24.4
N/A
N/A
N/A
N/A
9.5
8.9
0.4
0.5
2014
82
95
0.25
0.37
11.8
22.0
25.7
23.8
N/A
N/A
N/A
N/A
10.9
8.6
0.6
0.6
2013
86
96
0.22
0.38
10.7
22.2
25.6
24.4
N/A
N/A
N/A
N/A
9.6
8.9
0.5
0.8
2012
98
98
0.24
0.42
11.3
22.1
25.0
23.9
N/A
N/A
N/A
N/A
11.2
9.3
0.5
1.0
2011
101
108
0.24
0.45
12.5
24.6
25.1
23.2
N/A
N/A
N/A
N/A
12.1
10.0
0.8
1.6
2010
110
114
0.24
0.43
13.1
22.2
26.9
25.7
N/A
N/A
N/A
N/A
12.2
9.3
1.0
1.2
2009
84
104
0.23
0.41
12.2
26.4
23.5
21.2
N/A
N/A
N/A
N/A
10.4
9.6
1.4
1.9
2008
96
111
0.25
0.38
13.6
26.1
21.6
22.3
0.013
N/A
N/A
N/A
12.8
11.6
1.8
2.9
2007
107
123
0.21
0.41
13.8
27.5
23.2
22.8
0.016
N/A
N/A
N/A
14.0
12.1
2.5
4.1
2006
112
116
N/A
0.57
12.0
29.8
24.6
22.0
0.018
N/A
N/A
N/A
14.7
13.3
N/A
4.7
2005
111
112
N/A
0.71
14.3
31.9
26.3
20.8
N/A
N/A
23.0
N/A
17.1
N/A
N/A
6.5
2004
108
107
N/A
0.71
15.3
30.4
28.0
19.9
0.030
N/A
23.1
N/A
16.3
N/A
N/A
6.5
2003
110
108
N/A
0.80
17.8
32.0
22.4
19.0
0.009
N/A
N/A
26.9
13.9
N/A
N/A
7.0
2002
119
124
N/A
0.79
17.4
39.6
19.4
20.8
0.008
N/A
N/A
26.1
16.3
N/A
5.8
6.9
2001
104
124
N/A
0.87
18.2
40.2
23.9
22.1
0.020
N/A
N/A
26.8
N/A
N/A
6.0
7.0
2000
101
116
N/A
0.99
17.0
40.6
22.4
20.4
0.022
N/A
N/A
22.2
N/A
N/A
6.3
7.0
Natural disasters
Type
Baltimore
Elizabeth
Tornado activity compared to U.S. average
117.8%
64.4%
Earthquake activity compared to U.S. average
40.6%
31.5%
Natural disasters compared to U.S. average
0%
27%
Transportation
Baltimore offers well-connected public transit with buses, light rail, and a metro subway; however, many residents also drive. Elizabeth's location near NYC makes it a hub for various modes of transportation, including trains, buses, and ferries.
Transport
Type
Baltimore
Elizabeth
Amtrak stations
2
0
Amtrak stations nearby
2
3
FAA registered aircraft
136
8
FAA registered aircraft manufacturers and dealers
2
0
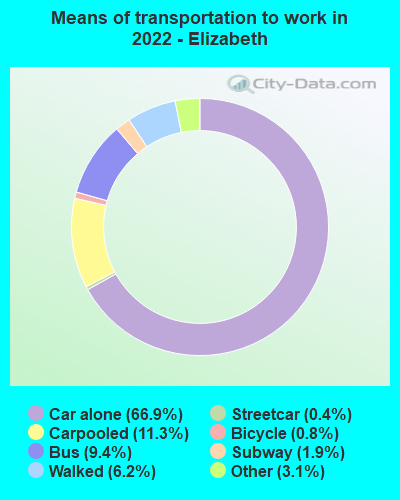
Means of transportation to work
Type
Baltimore
Elizabeth
Bicycle
0.4%
0.2%
Bus
6.2%
5.7%
Carpooled
7.3%
12.5%
Car alone
77.2%
71.5%
Railroad
0.3%
3.2%
Streetcar
1.2%
0.1%
Subway
0.2%
0.8%
Taxicab
0.7%
0.4%
Walked
4.5%
4.3%
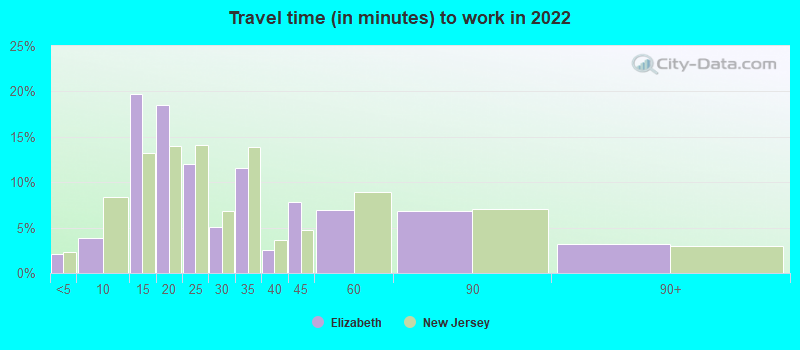
Average travel time to work
Type
Baltimore
Elizabeth
Average
32.3 min
31.3 min
Other means
26.3 min
26.7 min
Public transportation
46.8 min
42.6 min
Private vehicle occupancy
Type
Baltimore
Elizabeth
Average
1.1
1.6
Drove alone
90.7%
77.3%
In 2 person carpool
7.5%
10.4%
In 3 person carpool
1%
2.3%
In 4 person carpool
0.4%
3.4%
In 5-6 person carpool
0.3%
6.4%
In 7+ person carpool
0.2%
0.2%
How many people usually rode to work in the car, truck or van.
Real Estate
More affordable housing is found in Baltimore, with a variety of options from historic townhomes to modern condos. In contrast, Elizabeth’s real-estate market is more expensive, reflecting its proximity to New York City.
Neighborhoods
Both cities offer distinctive neighborhoods. Baltimore is known for its waterfront neighborhoods such as Fells Point, and arts districts like Mount Vernon. Elizabeth’s prominent neighborhoods include the historic midtown area and the urban Elmora.
Houses and residents
Type
Baltimore
Elizabeth
Houses
293,487
49,554
Average household size (people)
2.4
2.9
Median year apartment built
1959
1958
Median year house/condo built
1944
1950
Length of stay in the house since moving in
15.7 years
12.4 years
Houses occupied
254,370 (86.7%)
46,107 (93%)
Houses occupied by owners
123,249 (48.5%)
11,319 (24.5%)
Houses occupied by renters
131,121 (51.5%)
34,788 (75.5%)
Median rent asked for vacant for-rent units
$1,254
$1,835
Median monthly housing costs
$1,196
$1,348
Median price asked for vacant for-sale houses and condos
$207,303
$194,520
Estimated median house or condo value
$193,100
$405,800
Median numbers of rooms
5.6
4.2
Median number of rooms in apartments
4.2
4
Median number of rooms in houses and condos
6.5
5.9
Median house price - detached houses
$321,473
$375,446
Median house price - in 2-unit structures
$218,934
$406,479
Median house price - in 3-to-4-unit structures
$142,945
$555,438
Median house price - in 5 or more unit structures
$257,173
$68,365
Median house price - Townhouses or other attached units
$210,096
$315,255
Median house price - All housing units
$246,241
$385,852
Median house age
72
67
Renting percentage
52.3%
73.3%
Housing density (houses/condos per square mile)
3,632.1
4,054.7
House value disparities
38.5%
23.5%
Household income disparities
49.4%
46.9%
Median household income for houses/condes with a mortgage
$85,990
$95,614
Median household income for apartments without a mortgage
$53,334
$75,520
Housing units without a mortgage
2,415 (2.8%)
366 (5.2%)
Housing units with both a second mortgage and home equity loan
5,740 (6.6%)
176 (2.5%)
Housing units with a mortgage
84,578 (97.2%)
6,656 (94.8%)
Housing units with a home equity loan
579 (0.7%)
43 (0.6%)
Housing units with a second mortgage
8,544 (9.8%)
257 (3.7%)
House/condo owner moved in on average (years ago)
14
10
House/condo renter moved in on average (years ago)
3
4
Housing units lacking complete kitchen facilities
6%
3.6%
Housing units lacking complete plumbing facilities
5.1%
0.6%
Housing units in structures
Housing units in structures
Baltimore
Elizabeth
One, detached
16.4%
11.8%
One, attached
49.5%
6.3%
Two
4.5%
31.4%
3 or 4
4.9%
15.5%
5 to 9
5.5%
7.6%
10 to 19
4.8%
7.9%
20 to 49
2.8%
11.5%
50 or more
11.4%
8.0%
Mobile homes
0.2%
0.0%
Boats, RVs, vans, etc.
0.1%
0.0%
Median real estate property taxes paid for housing units
Self-employed workers in own not incorporated business
12,671
2,299
State government workers
20,410
1,237
Unpaid family workers
356
0
Industries and Occupations
In Baltimore, the biggest industries include healthcare, technology, science, and arts. In contrast, in Elizabeth, manufacturing, shipping, retail, and oil refining dominate the local economy.
Baltimore is known for its world-class healthcare facilities, particularly the Johns Hopkins Hospital. Elizabeth, while not the center of healthcare in New Jersey, is served well through Trinitas Regional Medical Center and close proximity to New York City's prestigious hospitals.
Health (county statistics)
Type
Baltimore
Elizabeth
General health status score of residents in this county from 1 (poor) to 5 (excellent)
Baltimore is known for its historic neighborhoods, monuments and beautiful harbor. The city, however, struggles with aging infrastructure. Elizabeth on the other hand, due to its vibrant economy, has been able to maintain a more up-to-date infrastructure.
Infrastructure
Type
Baltimore
Elizabeth
Hospitals
45
3
TV stations
19
31
Bank branches located here
215
31
Bank institutions located here
44
12
Drinking water stations with no reported violations in the past
13
1
Drinking water stations with reported violations in the past
HMDA - Conventional home purchase loans - Applications denied
Year
Baltimore
Elizabeth
1999
2,486
124
2000
2,058
200
2001
1,371
141
2002
1,111
156
2003
1,526
261
2004
2,929
438
2005
4,981
955
2006
5,533
1,156
2007
3,592
823
2008
1,111
251
2009
381
104
Culture and Food
Baltimore is famous for its seafood, especially its Maryland Blue Crabs, and its rich African American heritage. In contrast, Elizabeth is known for its diversity, offering multicultural dining options and housing one of the largest Latin American communities in NJ.
Sports Teams
Baltimore is home to two major league sports teams, the NFL’s Baltimore Ravens and MLB’s Baltimore Orioles. Elizabeth, while it doesn’t have its own major league sports team, is within a short distance of New York City and its abundance of sports teams.


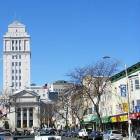

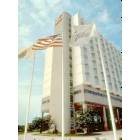

 Baltimore, MD
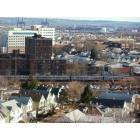
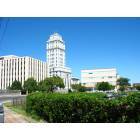
 Elizabeth, NJ