Baltimore, Maryland and Paterson, New Jersey are both historic cities on the East Coast, each with its unique strengths and challenges. Both cities have rich history and vibrant cultures, but they also have unique characteristics regarding crime rates, weather, cost of living, and other critical factors. This comparison takes an in-depth look into the different aspects of living in these two cities for both prospective residents and tourists.
Distance between
Baltimore, MD and
Paterson, NJ : 170.7 miles
Baltimore's population is larger by 265%. Its population has decreased by 74,656 people (11.5%) since 2000. The population of Paterson has grown by 8,572 people (5.7%) during that time.
Baltimore unfortunately has a higher crime rate compared to the national average. Personal safety, particularly in certain neighborhoods, might be a concern for residents and tourists alike. Paterson, NJ, while also experiencing crime, generally reports lower rates in comparison. Nevertheless, as in any city, crime rates can vary significantly from one neighborhood to another. Residents and tourists should stay informed and take necessary precautions.
City-data.com crime index counts serious crimes and violent crime more heavily. It adjusts for the number of visitors and daily workers commuting into cities. (higher means more crime, U.S. average = 301.1)
City-data.com crime index counts serious crimes and violent crime more heavily. It adjusts for the number of visitors and daily workers commuting into cities. (higher means more crime, U.S. average = 301.1)
Sex Offenders
According to our data, there are 1,557 registered sex offenders living in Baltimore and 251 registered sex offenders living in . The ratio of residents to sex offenders in Baltimore is 395 to 1; the ratio in Paterson is 586 to 1. The number of registered sex offenders compared to the number of residents is larger in Baltimore than in Paterson.
Cost of Living
Baltimore generally has a lower cost of living compared to Paterson. Housing, groceries, and transportation costs tend to be more affordable, although taxes can be high in both Maryland and New Jersey. Paterson, due to proximity to New York City, faces higher living costs and can be more expensive for potential residents and visitors.
Income Tax
Both Maryland and New Jersey have progressive income tax systems. However, Maryland's top rate is slightly higher at 5.75%, compared to New Jersey’s top rate of 5.525%.
Property Tax
Baltimore, Maryland has a higher property tax rate compared to Paterson, NJ, which may impact homeownership affordability considerations. Yet, actual tax bills can vary based on local assessments and exemptions.
Sales Tax
Maryland's sales tax is lower than New Jersey's, at 6% vs. New Jersey's 6.625%. However, Baltimore charges additional tax on certain items. Similarly, Paterson, NJ, has additional city taxes on top of the state rate.
Income
Type
Baltimore
Paterson
Estimated median household income
$54,652
$46,451
Estimated per capita income
$35,091
$21,574
Cost of living index (U.S. average is 100)
105.7
120.7
If you make $50,000 in Baltimore, you will have to make $57,096 in Paterson to maintain the same standard of living.
Geographical Conditions
Baltimore is located on the Patapsco River close to where it empties into the Chesapeake Bay, offering beautiful water views and harbor activities. Paterson is located inland but is known for the Great Falls of the Passaic River, a prominent and scenic National Historical Park.
In terms of education, both cities offer a range of opportunities. Baltimore is home to renowned universities such as Johns Hopkins University and the University of Maryland. Paterson, while lacking similar prestigious institutions, sits within close proximity to many great colleges and universities in New York and New Jersey.
Baltimore's economy is robust, with key sectors being healthcare and social assistance, science and technology, and education. Its economy is known for jobs in the healthcare and technological fields – especially in biotech. Paterson, on the other hand, is more concentrated on retail, manufacturing, and education, with a noticeable concentration in textile manufacturing.
Biggest Employers
Johns Hopkins Hospital and Johns Hopkins University are Baltimore's largest employers. Other significant employers include MedStar Health and the University of Maryland. In Paterson, the biggest employers include Paterson Public Schools, St. Joseph's Health and the City of Paterson itself.
There were 191 building permits issued in Baltimore in 2012 (116 more than in 2011) compared to 15 building permits issued in Paterson in 2012 (2 less than in 2011).
In Baltimore (Baltimore city), 87.4% voted for Democrats and 11.1% for Republicans in 2012 Presidential Election. In Paterson (Passaic County), 63.8% voted for Democrats and 35.5% for Republicans.
Elections
Type
Democrats
Republicans
Other
Year
Baltimore
Paterson
Baltimore
Paterson
Baltimore
Paterson
2020
87.5%
57.7%
10.7%
41.1%
1.8%
1.1%
2016
84.8%
59.7%
10.5%
37.3%
4.6%
3.0%
2012
87.4%
63.8%
11.1%
35.5%
1.4%
0.7%
2008
87.6%
60.6%
11.7%
38.8%
0.6%
0.5%
2004
82.5%
55.5%
17.1%
44.0%
0.5%
0.5%
2000
82.9%
57.8%
14.2%
39.1%
2.9%
3.1%
1996
79.3%
56.1%
15.5%
35.0%
5.1%
8.8%
Breakdown of population affiliated with a religious congregation
Type
Adherents
Congregations
Religion
Baltimore
Paterson
Baltimore
Paterson
CATHOLIC CHURCH
11.0%
39.8%
8.2%
15.8%
EPISCOPAL CHURCH
1.6%
0.4%
4.0%
3.0%
AMERICAN BAPTIST CHURCHES IN THE USA
1.4%
0.7%
2.2%
6.7%
SOUTHERN BAPTIST CONVENTION
1.4%
0.1%
7.3%
1.2%
EVANGELICAL LUTHERAN CHURCH IN AMERICA
1.0%
0.2%
4.3%
0.9%
MUSLIM ESTIMATE
0.6%
5.6%
1.5%
4.2%
SEVENTH DAY ADVENTIST CHURCH
0.5%
0.3%
1.5%
2.1%
LUTHERAN CHURCH
0.4%
0.2%
1.8%
1.2%
REFORMED CHURCH IN AMERICA
0.0%
0.5%
0.0%
5.5%
Weather
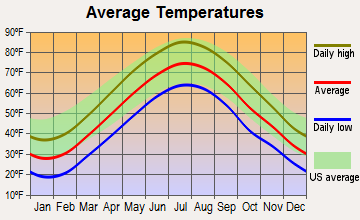
The weather in Baltimore is characterized by hot, humid summers and mild to cool winters. Paterson's climate is relatively similar, although winters can be quite a bit colder due to its more northern location. Both cities experience all four seasons, with beautiful fall and spring transitions that offer a variety of outdoor activities.
Weather and climate
Type
Baltimore
Paterson
Temperature - Average
54.5°F
51.7°F
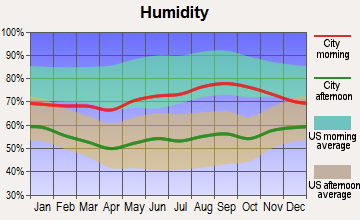
Humidity - Average morning or afternoon humidity
70.4%
67.3%
Humidity - Differences between morning and afternoon humidity
36%
28.8%
Humidity - Maximum monthly morning or afternoon humidity
84%
76.5%
Humidity - Minimum monthly morning or afternoon humidity
48%
47.7%
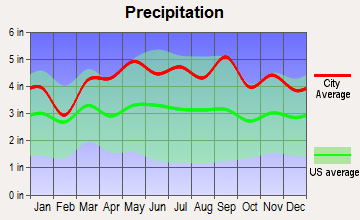
Precipitation - Yearly average
42.9 in
51.4 in
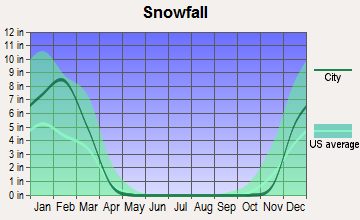
Snowfall - Yearly average
39.6 in
57.2 in
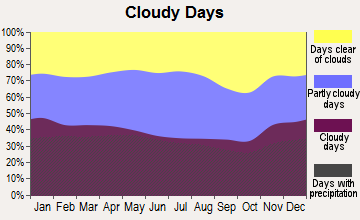
Clouds - Number of days clear of clouds
17.5%
16.9%
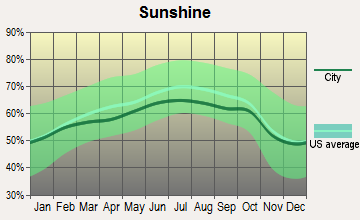
Sunshine amount - Average
60.3%
60.2%
Sunshine amount - Differences during a year
16%
20%
Sunshine amount - Maximum monthly
63%
64%
Sunshine amount - Minimum monthly
47%
44%
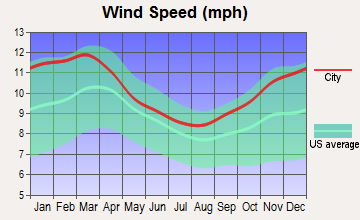
Wind speed - Average
7.9 mph
8.9 mph
Average climate in Baltimore, Maryland
Average climate in Paterson, New Jersey
Air pollution
Type
AQI
CO
NO2
OZONE
PB
PM10
PM25
SO2
Year
Baltimore
Paterson
Baltimore
Paterson
Baltimore
Paterson
Baltimore
Paterson
Paterson
Baltimore
Paterson
Baltimore
Paterson
Baltimore
Paterson
2018
89
100
0.23
0.31
11.8
16.8
28.3
24.9
N/A
N/A
N/A
N/A
7.9
7.9
0.1
0.4
2017
89
97
0.25
0.23
12.1
17.0
27.7
25.3
N/A
N/A
N/A
N/A
8.2
7.7
0.2
0.3
2016
102
95
0.26
0.30
13.0
17.7
28.3
25.4
N/A
N/A
N/A
N/A
7.7
7.9
0.3
0.5
2015
89
102
0.28
0.34
12.4
18.5
28.3
24.8
N/A
N/A
N/A
N/A
9.5
8.8
0.4
0.8
2014
82
96
0.25
0.37
11.8
19.1
25.7
24.1
N/A
N/A
N/A
N/A
10.9
8.2
0.6
1.0
2013
86
98
0.22
0.41
10.7
19.1
25.6
24.6
N/A
N/A
N/A
N/A
9.6
8.8
0.5
1.1
2012
98
100
0.24
0.44
11.3
18.7
25.0
25.0
N/A
N/A
N/A
N/A
11.2
9.1
0.5
1.6
2011
101
108
0.24
0.45
12.5
21.1
25.1
24.2
N/A
N/A
N/A
N/A
12.1
10.5
0.8
2.5
2010
110
112
0.24
0.40
13.1
18.4
26.9
25.6
N/A
N/A
N/A
N/A
12.2
10.1
1.0
1.6
2009
84
104
0.23
0.40
12.2
20.8
23.5
20.9
N/A
N/A
N/A
N/A
10.4
10.4
1.4
2.3
2008
96
110
0.25
0.44
13.6
21.8
21.6
21.8
0.013
N/A
N/A
N/A
12.8
12.1
1.8
3.1
2007
107
121
0.21
0.49
13.8
23.9
23.2
22.1
0.016
N/A
N/A
N/A
14.0
12.9
2.5
4.2
2006
112
116
N/A
0.56
12.0
21.8
24.6
21.8
0.018
N/A
N/A
N/A
14.7
13.1
N/A
4.8
2005
111
112
N/A
0.67
14.3
24.5
26.3
21.1
N/A
N/A
23.0
N/A
17.1
N/A
N/A
6.3
2004
108
108
N/A
0.66
15.3
23.3
28.0
20.1
0.030
N/A
23.1
N/A
16.3
N/A
N/A
6.2
2003
110
107
N/A
0.73
17.8
24.4
22.4
20.3
0.017
N/A
N/A
26.9
13.9
N/A
N/A
6.3
2002
119
122
N/A
0.71
17.4
24.9
19.4
22.0
0.008
N/A
N/A
25.8
16.3
N/A
5.8
5.7
2001
104
123
N/A
0.76
18.2
28.5
23.9
22.4
0.020
N/A
N/A
24.9
N/A
N/A
6.0
6.7
2000
101
115
N/A
0.81
17.0
30.5
22.4
19.7
0.022
N/A
N/A
22.2
N/A
N/A
6.3
6.5
Natural disasters
Type
Baltimore
Paterson
Tornado activity compared to U.S. average
117.8%
64.9%
Earthquake activity compared to U.S. average
40.6%
31.9%
Natural disasters compared to U.S. average
0%
27%
Transportation
Baltimore's public transportation system is more extensive, with light rail, a subway line, and bus connections. The location also offers easy access to larger transportation hubs in DC and Philadelphia. Paterson, while having public transportation options including buses and trains, may find residents more dependent on private vehicles.
Transport
Type
Baltimore
Paterson
Amtrak stations
2
0
Amtrak stations nearby
2
3
FAA registered aircraft
136
6
FAA registered aircraft manufacturers and dealers
2
0
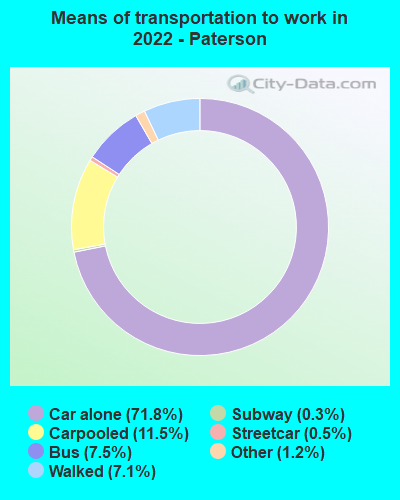
Means of transportation to work
Type
Baltimore
Paterson
Bicycle
0.4%
0.4%
Bus
6.2%
4.3%
Carpooled
7.3%
14.1%
Car alone
77.2%
71.2%
Railroad
0.3%
0.4%
Streetcar
1.2%
1%
Subway
0.2%
0.1%
Taxicab
0.7%
0.3%
Walked
4.5%
6.7%
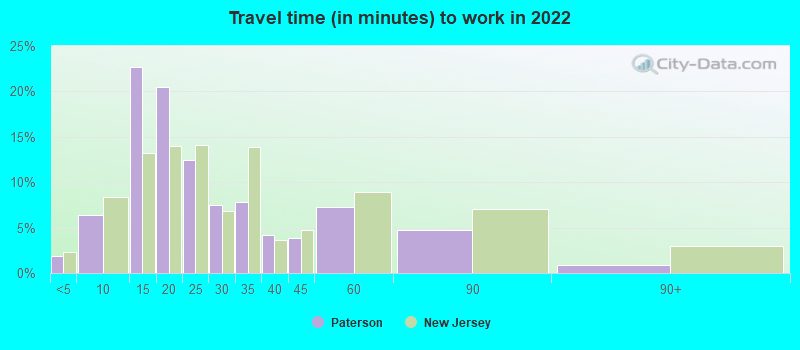
Average travel time to work
Type
Baltimore
Paterson
Average
32.3 min
23.8 min
Other means
26.3 min
23.7 min
Public transportation
46.8 min
37.9 min
Private vehicle occupancy
Type
Baltimore
Paterson
Average
1.1
1.4
Drove alone
90.7%
78.8%
In 2 person carpool
7.5%
13.9%
In 3 person carpool
1%
1.2%
In 4 person carpool
0.4%
3.5%
In 5-6 person carpool
0.3%
0.6%
In 7+ person carpool
0.2%
1.9%
How many people usually rode to work in the car, truck or van.
Real Estate
On average, housing prices are generally lower in Baltimore than in Paterson. Baltimore offers a range of housing options from downtown apartments to single-family homes. In contrast, real estate in Paterson is considerably more expensive, likely owing to its proximity to NYC.
Neighborhoods
Baltimore offers various types of neighborhoods, from the historic Inner Harbor area to quiet suburban areas. Paterson also boasts diverse neighborhoods that range from urban to suburban, with a rich tapestry of cultural communities in each.
Houses and residents
Type
Baltimore
Paterson
Houses
293,487
54,231
Average household size (people)
2.4
3.2
Median year apartment built
1959
1953
Median year house/condo built
1944
1959
Length of stay in the house since moving in
15.7 years
14.7 years
Houses occupied
254,370 (86.7%)
51,612 (95.2%)
Houses occupied by owners
123,249 (48.5%)
12,739 (24.7%)
Houses occupied by renters
131,121 (51.5%)
38,873 (75.3%)
Median rent asked for vacant for-rent units
$1,254
$698.12
Median monthly housing costs
$1,196
$1,384
Median price asked for vacant for-sale houses and condos
$207,303
$364,794
Estimated median house or condo value
$193,100
$311,700
Median numbers of rooms
5.6
4.4
Median number of rooms in apartments
4.2
4.1
Median number of rooms in houses and condos
6.5
5.7
Median house price - detached houses
$321,473
$287,284
Median house price - in 2-unit structures
$218,934
$313,458
Median house price - in 3-to-4-unit structures
$142,945
$345,728
Median house price - in 5 or more unit structures
$257,173
$235,269
Median house price - Townhouses or other attached units
$210,096
$329,578
Median house price - All housing units
$246,241
$302,290
Median house age
72
67
Renting percentage
52.3%
70.4%
Housing density (houses/condos per square mile)
3,632.1
6,423.7
House value disparities
38.5%
24.8%
Household income disparities
49.4%
48%
Median household income for houses/condes with a mortgage
$85,990
$90,533
Median household income for apartments without a mortgage
$53,334
$62,649
Housing units without a mortgage
2,415 (2.8%)
139 (1.6%)
Housing units with both a second mortgage and home equity loan
5,740 (6.6%)
231 (2.6%)
Housing units with a mortgage
84,578 (97.2%)
8,710 (98.4%)
Housing units with a home equity loan
579 (0.7%)
64 (0.7%)
Housing units with a second mortgage
8,544 (9.8%)
410 (4.6%)
House/condo owner moved in on average (years ago)
14
13
House/condo renter moved in on average (years ago)
3
4
Housing units lacking complete kitchen facilities
6%
4.1%
Housing units lacking complete plumbing facilities
5.1%
0.7%
Housing units in structures
Housing units in structures
Baltimore
Paterson
One, detached
16.4%
14.9%
One, attached
49.5%
6.2%
Two
4.5%
35.5%
3 or 4
4.9%
20.0%
5 to 9
5.5%
5.4%
10 to 19
4.8%
5.5%
20 to 49
2.8%
3.9%
50 or more
11.4%
8.4%
Mobile homes
0.2%
0.1%
Boats, RVs, vans, etc.
0.1%
0.0%
Median real estate property taxes paid for housing units
Self-employed workers in own not incorporated business
12,671
3,938
State government workers
20,410
1,755
Unpaid family workers
356
87
Industries and Occupations
Healthcare and social assistance is the leading industry in Baltimore, followed by professional and scientific services. Paterson's dominant industries are manufacturing, education, and healthcare, with plenty of job opportunities in those sectors.
Baltimore has a high concentration of high-quality medical facilities, including Johns Hopkins Hospital. Paterson’s health care offerings are robust as well, anchored by St. Joseph's Health.
Health (county statistics)
Type
Baltimore
Paterson
General health status score of residents in this county from 1 (poor) to 5 (excellent)
Baltimore boasts more developed infrastructure, with a plethora of historic, cultural and commercial buildings, along with extensive public transportation possessor three airports nearby. Paterson's infrastructure is developing, with historic sites and parks being the highlight, but its public transportation options and amenities don't quite match Baltimore’s.
HMDA - Conventional home purchase loans - Applications denied
Year
Baltimore
Paterson
1999
2,486
227
2000
2,058
270
2001
1,371
196
2002
1,111
233
2003
1,526
350
2004
2,929
687
2005
4,981
1,036
2006
5,533
1,266
2007
3,592
844
2008
1,111
220
2009
381
90
Culture and Food
Both cities have vibrant culture and food scenes. Baltimore is famous for its seafood, especially crab cakes and Old Bay seasoning, while Paterson has a more ethnically diverse food scene, with notable Middle Eastern and Latin American eateries.
Sports Teams
Baltimore is home to the NFL's Baltimore Ravens and the MLB's Baltimore Orioles. Paterson doesn't have a major league team but is a short commute away from New York City's multitude of professional sports teams.


 Baltimore, MD
 Paterson, NJ