Baltimore, Maryland and Stamford, Connecticut, though situated on the East Coast, offer very different lifestyles. Baltimore is a bustling city known for its historic sea port, cultural diversity and sports teams, while Stamford, a somewhat smaller entity, is known for its thriving economy and proximity to New York. This city comparison will delve into various aspects such as crime/safety, weather, cost of living, and more, to give a clearer picture of what each city has to offer.
Distance between
Baltimore, MD and
Stamford, CT : 203.1 miles
Baltimore's population is larger by 323%. Its population has decreased by 74,656 people (11.5%) since 2000. The population of Stamford has grown by 19,226 people (16.4%) during that time.
Both Baltimore and Stamford have crime rates that contrast sharply. According to NeighborhoodScout, Baltimore's crime rate is considerably higher than the national average, which can be a concern for potential residents or tourists. On the other hand, Stamford has a much lower crime rate compared to the national average, making it a safer choice for both residents and visitors.
City-data.com crime index counts serious crimes and violent crime more heavily. It adjusts for the number of visitors and daily workers commuting into cities. (higher means more crime, U.S. average = 301.1)
City-data.com crime index counts serious crimes and violent crime more heavily. It adjusts for the number of visitors and daily workers commuting into cities. (higher means more crime, U.S. average = 301.1)
Sex Offenders
According to our data, there are 1,557 registered sex offenders living in Baltimore and 67 registered sex offenders living in . The ratio of residents to sex offenders in Baltimore is 395 to 1; the ratio in Stamford is 1,927 to 1. The number of registered sex offenders compared to the number of residents is much larger in Baltimore than that in Stamford.
Cost of Living
Cost of living is another area where these two cities differ significantly. According to BestPlaces, the cost of living in Stamford is significantly higher than in Baltimore, specifically when it comes to housing costs.
Income Tax
Maryland, where Baltimore is located, has a graduated income tax system, while Connecticut has seven income tax brackets, with rates ranging from 3.00% to 6.99%. Residents in Stamford will likely pay higher state income tax compared to those living in Baltimore.
Property Tax
Both cities have differing property taxes. Baltimore City has one of the highest property tax rates in Maryland, while Stamford's property tax rates are also relatively high, particularly in comparison to other towns in FairField County.
Sales Tax
The sales tax rate in Baltimore is 6.00%, with no additional city sales tax. Stamford, as part of Connecticut, has a slightly higher state sales tax at 6.35%.
Income
Type
Baltimore
Stamford
Estimated median household income
$54,652
$100,543
Estimated per capita income
$35,091
$56,232
Cost of living index (U.S. average is 100)
105.7
136.2
If you make $50,000 in Baltimore, you will have to make $64,428 in Stamford to maintain the same standard of living.
Geographical Conditions
Baltimore is located in Central Maryland, along the Patapsco River. It's known for its Inner Harbor and numerous historic districts. Stamford, on the other hand, is located on the Long Island Sound, boasting beach access, parks, and a vibrant downtown area.
Both Baltimore and Stamford present strong education systems. Baltimore boasts of reputable universities, like Johns Hopkins University and University of Maryland. Stamford, being smaller, has fewer higher education institutions, but offers quality education through its public and private schools and has proximity to universities in nearby cities.
Baltimore's economy is largely driven by industries such as health care, education, and tourism, while Stamford's economy is more oriented towards finance, insurance, and professional services. Stamford holds the edge in terms of median household income, ranking well above the national average.
Biggest Employers
The largest employers in Baltimore are Johns Hopkins University and Johns Hopkins Health System. Stamford's economy is driven by a number of large corporations, such as Charter Communications, Synchrony Financial and Indeed.com.
There were 191 building permits issued in Baltimore in 2012 (116 more than in 2011) compared to 24 building permits issued in Stamford in 2012 (6 less than in 2011).
In Baltimore (Baltimore city), 87.4% voted for Democrats and 11.1% for Republicans in 2012 Presidential Election. In Stamford (Fairfield County), 54.9% voted for Democrats and 44.2% for Republicans.
Elections
Type
Democrats
Republicans
Other
Year
Baltimore
Stamford
Baltimore
Stamford
Baltimore
Stamford
2020
87.5%
62.9%
10.7%
35.8%
1.8%
1.3%
2016
84.8%
58.0%
10.5%
38.1%
4.6%
3.9%
2012
87.4%
54.9%
11.1%
44.2%
1.4%
0.9%
2008
87.6%
58.7%
11.7%
40.5%
0.6%
0.7%
2004
82.5%
51.5%
17.1%
47.4%
0.5%
1.1%
2000
82.9%
52.3%
14.2%
43.1%
2.9%
4.5%
1996
79.3%
48.9%
15.5%
41.1%
5.1%
10.0%
Breakdown of population affiliated with a religious congregation
Type
Adherents
Congregations
Religion
Baltimore
Stamford
Baltimore
Stamford
CATHOLIC CHURCH
11.0%
44.1%
8.2%
14.2%
EPISCOPAL CHURCH
1.6%
2.5%
4.0%
6.6%
AMERICAN BAPTIST CHURCHES IN THE USA
1.4%
1.4%
2.2%
3.8%
SOUTHERN BAPTIST CONVENTION
1.4%
0.3%
7.3%
2.6%
EVANGELICAL LUTHERAN CHURCH IN AMERICA
1.0%
0.5%
4.3%
2.4%
MUSLIM ESTIMATE
0.6%
0.6%
1.5%
2.0%
SEVENTH DAY ADVENTIST CHURCH
0.5%
0.3%
1.5%
2.6%
LUTHERAN CHURCH
0.4%
0.3%
1.8%
1.5%
Weather
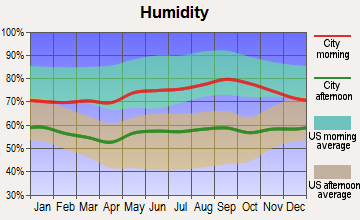
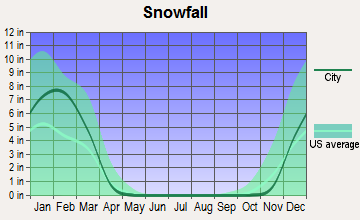
Both cities experience four distinct seasons; however, Baltimore tends to have moderately hot, humid summers and cool winters. Stamford, due to its coastal location, has fairly mild summers and cold winters, with more frequent snowfall compared to Baltimore. Both cities have about the same amounts of rainfall annually.
Weather and climate
Type
Baltimore
Stamford
Temperature - Average
54.5°F
51.5°F
Humidity - Average morning or afternoon humidity
70.4%
71.2%
Humidity - Differences between morning and afternoon humidity
36%
26.5%
Humidity - Maximum monthly morning or afternoon humidity
84%
79.2%
Humidity - Minimum monthly morning or afternoon humidity
48%
52.7%
Precipitation - Yearly average
42.9 in
52.4 in
Snowfall - Yearly average
39.6 in
58.3 in
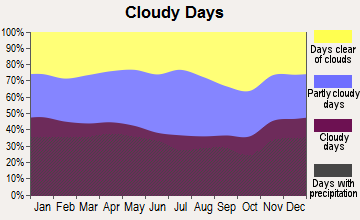
Clouds - Number of days clear of clouds
17.5%
16.6%
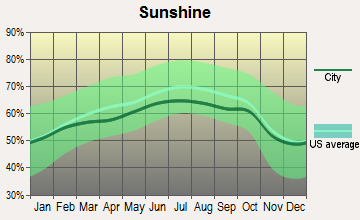
Sunshine amount - Average
60.3%
60.2%
Sunshine amount - Differences during a year
16%
19.9%
Sunshine amount - Maximum monthly
63%
64%
Sunshine amount - Minimum monthly
47%
44.1%
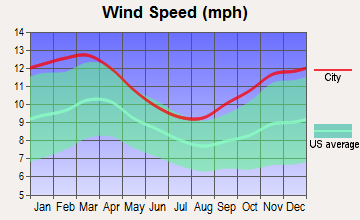
Wind speed - Average
7.9 mph
10.7 mph
Average climate in Baltimore, Maryland
Average climate in Stamford, Connecticut
Air pollution
Type
AQI
CO
NO2
OZONE
PM10
PM25
SO2
Year
Baltimore
Stamford
Baltimore
Stamford
Baltimore
Stamford
Baltimore
Stamford
Baltimore
Baltimore
Stamford
Baltimore
Stamford
2018
89
94
0.23
0.33
11.8
9.7
28.3
27.8
N/A
N/A
7.9
6.3
0.1
0.4
2017
89
92
0.25
0.20
12.1
12.8
27.7
27.5
N/A
N/A
8.2
6.2
0.2
0.4
2016
102
107
0.26
0.34
13.0
15.6
28.3
27.2
N/A
N/A
7.7
7.0
0.3
0.6
2015
89
105
0.28
0.34
12.4
17.1
28.3
27.1
N/A
N/A
9.5
8.3
0.4
1.2
2014
82
102
0.25
0.34
11.8
10.7
25.7
26.9
N/A
N/A
10.9
8.1
0.6
1.5
2013
86
113
0.22
0.37
10.7
11.0
25.6
27.3
N/A
N/A
9.6
9.1
0.5
1.2
2012
98
102
0.24
0.30
11.3
10.6
25.0
26.4
N/A
N/A
11.2
7.6
0.5
1.5
2011
101
99
0.24
0.34
12.5
14.7
25.1
25.9
N/A
N/A
12.1
9.4
0.8
2.4
2010
110
102
0.24
0.32
13.1
12.1
26.9
27.0
N/A
N/A
12.2
7.9
1.0
2.0
2009
84
101
0.23
0.33
12.2
12.4
23.5
23.8
N/A
N/A
10.4
7.7
1.4
2.7
2008
96
111
0.25
0.35
13.6
14.1
21.6
24.9
N/A
N/A
12.8
9.2
1.8
2.5
2007
107
114
0.21
0.57
13.8
16.0
23.2
24.0
N/A
N/A
14.0
9.9
2.5
2.7
2006
112
104
N/A
0.64
12.0
16.3
24.6
23.6
N/A
N/A
14.7
N/A
N/A
2.7
2005
111
105
N/A
0.76
14.3
17.3
26.3
23.3
23.0
N/A
17.1
N/A
N/A
3.8
2004
108
95
N/A
0.71
15.3
16.4
28.0
22.2
23.1
N/A
16.3
N/A
N/A
4.2
2003
110
99
N/A
0.89
17.8
18.4
22.4
23.0
N/A
N/A
13.9
N/A
N/A
4.3
2002
119
112
N/A
0.92
17.4
20.3
19.4
23.4
N/A
N/A
16.3
N/A
5.8
4.1
2001
104
116
N/A
0.93
18.2
22.7
23.9
23.2
N/A
N/A
N/A
N/A
6.0
5.1
2000
101
103
N/A
0.92
17.0
20.6
22.4
22.3
N/A
N/A
N/A
N/A
6.3
4.8
Natural disasters
Type
Baltimore
Stamford
Tornado activity compared to U.S. average
117.8%
59.1%
Earthquake activity compared to U.S. average
40.6%
30.6%
Natural disasters compared to U.S. average
0%
24%
Transportation
Baltimore has an extensive public transportation system, including buses, light rail, and subway. Stamford, although smaller, also has a thorough bus service and heavily relies on Metro-North Commuter trains for commuting to New York City.
Transport
Type
Baltimore
Stamford
Amtrak stations
2
1
Amtrak stations nearby
2
3
FAA registered aircraft
136
46
FAA registered aircraft manufacturers and dealers
2
0
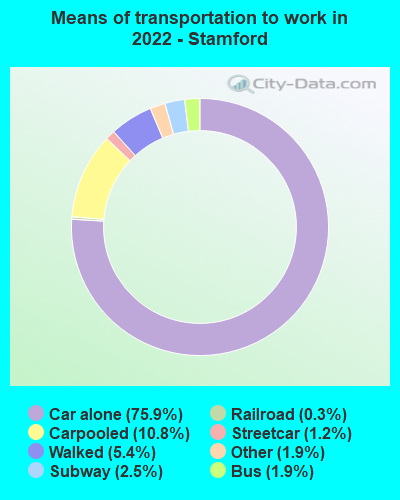
Means of transportation to work
Type
Baltimore
Stamford
Bicycle
0.4%
0.2%
Bus
6.2%
2.6%
Carpooled
7.3%
10.3%
Car alone
77.2%
72.8%
Railroad
0.3%
0.2%
Streetcar
1.2%
0.6%
Subway
0.2%
3.4%
Taxicab
0.7%
0.3%
Walked
4.5%
7.8%
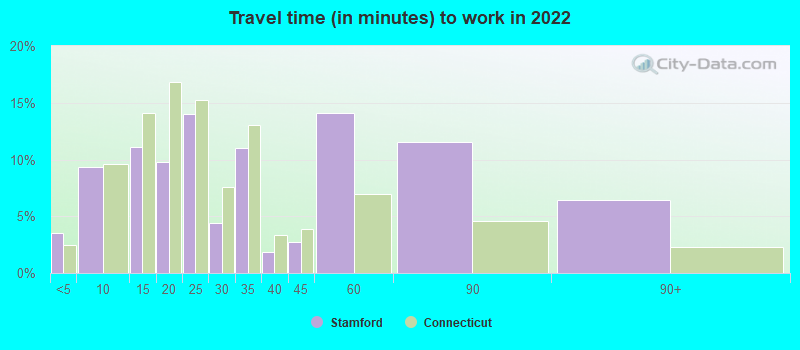
Average travel time to work
Type
Baltimore
Stamford
Average
32.3 min
31.6 min
Other means
26.3 min
21.9 min
Public transportation
46.8 min
52 min
Private vehicle occupancy
Type
Baltimore
Stamford
Average
1.1
1.2
Drove alone
90.7%
87%
In 2 person carpool
7.5%
9.2%
In 3 person carpool
1%
2.1%
In 4 person carpool
0.4%
0.7%
In 5-6 person carpool
0.3%
0.5%
In 7+ person carpool
0.2%
0.5%
How many people usually rode to work in the car, truck or van.
Real Estate
In terms of real estate, Baltimore offers more affordable housing options compared to Stamford. According to Zillow, the median home value in Baltimore is significantly lower than in Stamford.
Neighborhoods
Baltimore is known for its diverse neighborhoods, each with its unique charm and character like Fell's Point or Hampden. Stamford also has a variety of neighborhoods to choose from, many of which are characterized by their familial and community-oriented environment.
Houses and residents
Type
Baltimore
Stamford
Houses
293,487
57,380
Average household size (people)
2.4
2.6
Median year apartment built
1959
1983
Median year house/condo built
1944
1965
Length of stay in the house since moving in
15.7 years
14.9 years
Houses occupied
254,370 (86.7%)
52,816 (92%)
Houses occupied by owners
123,249 (48.5%)
25,833 (48.9%)
Houses occupied by renters
131,121 (51.5%)
26,983 (51.1%)
Median rent asked for vacant for-rent units
$1,254
$3,036
Median monthly housing costs
$1,196
$2,180
Median price asked for vacant for-sale houses and condos
$207,303
$410,651
Estimated median house or condo value
$193,100
$576,000
Median numbers of rooms
5.6
4.8
Median number of rooms in apartments
4.2
3.7
Median number of rooms in houses and condos
6.5
6.4
Median house price - detached houses
$321,473
$754,776
Median house price - in 2-unit structures
$218,934
$448,161
Median house price - in 3-to-4-unit structures
$142,945
$414,898
Median house price - in 5 or more unit structures
$257,173
$281,966
Median house price - Townhouses or other attached units
$210,096
$489,427
Median house price - All housing units
$246,241
$637,429
Median house age
72
46
Renting percentage
52.3%
44.7%
Housing density (houses/condos per square mile)
3,632.1
1,520.2
House value disparities
38.5%
25.5%
Household income disparities
49.4%
41.3%
Median household income for houses/condes with a mortgage
$85,990
$145,538
Median household income for apartments without a mortgage
$53,334
$115,415
Housing units without a mortgage
2,415 (2.8%)
549 (3.1%)
Housing units with both a second mortgage and home equity loan
5,740 (6.6%)
2,151 (12.1%)
Housing units with a mortgage
84,578 (97.2%)
17,210 (96.9%)
Housing units with a home equity loan
579 (0.7%)
74 (0.4%)
Housing units with a second mortgage
8,544 (9.8%)
2,405 (13.5%)
House/condo owner moved in on average (years ago)
14
12
House/condo renter moved in on average (years ago)
3
2
Housing units lacking complete kitchen facilities
6%
1.4%
Housing units lacking complete plumbing facilities
5.1%
0.4%
Housing units in structures
Housing units in structures
Baltimore
Stamford
One, detached
16.4%
34.8%
One, attached
49.5%
7.7%
Two
4.5%
8.4%
3 or 4
4.9%
8.0%
5 to 9
5.5%
4.5%
10 to 19
4.8%
4.1%
20 to 49
2.8%
4.2%
50 or more
11.4%
28.1%
Mobile homes
0.2%
0.0%
Boats, RVs, vans, etc.
0.1%
0.4%
Median real estate property taxes paid for housing units
Self-employed workers in own not incorporated business
12,671
6,616
State government workers
20,410
1,843
Unpaid family workers
356
127
Industries and Occupations
Baltimore's largest industries include education, health services, and tourism, with many residents working in the administrative, sales, and educational sectors. Stamford stands out with its concentration of Fortune 500 companies, specifically within the finance and insurance industries.
Baltimore houses some of the nation's top hospitals, including Johns Hopkins Hospital. Stamford also offers quality healthcare services including the reputable Stamford Hospital. Both cities prioritize healthcare, which is a significant factor for residents and visitors alike.
Health (county statistics)
Type
Baltimore
Stamford
General health status score of residents in this county from 1 (poor) to 5 (excellent)
Baltimore has a robust infrastructure with a mix of historic and modern architecture and has been undergoing continued urban development. In Stamford, infrastructure development has grown in recent years, with a surge in construction of condominiums and high-rise office buildings.
Infrastructure
Type
Baltimore
Stamford
Hospitals
45
2
TV stations
19
36
Bank branches located here
215
53
Bank institutions located here
44
19
Main business address for public companies
27
34
Drinking water stations with no reported violations in the past
13
2
Drinking water stations with reported violations in the past
HMDA - Conventional home purchase loans - Applications denied
Year
Baltimore
Stamford
1999
2,486
302
2000
2,058
370
2001
1,371
359
2002
1,111
326
2003
1,526
373
2004
2,929
588
2005
4,981
801
2006
5,533
710
2007
3,592
509
2008
1,111
251
2009
381
141
Culture and Food
With its historic seaport, Baltimore offers a unique cultural experience with attractions like the Inner Harbour, museums, and a food scene known for dishes like crab cakes and pit beef. Stamford may be smaller but boasts a rich cultural scene with a variety of festivals, arts venues, and a diverse food scene.
Sports Teams
Baltimore is home to two major sports teams, the Baltimore Ravens (NFL) and the Baltimore Orioles (MLB). While Stamford doesn't have any major league sports teams, its close proximity to New York offers residents easy access to New York's sports teams.


 Baltimore, MD
 Stamford, CT