Central Contra Costa and Elk Grove, both nestled in the diverse landscapes of California, offer a unique mix of lifestyle, economic opportunity and cultural charm. Comparing the two brings into the limelight a variety of factors that cater differently to residents and tourists alike. Factors ranging from crime and safety to cost of living, education, and culture are examined in detail. Moreover, the economic and industrial activities, transportation amenities, tax structures, and geographical features are also scrutinized to provide a comprehensive comparison.
Central Contra Costa generally enjoys a lower crime rate compared to the state average. Police presence and community vigilance contribute to a safer living environment. Elk Grove, comparatively, records higher crime rate but maintains a decent safety standard for a city its size. Both cities, however, are making significant efforts to reduce crime and improve public safety.
Cost of Living
Living in Central Contra Costa is generally more expensive than Elk Grove. The higher cost of housing, groceries, and utilities contribute to the increased cost of living. However, this higher cost comes with its benefits in the form of better amenities, higher paying job opportunities, and improved lifestyle.
Income Tax
California imposes the same state income tax rates on all its cities, ranging from 1% to 13.3% based on income brackets.
Property Tax
In Central Contra Costa, the average property tax rate is 0.77%, whereas in Elk Grove, the average property tax rate is around 0.84%.
Sales Tax
Both regions have a state sales tax rate of 7.25%. However, local add-ons bring the total sales tax in Central Contra Costa to 8.25% and 7.75% in Elk Grove.
Income
Type
Central Contra Costa
Elk Grove
Estimated median household income
$127,452
$109,242
Estimated per capita income
$68,702
$38,695
Cost of living index (U.S. average is 100)
139.1
102.7
If you make $50,000 in Elk Grove, you will have to make $67,722 in Central Contra Costa to maintain the same standard of living.
Geographical Conditions
Central Contra Costa is characterized by a balance of urban, suburban, and semi-rural areas with scenic beauty. Elk Grove features green open spaces, with creeks, a lake, and several parks.
Geographical information
Type
Central Contra Costa
Elk Grove
Land area
261.3 sq. miles
15.2 sq. miles
Population density
1,863.4 people per sq. mile
11,778 people per sq. mile
Relative area comparison
Central Contra Costa, CA Elk Grove, CA
Education
Both regions provide good educational infrastructure but Central Contra Costa has slightly higher educational attainment. With renowned schools and institutions, Central Contra Costa serves as an educational hub. Elk Grove, on the other hand, has strong community colleges and offers a variety of vocational courses.
Since Central Contra Costa is economically more diversified, it can provide varied job opportunities with higher wages. Elk Grove, although smaller, has shown impressive growth in recent years with opportunities mainly in healthcare, retail, and education sectors.
Biggest Employers
In Central Contra Costa, some of the top employers include Chevron Corp., County of Contra Costa, and Kaiser Permanente. In Elk Grove, the leading employers are Elk Grove Unified School District, Apple, and Kaiser Permanente.
In Central Contra Costa (Contra Costa County), 66.2% voted for Democrats and 31.1% for Republicans in 2012 Presidential Election. In Elk Grove (Sacramento County), 58.1% voted for Democrats and 39.1% for Republicans.
Elections
Type
Democrats
Republicans
Other
Year
Central Contra Costa
Elk Grove
Central Contra Costa
Elk Grove
Central Contra Costa
Elk Grove
2020
71.8%
61.4%
26.4%
36.1%
1.8%
2.5%
2016
67.5%
58.0%
24.5%
33.8%
8.0%
8.3%
2012
66.2%
58.1%
31.1%
39.1%
2.7%
2.8%
2008
68.0%
58.4%
30.2%
39.4%
1.8%
2.2%
2004
62.6%
49.8%
36.7%
49.6%
0.7%
0.6%
2000
59.0%
49.4%
37.2%
45.4%
3.8%
5.2%
1996
55.7%
49.8%
35.2%
40.8%
9.1%
9.4%
Breakdown of population affiliated with a religious congregation
Type
Adherents
Congregations
Religion
Central Contra Costa
Elk Grove
Central Contra Costa
Elk Grove
CATHOLIC CHURCH
21.8%
16.2%
5.2%
5.1%
SOUTHERN BAPTIST CONVENTION
1.3%
1.7%
10.0%
8.6%
MUSLIM ESTIMATE
1.0%
0.9%
1.4%
1.3%
EPISCOPAL CHURCH
0.5%
0.3%
2.3%
1.4%
EVANGELICAL LUTHERAN CHURCH IN AMERICA
0.5%
0.5%
2.0%
1.8%
AMERICAN BAPTIST CHURCHES IN THE USA
0.3%
0.4%
2.6%
1.7%
SEVENTH DAY ADVENTIST CHURCH
0.3%
0.6%
1.5%
2.1%
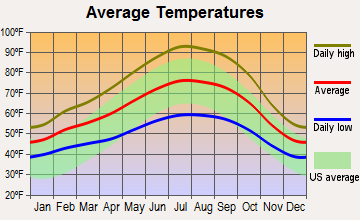
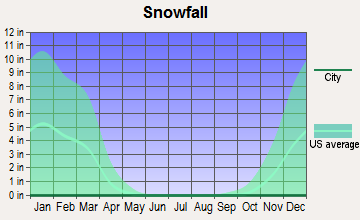
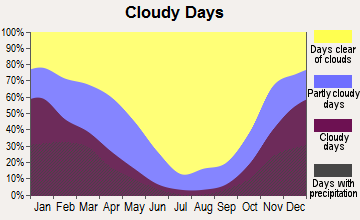
Weather
Both Central Contra Costa and Elk Grove witness a Mediterranean climate. Hot, dry summers and mild, wet winters characterize the weather. Elk Grove tends to be hotter in summers as it's more inland, while Central Contra Costa is tempered by coastal influences, offering a more refreshed summer experience.
Weather and climate
Type
Central Contra Costa
Elk Grove
Temperature - Average
59.1°F
62.1°F
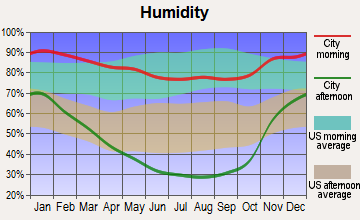
Humidity - Average morning or afternoon humidity
82.2%
66.7%
Humidity - Differences between morning and afternoon humidity
29.3%
58%
Humidity - Maximum monthly morning or afternoon humidity
88.1%
87%
Humidity - Minimum monthly morning or afternoon humidity
58.8%
29%
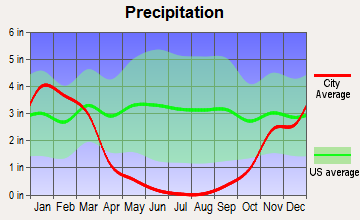
Precipitation - Yearly average
21.8 in
19.1 in
Snowfall - Yearly average
0 in
0 in
Clouds - Number of days clear of clouds
27.7%
31.5%
Sunshine amount - Average
73.3%
83.6%
Sunshine amount - Differences during a year
22.4%
52%
Sunshine amount - Maximum monthly
77.2%
97%
Sunshine amount - Minimum monthly
54.7%
45%
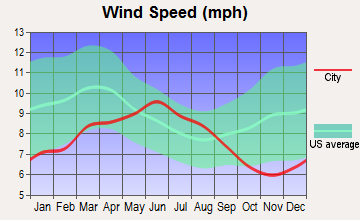
Wind speed - Average
11.1 mph
6.8 mph
Average climate in Central Contra Costa, California
Average climate in Elk Grove, California
Air pollution
Type
AQI
CO
NO2
OZONE
PB
PM10
PM25
SO2
Year
Central Contra Costa
Elk Grove
Central Contra Costa
Elk Grove
Central Contra Costa
Elk Grove
Central Contra Costa
Elk Grove
Central Contra Costa
Elk Grove
Elk Grove
Central Contra Costa
Elk Grove
Central Contra Costa
Elk Grove
2018
105
121
0.32
0.33
6.9
6.1
22.1
25.8
0.012
0.002
27.6
N/A
13.3
12.7
0.6
N/A
2017
102
117
0.30
0.31
7.0
6.2
25.9
26.0
0.008
0.002
21.3
N/A
11.9
9.7
0.7
N/A
2016
86
101
0.28
0.40
6.5
6.3
25.2
25.2
0.005
0.002
15.6
N/A
6.5
8.5
0.8
N/A
2015
94
103
0.34
0.28
7.6
7.4
25.8
25.1
0.004
0.002
18.4
N/A
8.8
10.5
0.5
N/A
2014
95
99
0.35
0.27
7.8
7.7
25.2
25.5
0.005
0.002
17.7
N/A
6.9
8.7
0.5
N/A
2013
93
102
0.34
0.31
9.3
8.9
21.5
24.3
0.004
0.002
22.0
N/A
7.8
10.5
0.5
N/A
2012
93
107
0.32
0.30
8.5
8.5
25.2
26.5
0.003
0.002
15.4
N/A
8.3
8.5
0.3
N/A
2011
99
106
0.35
0.31
9.0
9.2
23.0
25.0
0.003
0.002
18.5
N/A
9.8
11.3
0.6
N/A
2010
93
109
0.31
0.29
8.6
8.8
23.2
23.5
0.014
N/A
16.5
N/A
8.5
8.9
0.5
0.5
2009
104
118
0.31
0.40
9.5
10.0
23.7
24.8
0.006
0.003
19.5
N/A
10.3
10.9
0.6
0.5
2008
120
130
0.36
0.40
10.2
11.2
26.1
26.4
0.006
N/A
23.5
N/A
12.1
13.2
0.8
0.5
2007
104
129
0.36
0.41
10.7
11.7
24.1
25.0
0.006
0.005
19.7
N/A
9.7
12.5
0.7
0.6
2006
109
124
0.39
0.46
10.9
12.5
26.0
26.1
N/A
N/A
23.3
N/A
11.1
12.3
0.8
0.5
2005
104
125
0.43
0.43
11.6
12.0
22.7
23.2
N/A
N/A
21.0
N/A
10.4
13.1
1.0
0.6
2004
112
119
0.46
0.44
12.4
12.3
22.6
22.8
0.004
N/A
22.4
N/A
11.9
12.8
1.1
0.6
2003
84
119
0.51
0.47
13.4
13.4
23.1
25.2
N/A
N/A
21.2
N/A
N/A
N/A
0.7
0.9
2002
88
113
0.51
0.49
14.7
14.8
23.3
25.2
0.008
0.004
24.0
N/A
N/A
N/A
0.9
1.5
2001
90
110
0.56
0.45
15.4
13.9
22.1
24.0
0.008
0.004
21.8
N/A
N/A
N/A
1.2
1.4
2000
95
107
0.67
0.48
15.9
14.3
20.8
21.4
0.013
0.004
19.9
N/A
N/A
N/A
1.6
1.4
Natural disasters
Type
Central Contra Costa
Elk Grove
Tornado activity compared to U.S. average
9.4%
8.8%
Earthquake activity compared to U.S. average
7,786.2%
7,869.8%
Natural disasters compared to U.S. average
18%
18%
Transportation
Public transit in Central Contra Costa includes buses, trains, and ferries. On the other hand, Elk Grove primarily relies on bus transit and highways. The commuting time is generally longer in Central Contra Costa due to more traffic congestion.
Transport
Type
Central Contra Costa
Elk Grove
Amtrak stations nearby
3
2
FAA registered aircraft
0
83
FAA registered aircraft manufacturers and dealers
0
1
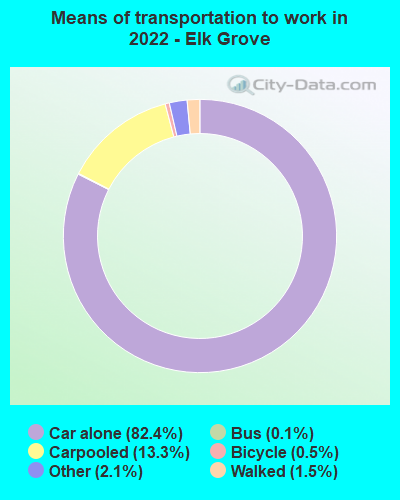
Means of transportation to work
Type
Central Contra Costa
Elk Grove
Bicycle
0.5%
0.2%
Bus
1%
1.4%
Carpooled
9.9%
14.9%
Car alone
72.3%
81.9%
Motorcycle
0.2%
0.1%
Railroad
0.8%
0%
Subway
7.7%
0%
Walked
1.5%
1.3%
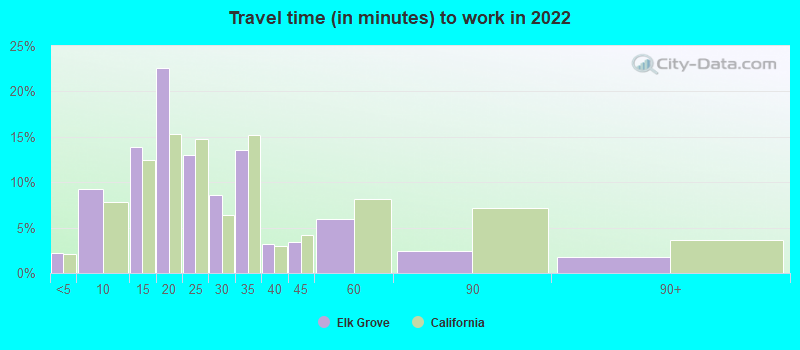
Average travel time to work
Type
Central Contra Costa
Elk Grove
Average
31.8 min
25.1 min
Real Estate
While real estate is a more expensive affair in Central Contra Costa, housing in Elk Grove is considered more affordable. Each has a mixed bag of real estate options ranging from single-family homes to luxury condos.
Neighborhoods
Central Contra Costa has both highly urbanized and suburban neighborhoods to choose from. Elk Grove, predominantly suburban, has a family-friendly atmosphere with numerous parks and recreational areas.
Houses and residents
Type
Central Contra Costa
Elk Grove
Houses
183,777
54,385
Average household size (people)
2.5
3.2
Houses occupied
179,136 (97.5%)
53,724 (98.8%)
Houses occupied by owners
127,889 (71.4%)
39,576 (73.7%)
Houses occupied by renters
51,247 (28.6%)
14,148 (26.3%)
Median rent asked for vacant for-rent units
$2,527
$901.65
Median price asked for vacant for-sale houses and condos
$1,269,474
$504,618
Estimated median house or condo value
Over $1,000,000
$569,900
Median number of rooms in apartments
4.3
5.4
Median number of rooms in houses and condos
6.5
6.8
Renting percentage
30.3%
25.4%
Housing density (houses/condos per square mile)
703.4
3,578.6
Household income disparities
35.9%
36.1%
Housing units without a mortgage
20,208 (18.2%)
267 (0.9%)
Housing units with both a second mortgage and home equity loan
Self-employed workers in own not incorporated business
22,217
4,526
State government workers
6,705
13,021
Unpaid family workers
617
71
Industries and Occupations
Industries in Central Contra Costa are diverse with sectors such as Healthcare, Education, and Tech leading. Whereas, Elk Grove is dominated by healthcare, government, education, and retail trade sectors.
Central Contra Costa is famous for its top-notch healthcare facilities, while healthcare in Elk Grove is accessible and efficient, with multiple renowned hospitals.
Health (county statistics)
Type
Central Contra Costa
Elk Grove
General health status score of residents in this county from 1 (poor) to 5 (excellent)
Elk Grove and Central Contra Costa both have developed infrastructure. Road networks, public spaces, utilities, and overall urban planning, are well-thought-out, though Central Contra Costa, being older, has a more mature infrastructure.
Infrastructure
Type
Central Contra Costa
Elk Grove
TV stations
24
22
Culture and Food
From farmers’ markets and wine festivals in Central Contra Costa to cultural festivals and dining destinations in Elk Grove, both places offer vibrant cultural and food scenes.
Sports Teams
While Elk Grove doesn't host any major professional sports teams, it's a short distance to Sacramento which does. Central Contra Costa, close to San Francisco, provides access to the big-city sports scene.
 Central Contra Costa, CA
 Elk Grove, CA