This comparison analysis covers Central Contra Costa and Roseville in California; two distinctly different areas each possessing their unique attributes, challenges and opportunities. From crime rates to infrastructure, employment possibilities to educational standards, this report provides a comprehensive look at what each region offers, aiding those keen to relocate or visit either area.
Central Contra Costa and Roseville both maintain relatively low crime rates compared to other areas in California. However, Roseville's lower overall crime rate represents a safer environment, particularly in violent and property crimes. Citizens in both locations prioritize community safety efforts through various neighborhood watch programs and active cooperation with local law enforcement.
Cost of Living
Living in Central Contra Costa is slightly more expensive than Roseville due to higher housing costs. Grocery prices, utilities, transportation, and healthcare costs are however comparable, with slight variations. This is integral for anyone considering relocating, as these costs directly influence day-to-day life and overall quality of living.
Income Tax
Statewide income tax applies evenly across California, so residents of both Central Contra Costa and Roseville are subject to the same income taxation rates.
Property Tax
Property taxes in Central Contra Costa are typically higher than in Roseville due to the higher median home values, a crucial factor for potential homebuyers.
Sales Tax
Sales tax in Central Contra Costa is slightly higher than Roseville due to additional city taxes imposed. However, California's statewide sales tax applies evenly across both areas.
Income
Type
Central Contra Costa
Roseville
Estimated median household income
$127,452
$107,714
Estimated per capita income
$68,702
$49,304
Cost of living index (U.S. average is 100)
139.1
102.6
If you make $50,000 in Roseville, you will have to make $67,788 in Central Contra Costa to maintain the same standard of living.
Geographical Conditions
Central Contra Costa features varying landscapes, including rolling hills, urban areas, and coastlines. Roseville is relatively flat in comparison, situated in the Sacramento Valley, offering access to various natural attractions and outdoor activities.
Geographical information
Type
Central Contra Costa
Roseville
Land area
261.3 sq. miles
30.5 sq. miles
Population density
1,863.4 people per sq. mile
4,984.3 people per sq. mile
Relative area comparison
Central Contra Costa, CA Roseville, CA
Education
Central Contra Costa boasts high-ranking schools and important educational institutions like Saint Mary's College. Roseville, on the other hand, is home to quality schools too, and is in proximity to Sacramento’s higher education institutions like California State University, Sacramento. These educational opportunities can greatly influence families and students considering relocation.
The work and economic opportunities vary between the two regions. Central Contra Costa has a robust economy fueled by healthcare, retail, and public administration sectors. Conversely, Roseville experiences a more diverse economy with strengths in healthcare, retail trade, and professional, scientific, and technical services.
Biggest Employers
In Central Contra Costa, major employers include John Muir Health, Kaiser Permanente, and Contra Costa County. Roseville houses large employers like Hewlett Packard, Kaiser Permanente, and Sutter Roseville Medical Center, positively influencing the employment landscape in each region.
In Central Contra Costa (Contra Costa County), 66.2% voted for Democrats and 31.1% for Republicans in 2012 Presidential Election. In Roseville (Placer County), 38.9% voted for Democrats and 58.2% for Republicans.
Elections
Type
Democrats
Republicans
Other
Year
Central Contra Costa
Roseville
Central Contra Costa
Roseville
Central Contra Costa
Roseville
2020
71.8%
45.5%
26.4%
52.2%
1.8%
2.3%
2016
67.5%
39.6%
24.5%
51.2%
8.0%
9.2%
2012
66.2%
38.9%
31.1%
58.2%
2.7%
2.9%
2008
68.0%
43.4%
30.2%
54.7%
1.8%
2.0%
2004
62.6%
36.4%
36.7%
62.9%
0.7%
0.6%
2000
59.0%
36.1%
37.2%
59.4%
3.8%
4.5%
1996
55.7%
37.0%
35.2%
52.7%
9.1%
10.2%
Breakdown of population affiliated with a religious congregation
Type
Adherents
Congregations
Religion
Central Contra Costa
Roseville
Central Contra Costa
Roseville
CATHOLIC CHURCH
21.8%
14.7%
5.2%
4.7%
SOUTHERN BAPTIST CONVENTION
1.3%
0.5%
10.0%
6.3%
MUSLIM ESTIMATE
1.0%
0.0%
1.4%
0.0%
EPISCOPAL CHURCH
0.5%
0.3%
2.3%
2.0%
EVANGELICAL LUTHERAN CHURCH IN AMERICA
0.5%
0.6%
2.0%
2.4%
SEVENTH DAY ADVENTIST CHURCH
0.3%
0.7%
1.5%
3.6%
EVANGELICAL PRESBYTERIAN CHURCH
0.1%
0.4%
0.3%
0.4%
NORTH AMERICAN BAPTIST CONFERENCE
0.0%
0.4%
0.0%
2.4%
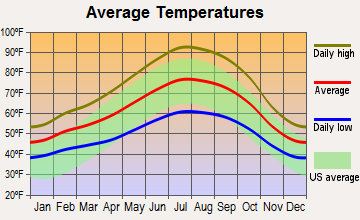
Weather
Climate in both regions is fairly similar due to their geographical proximity. They experience Mediterranean climates, with Central Contra Costa being somewhat warmer during summer. Tourists visiting both areas will enjoy mild winters and warm, dry summers, which might be a determining factor for those particularly sensetive to weather conditions.
Weather and climate
Type
Central Contra Costa
Roseville
Temperature - Average
59.1°F
61.8°F
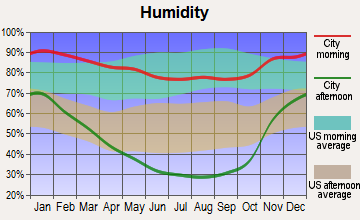
Humidity - Average morning or afternoon humidity
82.2%
66.8%
Humidity - Differences between morning and afternoon humidity
29.3%
57.9%
Humidity - Maximum monthly morning or afternoon humidity
88.1%
87%
Humidity - Minimum monthly morning or afternoon humidity
58.8%
29.1%
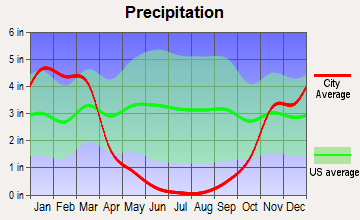
Precipitation - Yearly average
21.8 in
24.7 in
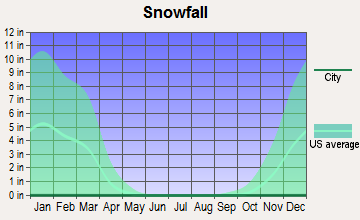
Snowfall - Yearly average
0 in
0 in
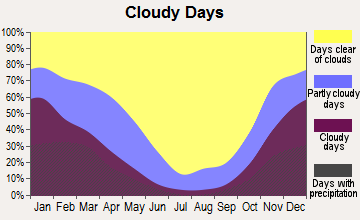
Clouds - Number of days clear of clouds
27.7%
31.5%
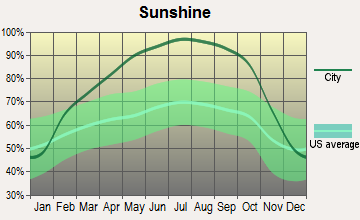
Sunshine amount - Average
73.3%
83.6%
Sunshine amount - Differences during a year
22.4%
51.9%
Sunshine amount - Maximum monthly
77.2%
96.9%
Sunshine amount - Minimum monthly
54.7%
45%
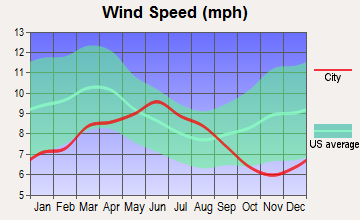
Wind speed - Average
11.1 mph
6.9 mph
Average climate in Central Contra Costa, California
Average climate in Roseville, California
Air pollution
Type
AQI
CO
NO2
OZONE
PB
PM10
PM25
SO2
Year
Central Contra Costa
Roseville
Central Contra Costa
Roseville
Central Contra Costa
Roseville
Central Contra Costa
Roseville
Central Contra Costa
Roseville
Roseville
Central Contra Costa
Roseville
Central Contra Costa
Roseville
2018
105
135
0.32
0.37
6.9
7.7
22.1
26.9
0.012
0.002
22.5
N/A
13.3
11.1
0.6
N/A
2017
102
115
0.30
0.33
7.0
7.9
25.9
27.9
0.008
0.002
15.8
N/A
11.9
7.1
0.7
N/A
2016
86
107
0.28
0.46
6.5
8.1
25.2
27.3
0.005
0.002
15.1
N/A
6.5
8.2
0.8
N/A
2015
94
115
0.34
0.29
7.6
8.6
25.8
27.8
0.004
0.002
17.0
N/A
8.8
10.1
0.5
N/A
2014
95
110
0.35
0.28
7.8
8.6
25.2
27.8
0.005
0.002
14.5
N/A
6.9
10.5
0.5
N/A
2013
93
106
0.34
0.30
9.3
10.2
21.5
25.8
0.004
0.002
21.0
N/A
7.8
10.9
0.5
N/A
2012
93
110
0.32
0.31
8.5
10.2
25.2
28.4
0.003
0.002
15.1
N/A
8.3
9.5
0.3
N/A
2011
99
110
0.35
0.36
9.0
11.0
23.0
27.2
0.003
0.002
17.5
N/A
9.8
10.9
0.6
N/A
2010
93
109
0.31
0.31
8.6
9.9
23.2
25.5
0.014
N/A
15.9
N/A
8.5
11.0
0.5
0.5
2009
104
118
0.31
0.37
9.5
10.4
23.7
26.1
0.006
0.003
18.5
N/A
10.3
10.7
0.6
0.5
2008
120
130
0.36
0.38
10.2
12.3
26.1
27.0
0.006
N/A
22.6
N/A
12.1
13.9
0.8
0.5
2007
104
129
0.36
0.40
10.7
12.5
24.1
27.4
0.006
0.005
19.5
N/A
9.7
12.2
0.7
0.6
2006
109
132
0.39
0.46
10.9
13.4
26.0
27.3
N/A
N/A
22.9
N/A
11.1
13.5
0.8
0.5
2005
104
127
0.43
0.31
11.6
13.5
22.7
21.7
N/A
N/A
20.0
N/A
10.4
14.6
1.0
0.6
2004
112
128
0.46
0.32
12.4
12.8
22.6
24.8
0.004
N/A
22.1
N/A
11.9
14.6
1.1
0.6
2003
84
111
0.51
0.36
13.4
14.1
23.1
25.9
N/A
N/A
19.3
N/A
N/A
N/A
0.7
0.9
2002
88
114
0.51
0.40
14.7
15.9
23.3
27.7
0.008
0.004
23.2
N/A
N/A
N/A
0.9
1.5
2001
90
116
0.56
0.38
15.4
14.7
22.1
26.4
0.008
0.004
18.2
N/A
N/A
N/A
1.2
1.4
2000
95
118
0.67
0.42
15.9
16.5
20.8
24.2
0.013
0.004
17.7
N/A
N/A
N/A
1.6
1.4
Natural disasters
Type
Central Contra Costa
Roseville
Tornado activity compared to U.S. average
9.4%
7.8%
Earthquake activity compared to U.S. average
7,786.2%
7,686.4%
Natural disasters compared to U.S. average
18%
17%
Transportation
Public transit in Central Contra Costa is served primarily by BART and County Connection. In contrast, Roseville Transit, Placer County Transit, and Sacramento Regional Transit offer comprehensive services to Roseville residents. Commuting times in both areas are similar, with slight advantages in certain zones.
Transport
Type
Central Contra Costa
Roseville
Amtrak stations
0
1
Amtrak stations nearby
3
3
FAA registered aircraft
0
89
FAA registered aircraft manufacturers and dealers
0
2
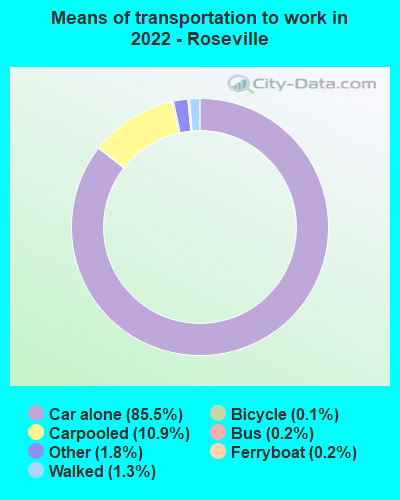
Means of transportation to work
Type
Central Contra Costa
Roseville
Bicycle
0.5%
0.3%
Bus
1%
0.5%
Carpooled
9.9%
7.9%
Car alone
72.3%
88.8%
Motorcycle
0.2%
0.3%
Railroad
0.8%
0.1%
Streetcar
0.1%
0.1%
Subway
7.7%
0%
Walked
1.5%
0.9%
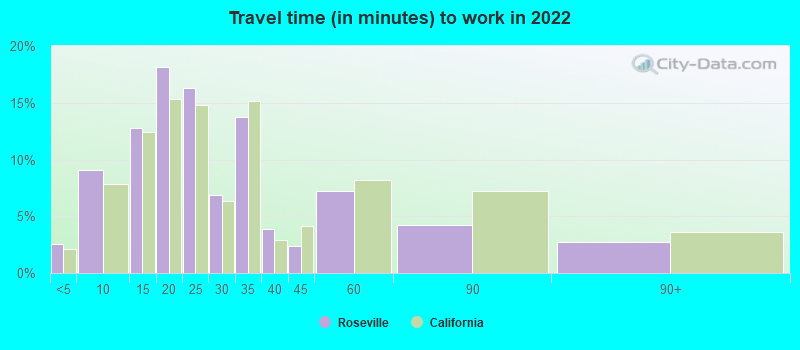
Average travel time to work
Type
Central Contra Costa
Roseville
Average
31.8 min
24.9 min
Real Estate
The real estate market signals higher prices in Central Contra Costa influenced by its location in the Bay Area. Roseville's market is more affordable, offering a variety of housing types from townhouses to larger family homes, which may be more appealing to those on a lesser budget.
Neighborhoods
Central Contra Costa has a mixture of urban and suburban neighborhoods with a variety of environments, from upper-middle-class areas to more affluent ones. Roseville offers diverse neighborhoods mostly composed of family-oriented suburban communities. Both areas provide good living environments depending on personal preferences.
Houses and residents
Type
Central Contra Costa
Roseville
Houses
183,777
59,392
Average household size (people)
2.5
2.6
Houses occupied
179,136 (97.5%)
57,569 (96.9%)
Houses occupied by owners
127,889 (71.4%)
39,453 (68.5%)
Houses occupied by renters
51,247 (28.6%)
18,116 (31.5%)
Median rent asked for vacant for-rent units
$2,527
$2,343
Median price asked for vacant for-sale houses and condos
$1,269,474
$556,233
Estimated median house or condo value
Over $1,000,000
$605,300
Median number of rooms in apartments
4.3
4.2
Median number of rooms in houses and condos
6.5
6.7
Renting percentage
30.3%
34.5%
Housing density (houses/condos per square mile)
703.4
1,948.8
Household income disparities
35.9%
39.2%
Housing units without a mortgage
20,208 (18.2%)
232 (0.8%)
Housing units with both a second mortgage and home equity loan
418 (0.4%)
1,679 (5.7%)
Housing units with a mortgage
90,899 (81.8%)
29,049 (99.2%)
Housing units with a home equity loan
13,612 (12.3%)
376 (1.3%)
Housing units with a second mortgage
13,614 (12.3%)
2,374 (8.1%)
Housing units lacking complete kitchen facilities
0.5%
2.1%
Housing units lacking complete plumbing facilities
Self-employed workers in own not incorporated business
22,217
5,490
State government workers
6,705
4,557
Unpaid family workers
617
216
Industries and Occupations
Main industries in Central Contra Costa include health care, retail, and education, offering a range of occupations. In contrast, Roseville's economy is diverse with health care, retail, and tech sectors being prominent, providing varied opportunities for professionals.
Both areas offer high-quality healthcare services. In Central Contra Costa, John Muir Health and Kaiser Permanente dominate, while Roseville is served by Kaiser Permanente and Sutter Roseville Medical Center. Access to good healthcare may be a major deciding factor for potential residents over different age demographics.
Health (county statistics)
Type
Central Contra Costa
Roseville
General health status score of residents in this county from 1 (poor) to 5 (excellent)
Both regions have continually invested in infrastructure developments. Central Contra Costa offers a robust road and public transit system and has been improving its utilities infrastructure. Roseville also benefits from a robust transportation system and is known for its developed water and electric utility infrastructure.
Infrastructure
Type
Central Contra Costa
Roseville
TV stations
24
24
Culture and Food
Central Contra Costa has a diverse cultural scene reflected in its food offerings from a range of cuisines. Similarly, Roseville prides itself on its cultural diversity and assortment of dining options that cater to a wide array of palates.
Sports Teams
Roseville residents largely support Sacramento-based sports teams, including the Sacramento Kings and Sacramento Republic FC. Central Contra Costa, however, falls within the catchment area for Bay Area teams like Golden State Warriors, San Franscisco 49ers and Giants.
 Central Contra Costa, CA
 Roseville, CA