Indianapolis, Indiana and Birmingham, Alabama are two diverse and vibrant cities in the United States with distinct living conditions. Indianapolis, the capital city of Indiana, is famed for its sporting events and auto racing, while Birmingham, Alabama's most populous city, has a rich civil rights history and booming medical sector. The intricacies of each city, ranging from cost of living and taxes to real estate development and cultural heritage, create a unique lifestyle for residents and visitors alike.
Distance between
Indianapolis, IN and
Birmingham, AL : 434.5 miles
Indianapolis's population is larger by 346%. Its population has grown by 100,169 people (12.8%) since 2000. The population of Birmingham has decreased by 45,245 people (18.6%) during that time.
Both Indianapolis and Birmingham face challenges with crime. As per FBI's Uniform Crime Reporting data, both cities have crime rates higher than the national average. Birmingham's crime rate, however, is significantly higher, making Indianapolis relatively safer. It's important for potential residents or tourists to stay informed about areas of high crime in both cities.
City-data.com crime index counts serious crimes and violent crime more heavily. It adjusts for the number of visitors and daily workers commuting into cities. (higher means more crime, U.S. average = 301.1)
City-data.com crime index counts serious crimes and violent crime more heavily. It adjusts for the number of visitors and daily workers commuting into cities. (higher means more crime, U.S. average = 301.1)
Sex Offenders
According to our data, there are 81 registered sex offenders living in Indianapolis and 660 registered sex offenders living in . The ratio of residents to sex offenders in Indianapolis is 10,525 to 1; the ratio in Birmingham is 322 to 1. The number of registered sex offenders compared to the number of residents is a lot smaller in Indianapolis than in Birmingham.
Cost of Living
The cost of living in Birmingham is generally lower than in Indianapolis. Housing costs are significantly lower in Birmingham, but health care costs tend to be higher.
Income Tax
Indiana has a flat state income tax rate of 3.23%, plus a county tax that can go up to 3.38% in Indianapolis. Alabama’s state income tax ranges from 2% to 5%, and Birmingham imposes an additional 1% tax.
Property Tax
Indianapolis typically has lower property taxes compared to Birmingham.
Sales Tax
Indianapolis has a combined city and state sales tax rate of 7%. Birmingham's combined city and state sales tax rate is slightly higher at 10%.
Income
Type
Indianapolis
Birmingham
Estimated median household income
$58,479
$36,614
Estimated per capita income
$32,792
$27,211
Cost of living index (U.S. average is 100)
87.7
87.1
If you make $50,000 in Birmingham, you will have to make $50,344 in Indianapolis to maintain the same standard of living.
Geographical Conditions
Indianapolis is generally flat with no major bodies of water nearby. Birmingham, on the other hand, is located in the Appalachian Mountains foothills and offers more varied topography.
Both cities offer quality education. Indianapolis is home to several notable educational institutions including Butler University and Indiana University – Purdue University. Birmingham also boasts great educational institutions such as the University of Alabama at Birmingham.
While the economies of both cities are diverse, Indianapolis' economy is more service sector-oriented, with a focus on education, health care, and finance. Birmingham's economy, however, leans more towards healthcare, insurance, and manufacturing.
Biggest Employers
The biggest employers in Indianapolis include Indiana University Health, Anthem Inc., and St. Vincent Health. In Birmingham, the University of Alabama at Birmingham is the largest employer, followed by Regions Bank and Children’s of Alabama.
There were 1,221 building permits issued in Indianapolis in 2012 (704 more than in 2011) compared to 90 building permits issued in Birmingham in 2012 (31 less than in 2011).
In Indianapolis (Marion County), 60.1% voted for Democrats and 37.9% for Republicans in 2012 Presidential Election. In Birmingham (Jefferson County), 52.7% voted for Democrats and 46.7% for Republicans.
Elections
Type
Democrats
Republicans
Other
Year
Indianapolis
Birmingham
Indianapolis
Birmingham
Indianapolis
Birmingham
2020
63.7%
55.8%
34.5%
42.6%
1.9%
1.6%
2016
58.2%
51.6%
35.6%
44.3%
6.2%
4.1%
2012
60.1%
52.7%
37.9%
46.7%
2.0%
0.5%
2008
63.8%
52.6%
35.4%
47.4%
0.8%
0.0%
2004
50.6%
45.3%
48.7%
54.3%
0.7%
0.3%
2000
48.0%
47.6%
49.3%
50.8%
2.8%
1.6%
1996
44.6%
46.1%
47.8%
50.2%
7.7%
3.7%
Breakdown of population affiliated with a religious congregation
Type
Adherents
Congregations
Religion
Indianapolis
Birmingham
Indianapolis
Birmingham
CATHOLIC CHURCH
11.1%
8.4%
4.6%
2.7%
SOUTHERN BAPTIST CONVENTION
1.6%
28.2%
5.7%
22.7%
AMERICAN BAPTIST CHURCHES IN THE USA
1.2%
0.0%
3.4%
0.0%
LUTHERAN CHURCH
0.8%
0.3%
1.5%
0.9%
EVANGELICAL LUTHERAN CHURCH IN AMERICA
0.5%
0.1%
1.6%
0.3%
SEVENTH DAY ADVENTIST CHURCH
0.5%
0.6%
1.6%
1.2%
EPISCOPAL CHURCH
0.4%
2.1%
1.1%
1.4%
MUSLIM ESTIMATE
0.3%
0.5%
1.1%
0.6%
PRESBYTERIAN CHURCH IN AMERICA
0.1%
1.4%
0.5%
1.1%
Weather
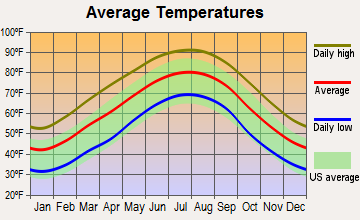
The weather in Indianapolis is characterized by hot, wet summers and potentially harsh winters. It experiences a humid continental climate. On the other hand, Birmingham has a humid subtropical climate, with hot summers and mild winters. It's more prone to severe weather like tornadoes.
Weather and climate
Type
Indianapolis
Birmingham
Temperature - Average
52.1°F
62.1°F
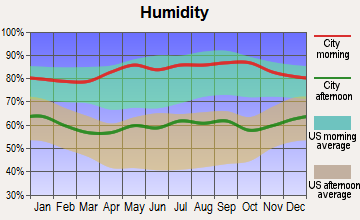
Humidity - Average morning or afternoon humidity
77%
75.5%
Humidity - Differences between morning and afternoon humidity
31%
38%
Humidity - Maximum monthly morning or afternoon humidity
86%
88%
Humidity - Minimum monthly morning or afternoon humidity
55%
50%
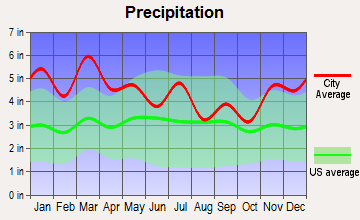
Precipitation - Yearly average
40.6 in
53.2 in
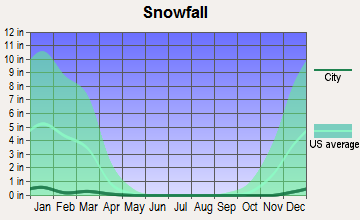
Snowfall - Yearly average
51 in
3.4 in
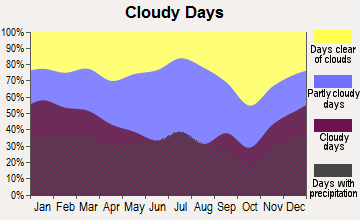
Clouds - Number of days clear of clouds
14.7%
16.4%
Sunshine amount - Average
56.2%
63.4%
Sunshine amount - Differences during a year
33%
21%
Sunshine amount - Maximum monthly
65%
67%
Sunshine amount - Minimum monthly
32%
46%
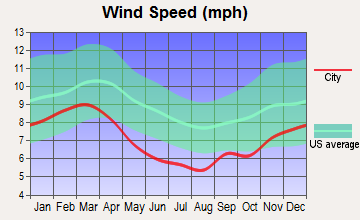
Wind speed - Average
10.3 mph
6.7 mph
Average climate in Indianapolis, Indiana
Average climate in Birmingham, Alabama
Air pollution
Type
AQI
CO
NO2
OZONE
PB
PM10
PM25
SO2
Year
Indianapolis
Birmingham
Indianapolis
Birmingham
Indianapolis
Birmingham
Indianapolis
Birmingham
Indianapolis
Indianapolis
Birmingham
Indianapolis
Birmingham
Indianapolis
Birmingham
2018
94
83
0.58
0.29
13.2
9.6
23.1
26.2
N/A
N/A
18.2
18.9
10.4
10.5
0.3
2.3
2017
87
91
0.82
0.35
12.4
10.0
23.0
24.2
N/A
N/A
17.6
18.9
10.1
11.0
0.4
2.7
2016
91
87
0.62
0.34
13.0
12.1
22.5
27.6
N/A
N/A
18.0
19.7
9.9
10.4
0.4
1.1
2015
89
84
0.73
0.33
14.9
10.9
22.9
24.5
N/A
N/A
19.7
19.3
9.9
10.6
1.1
1.1
2014
100
84
0.62
0.29
16.1
11.7
25.1
24.1
N/A
N/A
20.6
21.3
12.1
11.4
3.2
1.1
2013
94
82
0.69
0.22
11.5
N/A
26.3
21.4
N/A
N/A
19.9
19.2
12.8
10.9
2.6
1.2
2012
103
92
0.65
0.28
10.4
N/A
25.7
24.4
N/A
N/A
20.8
21.8
12.9
11.5
2.9
1.6
2011
105
104
0.68
0.33
11.3
N/A
22.9
24.9
N/A
N/A
N/A
24.3
16.3
13.0
2.4
1.9
2010
101
101
0.54
0.24
12.7
N/A
21.6
24.1
N/A
N/A
N/A
25.6
15.9
12.9
3.3
N/A
2009
97
94
0.73
0.51
11.4
N/A
23.2
21.5
N/A
N/A
N/A
25.1
13.8
12.5
1.9
N/A
2008
91
105
0.62
0.72
11.5
N/A
N/A
23.9
0.010
N/A
N/A
32.2
13.2
15.2
3.0
N/A
2007
103
124
0.69
0.82
13.1
N/A
N/A
24.6
0.011
N/A
N/A
41.6
14.9
17.5
3.6
N/A
2006
95
131
0.59
1.16
14.5
N/A
N/A
24.0
0.009
N/A
N/A
33.2
14.5
18.0
3.6
N/A
2005
121
131
0.65
0.95
15.2
N/A
N/A
21.8
0.014
N/A
N/A
38.0
18.0
18.4
4.3
N/A
2004
104
116
0.62
0.68
15.8
N/A
N/A
19.1
0.010
N/A
N/A
39.7
15.1
17.1
4.6
N/A
2003
113
123
0.67
0.53
16.6
N/A
N/A
18.2
0.010
N/A
N/A
42.1
15.8
16.1
4.2
N/A
2002
125
133
0.76
0.70
17.4
N/A
N/A
21.2
0.009
N/A
N/A
37.1
16.8
17.2
3.9
N/A
2001
105
175
0.81
1.69
16.6
N/A
N/A
19.6
0.031
N/A
N/A
32.3
16.3
N/A
3.8
N/A
2000
98
136
0.87
1.35
17.3
N/A
N/A
23.3
N/A
N/A
N/A
38.3
N/A
N/A
4.5
N/A
Natural disasters
Type
Indianapolis
Birmingham
Tornado activity compared to U.S. average
226.7%
252.3%
Earthquake activity compared to U.S. average
179.6%
229.7%
Natural disasters compared to U.S. average
16%
32%
Transportation
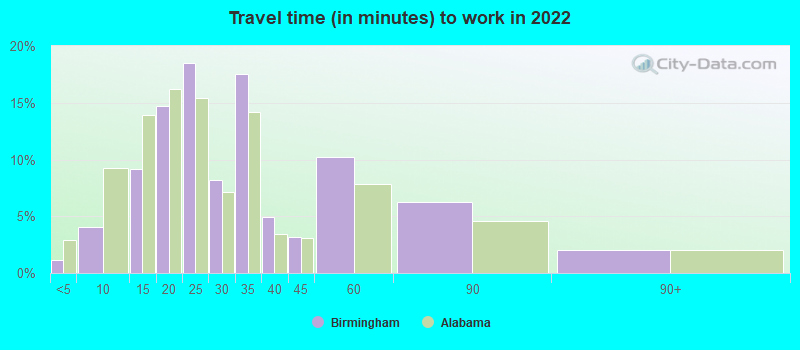
Both Indianapolis and Birmingham have public transit systems, but Indianapolis's is more extensive featuring buses and a bike-sharing program. Commute times are similar, averaging around 23-24 minutes.
Transport
Type
Indianapolis
Birmingham
Amtrak stations
1
1
Amtrak stations nearby
1
1
FAA registered aircraft
739
358
FAA registered aircraft manufacturers and dealers
18
4
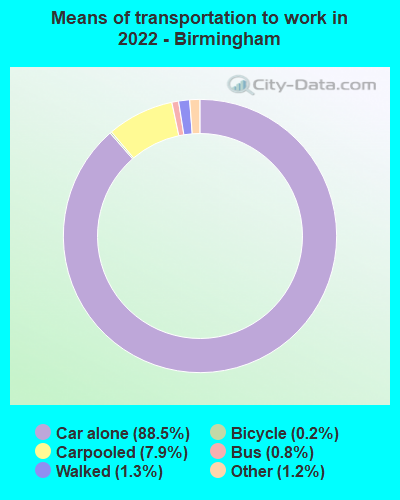
Means of transportation to work
Type
Indianapolis
Birmingham
Bicycle
0.5%
0.2%
Bus
1.2%
0.4%
Carpooled
8.5%
7.4%
Car alone
87.3%
89.4%
Taxicab
0.1%
0.2%
Walked
1.6%
1.1%
Average travel time to work
Type
Indianapolis
Birmingham
Average
28.1 min
29.2 min
Other means
22.5 min
22.9 min
Public transportation
40.2 min
47 min
Private vehicle occupancy
Type
Indianapolis
Birmingham
Average
1.2
1.2
Drove alone
88.2%
90.6%
In 2 person carpool
9.4%
7.4%
In 3 person carpool
1.3%
0.5%
In 4 person carpool
0.5%
0.6%
In 5-6 person carpool
0.4%
0.3%
In 7+ person carpool
0.1%
0.6%
How many people usually rode to work in the car, truck or van.
Real Estate
Real estate in Birmingham is typically cheaper than in Indianapolis. However, both cities offer a range of options from downtown apartments to suburban homes.
Neighborhoods
Indianapolis has increasingly diverse neighborhoods from the historic charm of Lockerbie Square to the modern elegance of the Wholesale District. Birmingham has its own unique neighborhoods like Five Points South, known for its nightlife, and the historic district of Red Mountain.
Houses and residents
Type
Indianapolis
Birmingham
Houses
399,820
108,533
Average household size (people)
2.4
2.3
Median year apartment built
1977
1973
Median year house/condo built
1971
1959
Length of stay in the house since moving in
13 years
17.5 years
Houses occupied
358,150 (89.6%)
87,570 (80.7%)
Houses occupied by owners
201,149 (56.2%)
40,665 (46.4%)
Houses occupied by renters
157,001 (43.8%)
46,905 (53.6%)
Median rent asked for vacant for-rent units
$876.58
$620.56
Median monthly housing costs
$980
$820
Median price asked for vacant for-sale houses and condos
$283,027
$51,535
Estimated median house or condo value
$188,700
$117,600
Median numbers of rooms
5.5
5.2
Median number of rooms in apartments
4.3
4.5
Median number of rooms in houses and condos
6.5
6.2
Median house price - detached houses
$231,490
$178,184
Median house price - in 2-unit structures
$257,253
$97,076
Median house price - in 3-to-4-unit structures
$240,688
$231,741
Median house price - in 5 or more unit structures
$247,275
$220,662
Median house price - mobile homes
$58,413
$47,467
Median house price - Townhouses or other attached units
$222,424
$189,730
Median house price - All housing units
$229,666
$184,367
Median house age
48
57
Renting percentage
44.2%
50.7%
Housing density (houses/condos per square mile)
1,106.1
724
House value disparities
36.1%
42.2%
Household income disparities
44.4%
50.2%
Median household income for houses/condes with a mortgage
$86,008
$63,812
Median household income for apartments without a mortgage
$61,922
$42,701
Housing units without a mortgage
4,552 (3.2%)
652 (3.2%)
Housing units with both a second mortgage and home equity loan
9,787 (6.8%)
837 (4%)
Housing units with a mortgage
138,622 (96.8%)
20,029 (96.8%)
Housing units with a home equity loan
271 (0.2%)
0 (0%)
Housing units with a second mortgage
12,987 (9.1%)
1,439 (7%)
House/condo owner moved in on average (years ago)
11
18
House/condo renter moved in on average (years ago)
1
1
Housing units lacking complete kitchen facilities
3.4%
5.3%
Housing units lacking complete plumbing facilities
1.1%
4.4%
Housing units in structures
Housing units in structures
Indianapolis
Birmingham
One, detached
59.0%
59.4%
One, attached
9.2%
2.1%
Two
2.5%
1.8%
3 or 4
6.2%
6.3%
5 to 9
7.7%
9.3%
10 to 19
6.3%
8.0%
20 to 49
3.1%
6.3%
50 or more
5.0%
6.1%
Mobile homes
1.0%
0.7%
Median real estate property taxes paid for housing units
Self-employed workers in own not incorporated business
17,131
4,375
State government workers
15,502
5,819
Unpaid family workers
1,601
158
Industries and Occupations
Indianapolis' leading industries are healthcare and social assistance, retail trade, and manufacturing. Birmingham leans towards healthcare, retail trade, and education services.
Both cities have top-rated healthcare facilities, but Birmingham’s medical sector has a strong reputation with the UAB Health System being one of the top medical institutions in the nation.
Health (county statistics)
Type
Indianapolis
Birmingham
General health status score of residents in this county from 1 (poor) to 5 (excellent)
Indianapolis boasts infrastructure befitting a major U.S. city, with downtown skyscrapers, a mass transit system, and a major airport. It's also dubbed the “Crossroads of America” for its prolific interstate highways. Birmingham's infrastructure, while not as expansive, features a mix of modern and historic structures, an extensive local highway system, and Birmingham-Shuttlesworth International Airport.
Infrastructure
Type
Indianapolis
Birmingham
Hospitals
76
34
TV stations
19
17
Arenas or stadiums
3
5
Bank branches located here
259
124
Bank institutions located here
27
24
Main business address for public companies
28
31
Drinking water stations with no reported violations in the past
1
0
Drinking water stations with reported violations in the past
HMDA - Conventional home purchase loans - Applications denied
Year
Indianapolis
Birmingham
1999
3,358
834
2000
3,562
835
2001
2,649
699
2002
1,915
548
2003
2,519
670
2004
3,702
928
2005
6,057
1,149
2006
5,811
1,235
2007
3,456
914
2008
1,247
426
2009
565
141
Culture and Food
Both cities have a rich cultural scene. Indianapolis offers a variety of museums, the famous Indianapolis 500 motor race, and a thriving restaurant scene. Birmingham is known for its civil rights history, jazz music, and southern cuisine.
Sports Teams
Indianapolis is home to several professional sports teams including the NFL’s Indianapolis Colts and NBA’s Indiana Pacers. Birmingham does not have any major league teams but hosts minor league baseball and college sports.


 Indianapolis, IN and
  Birmingham, AL : 434.5 miles