When comparing life in Long Beach, CA, and Newhall, CA, several factors need to be explored - crime, weather, cost of living, education, economy, infrastructural facilities, industries, employment sectors, real estate, neighborhoods, commuting, taxation, cultural experiences, sports, geography, and healthcare. Each city possesses unique aspects that make it appealing to different individuals. Both cities have unique features that make them stand out, with Long Beach offering a more bustling urban lifestyle, and Newhall presenting a quieter suburban experience.
Long Beach has a fairly high crime rate compared to national averages, but it's important to note that this varies across neighborhoods. On the other hand, Newhall, being a smaller town, generally enjoys a lower crime rate compared to Long Beach. For people considering relocation or for travelers, understanding the crime statistics of the neighborhood they intend to live or visit will offer a better perspective.
Cost of Living
The cost of living in Long Beach is generally higher than that in Newhall, particularly regarding housing costs. However, other living costs like food, healthcare, utilities, and transportation also play a big role, and while still being more expensive in Long Beach, the gap is less dramatic.
Income Tax
In terms of state income tax, both Long Beach and Newhall fall under California's income tax guidelines. The rates are progressive, ranging from 1% to up to 13.3% for the highest earners.
Property Tax
California's average property tax rate is 0.73%. Despite this, actual rates can vary between cities and counties. This applies to both Long Beach and Newhall, where local assessments influence property tax.
Sales Tax
In terms of sales tax, both Long Beach and Newhall (Santa Clarita) are subject to California's base sales tax rate of 7.25%. However, combined with local taxes, the total sales tax in Long Beach is higher, at 10.25%, compared to 9.5% in Newhall.
Income
Type
Long Beach
Newhall
Estimated median household income
$73,905
$122,713
Estimated per capita income
$37,217
$50,120
Cost of living index (U.S. average is 100)
142
150.6
If you make $50,000 in Long Beach, you will have to make $53,028 in Newhall to maintain the same standard of living.
Geographical Conditions
Long Beach is a coastal city, with beaches and marinas defining much of its geography. In contrast, Newhall features more sub-urbanized hilly terrain, located within the Santa Clarita Valley.
Geographical information
Type
Long Beach
Newhall
Land area
50.4 sq. miles
496.7 sq. miles
Population density
9,041.5 people per sq. mile
388.5 people per sq. mile
Elevation
29 feet
1,272 feet
Relative area comparison
Long Beach, CA Newhall, CA
Education
Long Beach boasts several higher education institutions, including California State University, Long Beach. On the other hand, Newhall may not have as many institutions, but it's served by the highly rated William S. Hart Union High School District, highlighting Newhall's family-friendly character.
Long Beach holds a diverse economy with industries like healthcare, education, manufacturing, and trade leading the way. In contrast, Newhall's economy is rooted in retail, healthcare, and education but its smaller population gives it a more suburban business feel.
Biggest Employers
In Long Beach, some of the largest employers include Long Beach Unified School District, City of Long Beach, and The Boeing Company. Newhall boasts employers like Six Flags Magic Mountain and Henry Mayo Newhall Hospital.
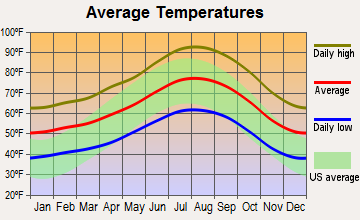
Weather
In terms of weather, both cities enjoy a Mediterranean climate, typical of Southern California, with warm summers and mild winters. However, Long Beach’s coastal location offers more moderate temperatures whereas Newhall, being further inland, experiences slightly hotter summers and colder winters.
Weather and climate
Type
Long Beach
Newhall
Temperature - Average
65.3°F
63°F
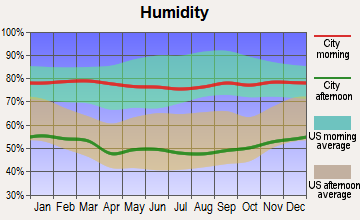
Humidity - Average morning or afternoon humidity
70.4%
63.9%
Humidity - Differences between morning and afternoon humidity
27%
18.6%
Humidity - Maximum monthly morning or afternoon humidity
79%
69.3%
Humidity - Minimum monthly morning or afternoon humidity
52%
50.7%
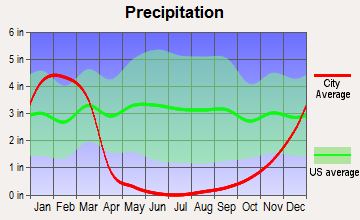
Precipitation - Yearly average
13.1 in
18.2 in
Snowfall - Yearly average
0 in
0 in
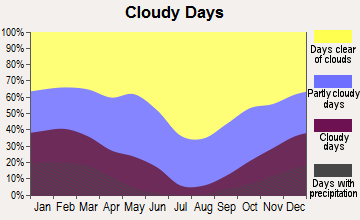
Clouds - Number of days clear of clouds
26.4%
27.8%
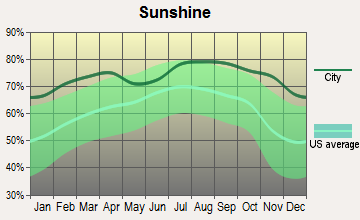
Sunshine amount - Average
78.4%
78.4%
Sunshine amount - Differences during a year
22%
21.9%
Sunshine amount - Maximum monthly
85%
84.9%
Sunshine amount - Minimum monthly
63%
63%
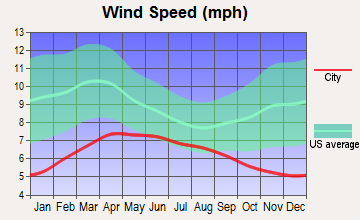
Wind speed - Average
6.1 mph
3.1 mph
Average climate in Long Beach, California
Average climate in Newhall, California
Air pollution
Type
AQI
CO
NO2
OZONE
PB
PM10
PM25
SO2
Year
Long Beach
Newhall
Long Beach
Newhall
Long Beach
Newhall
Long Beach
Newhall
Long Beach
Newhall
Long Beach
Newhall
Long Beach
Newhall
Long Beach
Newhall
2018
124
130
0.37
0.24
17.2
11.0
22.1
31.8
0.008
0.002
27.5
24.4
13.5
10.7
0.7
N/A
2017
122
129
0.36
0.27
18.1
10.7
23.2
33.7
0.007
0.002
26.7
25.0
14.5
10.6
0.8
N/A
2016
115
117
0.36
0.23
18.5
10.2
21.9
33.2
0.007
0.002
24.1
23.8
11.6
9.7
0.9
N/A
2015
111
123
0.38
0.21
19.9
11.9
22.5
33.7
0.005
0.001
25.0
21.8
13.9
9.1
0.9
N/A
2014
127
133
0.50
0.24
20.3
12.8
22.0
34.4
0.007
0.003
26.7
25.4
14.3
10.7
1.3
N/A
2013
126
134
0.48
0.24
20.0
14.5
24.7
34.6
0.005
0.004
32.3
24.8
14.6
10.0
1.0
0.3
2012
132
138
0.48
0.23
19.3
13.8
24.4
33.0
0.004
0.004
30.8
24.6
14.1
10.3
0.6
0.5
2011
119
135
0.43
0.25
20.2
13.9
23.4
31.7
0.006
0.006
28.4
24.3
15.6
13.0
1.2
0.5
2010
115
126
0.38
0.22
20.8
14.7
22.7
29.6
0.011
0.005
24.1
21.5
11.9
13.8
0.7
0.8
2009
132
147
0.50
0.26
21.0
15.5
22.0
30.8
0.008
0.006
27.7
N/A
13.1
14.6
1.1
0.5
2008
124
143
0.53
0.30
20.8
16.9
23.2
32.1
0.008
N/A
27.2
31.7
21.6
18.6
1.0
0.8
2007
109
117
0.60
0.35
20.3
19.9
21.1
29.5
0.010
0.008
N/A
N/A
N/A
N/A
1.4
1.0
2006
119
120
0.76
0.26
21.4
18.6
19.9
30.9
0.005
N/A
N/A
N/A
N/A
N/A
1.7
0.6
2005
108
127
0.74
0.35
24.3
19.5
20.5
29.5
0.011
N/A
N/A
N/A
N/A
N/A
2.7
1.6
2004
125
135
0.56
0.45
28.0
20.7
22.9
31.4
0.012
N/A
N/A
N/A
N/A
N/A
2.0
2.4
2003
130
142
0.83
0.50
28.1
21.6
22.4
31.9
0.032
N/A
N/A
N/A
N/A
N/A
1.1
1.3
2002
120
153
0.90
0.60
29.6
20.1
22.2
30.9
0.011
0.010
N/A
N/A
N/A
N/A
2.8
2.0
2001
124
133
0.81
0.73
30.3
23.0
21.5
26.8
0.011
0.011
N/A
N/A
N/A
N/A
3.3
0.7
2000
142
140
0.71
0.80
31.5
24.9
19.6
26.0
0.018
0.012
N/A
N/A
N/A
N/A
2.0
0.5
Natural disasters
Type
Long Beach
Newhall
Tornado activity compared to U.S. average
18.3%
11.9%
Earthquake activity compared to U.S. average
6,875.1%
7,354.1%
Natural disasters compared to U.S. average
57%
57%
Transportation
Long Beach has an extensive public transportation system including buses, a bike share program, and access to LA Metro's Blue Line. Newhall offers public transit through Santa Clarita Transit but being a smaller town, a personal vehicle is often more convenient.
Transport
Type
Long Beach
Newhall
Amtrak stations
1
0
Amtrak stations nearby
3
3
FAA registered aircraft
312
20
FAA registered aircraft manufacturers and dealers
29
0
Means of transportation to work
Type
Long Beach
Newhall
Bicycle
0.5%
0.4%
Bus
3.3%
1.9%
Carpooled
9.8%
13.7%
Car alone
81.8%
78.1%
Motorcycle
0.2%
0.2%
Railroad
0%
0.8%
Subway
0.5%
0.1%
Walked
2.8%
1.3%
Average travel time to work
Type
Long Beach
Newhall
Average
30.7 min
34.2 min
Real Estate
Real estate in Long Beach is quite diverse, from high-rise apartments to single-family homes. Newhall offers a more suburban feel with primarily single-family homes. Relative to Long Beach, Newhall's real estate market is generally more affordable.
Neighborhoods
Long Beach is known for its diverse neighborhoods , such as Belmont Shore and Naples, each with their unique vibe. Newhall, being smaller, has a more homogeneous neighborhood structure but offers a friendly and community-oriented environment.
Houses and residents
Type
Long Beach
Newhall
Houses
179,856
64,094
Average household size (people)
2.8
3
Houses occupied
172,599 (96%)
61,472 (95.9%)
Houses occupied by owners
69,470 (40.2%)
45,056 (73.3%)
Houses occupied by renters
103,129 (59.8%)
16,416 (26.7%)
Median rent asked for vacant for-rent units
$1,057
$2,587
Median price asked for vacant for-sale houses and condos
$520,992
$1,138,428
Estimated median house or condo value
$693,600
$792,187
Median number of rooms in apartments
3.6
3.7
Median number of rooms in houses and condos
5.5
7.1
Renting percentage
58.4%
28.8%
Housing density (houses/condos per square mile)
3,565.7
129
Household income disparities
44.7%
34.9%
Housing units without a mortgage
394 (0.8%)
3,256 (8.5%)
Housing units with both a second mortgage and home equity loan
3,069 (6.2%)
166 (0.4%)
Housing units with a mortgage
49,321 (99.2%)
35,177 (91.5%)
Housing units with a home equity loan
48 (0.1%)
3,084 (8%)
Housing units with a second mortgage
3,709 (7.5%)
6,491 (16.9%)
Housing units lacking complete kitchen facilities
2.6%
0.5%
Housing units lacking complete plumbing facilities
Self-employed workers in own not incorporated business
18,532
6,940
State government workers
6,550
2,785
Unpaid family workers
178
293
Industries and Occupations
Long Beach is home to a large number of service-based industries, including healthcare and education, while its seaport lends to a significant trade sector. Newhall, however, is heavily grounded in retail and service-oriented sectors, offering jobs mainly in these areas.
Health Care
Healthcare in Long Beach is extensive with multiple hospitals and clinics, providing robust services. Newhall, while having fewer facilities due to its population and size, is served by the Henry Mayo Newhall Hospital and other clinics.
Long Beach has a well-developed infrastructure including multiple airports, seaports, hospitals, and schools. Newhall, while lacking this level of facilities, offers a smaller town infrastructure with accessible amenities.
Infrastructure
Type
Long Beach
Newhall
TV stations
5
6
Bank branches located here
67
4
Bank institutions located here
18
4
Schools
School facilities
Type
Long Beach
Newhall
Private elementary/middle schools
24
1
Private high schools
8
0
Public elementary/middle schools
61
6
Public high schools
14
1
Colleges/Universities
7
0
Culture and Food
Long Beach is a melting pot of cultures, reflected in a diverse culinary scene and numerous festivals. Newhall, while not as diverse, offers a homey feel with wine lounges, grills, and local gathering spots.
Sports Teams
Long Beach doesn't host any major league teams but it's a short drive to Los Angeles, home to the Dodgers (MLB), Lakers (NBA), and Rams (NFL). Newhall, due to its size, doesn’t host any professional teams but residents can also reach LA relatively easily for major sporting events.
 Long Beach, CA
 Newhall, CA