Long Beach and Perris Valley, both located in California, offer unique living experiences with a variety of attributes to consider. Differences in cost of living, safety, education and many other aspects draw attention to each location's uniqueness. While Long Beach, being a coastal city, is popular among tourists for its pleasant climate and beach-oriented activities, Perris Valley is known for its affordability and slower pace of life. Let's dig into the specifics.
When it comes to crime and safety, Long Beach, being a larger city, has a higher crime rate compared to the state average but is actively working to reduce it. On the other hand, Perris Valley, while having its own safety issues, generally experiences lower crime rates due to its smaller size and rural environment. Both cities have community-focused policing efforts but it is generally advised to research specific neighborhood safety before relocating.
Cost of Living
Long Beach, being closer to Los Angeles and with beachfront proximity, has a relatively high cost of living, which takes into account housing, health care, groceries, utilities and transportation. Perris Valley, on the other hand, is considerably more affordable with a lower cost of living. This makes Perris Valley an attractive place for families and individuals looking for budget-friendly living options.
Income Tax
In terms of income tax, both cities are subject to California's progressive income tax system. Income tax rates can range from 1% to 13.3% depending on taxable income levels.
Property Tax
Property tax rates in both cities are similar, based on California's standard 1% base rate. However, because property values in Long Beach are typically higher than in Perris Valley, the overall property tax payment may be higher in Long Beach.
Sales Tax
Both Long Beach and Perris Valley have higher sales taxes than the US average. Long Beach's sales tax is approximately 10.25% while Perris Valley enjoys a slightly lower rate of approximately 7.75%.
Income
Type
Long Beach
Perris Valley
Estimated median household income
$73,905
$71,187
Estimated per capita income
$37,217
$27,699
Cost of living index (U.S. average is 100)
142
85.6
If you make $50,000 in Perris Valley, you will have to make $82,944 in Long Beach to maintain the same standard of living.
Geographical Conditions
Long Beach, located on the Pacific coastline, features sandy beaches, marinas and a busy seaport. Perris Valley, situated inland, boasts natural features such as the Lake Perris State Recreation Area and various hiking trails.
Geographical information
Type
Long Beach
Perris Valley
Land area
50.4 sq. miles
276.5 sq. miles
Population density
9,041.5 people per sq. mile
689.3 people per sq. mile
Relative area comparison
Long Beach, CA Perris Valley, CA
Education
Long Beach is known for its strong education system, with the Long Beach Unified School District frequently receiving state and national recognition for its programs. The city also houses Long Beach City College and California State University, Long Beach. Perris Valley, while smaller, also provides quality education through the Val Verde Unified School District and is near Moreno Valley College.
Long Beach, with its diversified economy, offers job opportunities in healthcare, education, technology, and trade due to its busy seaport. Perris Valley's economy is more dependent on retail, healthcare and educational services, but also possesses a strong logistics and warehouse industry thanks to its strategic location.
Biggest Employers
In Long Beach, some of the biggest employers include Long Beach Unified School District, Long Beach Memorial Medical Center, and the City of Long Beach. Perris Valley's largest employers are Ross Stores Distribution Center, Val Verde Unified School District, and Lowe's Distribution Centre.
In Long Beach (Los Angeles County), 69.7% voted for Democrats and 27.8% for Republicans in 2012 Presidential Election. In Perris Valley (Riverside County), 49.6% voted for Democrats and 48.0% for Republicans.
Elections
Type
Democrats
Republicans
Other
Year
Long Beach
Perris Valley
Long Beach
Perris Valley
Long Beach
Perris Valley
2020
71.0%
53.0%
26.9%
45.0%
2.1%
2.0%
2016
72.0%
49.7%
22.5%
44.4%
5.5%
5.9%
2012
69.7%
49.6%
27.8%
48.0%
2.4%
2.4%
2008
69.2%
50.4%
28.8%
48.1%
1.9%
1.5%
2004
63.3%
41.3%
35.7%
58.2%
1.0%
0.6%
2000
63.6%
45.0%
32.4%
51.6%
4.0%
3.4%
1996
59.3%
43.0%
31.0%
45.6%
9.7%
11.3%
Breakdown of population affiliated with a religious congregation
Type
Adherents
Congregations
Religion
Long Beach
Perris Valley
Long Beach
Perris Valley
CATHOLIC CHURCH
36.1%
27.5%
4.7%
4.5%
SOUTHERN BAPTIST CONVENTION
1.0%
1.2%
9.0%
11.2%
MUSLIM ESTIMATE
0.7%
0.5%
1.0%
0.7%
AMERICAN BAPTIST CHURCHES IN THE USA
0.5%
0.0%
3.1%
0.7%
SEVENTH DAY ADVENTIST CHURCH
0.5%
0.9%
2.4%
3.4%
EPISCOPAL CHURCH
0.4%
0.2%
1.4%
1.4%
Weather
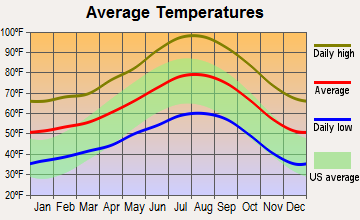
As a coastal city, Long Beach enjoys a mild, Mediterranean climate with warm summers and mild winters. It's an ideal place for people who enjoy outdoor activities year-round. In contrast, Perris Valley, located inland, experiences a semi-arid climate with hotter summers and cooler winters. The weather in Perris Valley is more variable compared to Long Beach.
Weather and climate
Type
Long Beach
Perris Valley
Temperature - Average
65.3°F
64.1°F
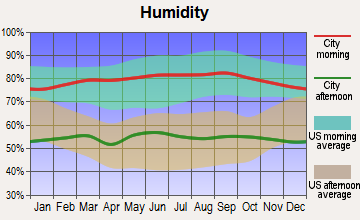
Humidity - Average morning or afternoon humidity
70.4%
68%
Humidity - Differences between morning and afternoon humidity
27%
22.4%
Humidity - Maximum monthly morning or afternoon humidity
79%
75.1%
Humidity - Minimum monthly morning or afternoon humidity
52%
52.7%
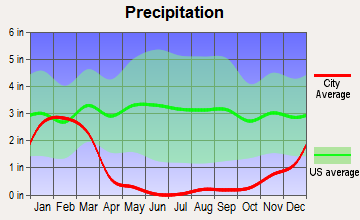
Precipitation - Yearly average
13.1 in
11.5 in
Snowfall - Yearly average
0 in
0 in
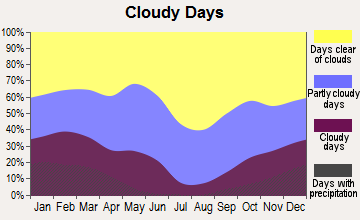
Clouds - Number of days clear of clouds
26.4%
27.1%
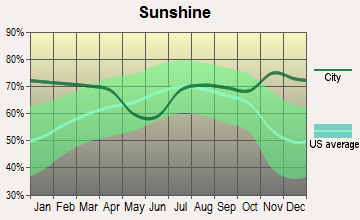
Sunshine amount - Average
78.4%
77.6%
Sunshine amount - Differences during a year
22%
20.5%
Sunshine amount - Maximum monthly
85%
82%
Sunshine amount - Minimum monthly
63%
61.5%
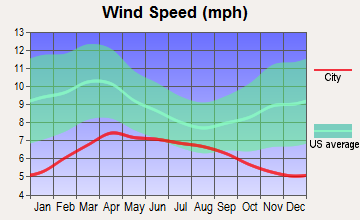
Wind speed - Average
6.1 mph
5 mph
Average climate in Long Beach, California
Average climate in Perris Valley, California
Air pollution
Type
AQI
CO
NO2
OZONE
PB
PM10
PM25
SO2
Year
Long Beach
Perris Valley
Long Beach
Perris Valley
Long Beach
Perris Valley
Long Beach
Perris Valley
Long Beach
Perris Valley
Long Beach
Perris Valley
Long Beach
Perris Valley
Long Beach
Perris Valley
2018
124
154
0.37
0.28
17.2
9.3
22.1
33.0
0.008
0.006
27.5
27.9
13.5
8.9
0.7
0.5
2017
122
146
0.36
0.28
18.1
8.7
23.2
33.0
0.007
0.004
26.7
28.9
14.5
11.4
0.8
0.3
2016
115
143
0.36
0.25
18.5
8.9
21.9
31.6
0.007
0.006
24.1
27.6
11.6
11.0
0.9
0.2
2015
111
145
0.38
0.22
19.9
9.0
22.5
31.6
0.005
0.004
25.0
25.5
13.9
11.6
0.9
0.3
2014
127
148
0.50
0.24
20.3
10.5
22.0
32.6
0.007
0.006
26.7
31.9
14.3
13.6
1.3
0.3
2013
126
150
0.48
0.24
20.0
10.8
24.7
32.4
0.005
0.006
32.3
30.8
14.6
11.7
1.0
0.2
2012
132
145
0.48
0.23
19.3
11.3
24.4
31.4
0.004
0.007
30.8
28.3
14.1
12.1
0.6
0.2
2011
119
149
0.43
0.26
20.2
11.7
23.4
31.0
0.006
0.006
28.4
30.1
15.6
13.2
1.2
0.3
2010
115
146
0.38
0.29
20.8
12.3
22.7
31.4
0.011
0.008
24.1
27.8
11.9
13.3
0.7
1.3
2009
132
151
0.50
0.26
21.0
14.3
22.0
31.3
0.008
0.010
27.7
30.8
13.1
13.8
1.1
1.6
2008
124
155
0.53
0.34
20.8
14.9
23.2
32.3
0.008
0.011
27.2
40.0
21.6
12.0
1.0
0.9
2007
109
125
0.60
0.41
20.3
15.6
21.1
31.8
0.010
0.013
N/A
N/A
N/A
N/A
1.4
1.5
2006
119
126
0.76
0.37
21.4
16.2
19.9
30.9
0.005
0.007
N/A
N/A
N/A
N/A
1.7
1.3
2005
108
129
0.74
0.35
24.3
15.7
20.5
25.4
0.011
0.012
N/A
N/A
N/A
N/A
2.7
3.4
2004
125
137
0.56
0.42
28.0
15.5
22.9
30.2
0.012
0.013
N/A
N/A
N/A
N/A
2.0
3.4
2003
130
140
0.83
0.57
28.1
18.3
22.4
31.9
0.032
0.020
N/A
N/A
N/A
N/A
1.1
2.2
2002
120
138
0.90
0.57
29.6
18.3
22.2
33.2
0.011
0.015
N/A
N/A
N/A
N/A
2.8
0.1
2001
124
145
0.81
0.79
30.3
19.2
21.5
32.5
0.011
0.052
N/A
N/A
N/A
N/A
3.3
0.8
2000
142
157
0.71
0.83
31.5
18.4
19.6
28.8
0.018
0.033
N/A
N/A
N/A
N/A
2.0
1.1
Natural disasters
Type
Long Beach
Perris Valley
Tornado activity compared to U.S. average
18.3%
16.2%
Earthquake activity compared to U.S. average
6,875.1%
7,175.7%
Natural disasters compared to U.S. average
57%
46%
Transportation
Long Beach is served by the Long Beach Transit which includes buses, shuttles and water taxis. For commuters, access to the 405 and 710 freeways is straightforward. Perris Valley is served by the Riverside Transit Agency, and also has a Metrolink station for commuting to nearby cities.
Transport
Type
Long Beach
Perris Valley
Amtrak stations
1
0
Amtrak stations nearby
3
3
FAA registered aircraft
312
0
FAA registered aircraft manufacturers and dealers
29
0
Means of transportation to work
Type
Long Beach
Perris Valley
Bicycle
0.5%
0.3%
Bus
3.3%
1%
Carpooled
9.8%
18%
Car alone
81.8%
73.6%
Motorcycle
0.2%
0.1%
Railroad
0%
0.2%
Subway
0.5%
0.1%
Walked
2.8%
1.4%
Average travel time to work
Type
Long Beach
Perris Valley
Average
30.7 min
37 min
Real Estate
Real estate in Long Beach is more expensive due to its developed nature and ocean views, with a variety of property types from downtown condos to single-family homes. Perris Valley offers more affordable housing options, making it attractive for families and first-time home buyers.
Neighborhoods
Long Beach is characterised by vibrant, diverse neighborhoods each with their own unique charm, such as Belmont Shore and East Village. Perris Valley, being a smaller community, has quiet, family-oriented neighborhoods with a more rural feel.
Houses and residents
Type
Long Beach
Perris Valley
Houses
179,856
51,323
Average household size (people)
2.8
3.4
Houses occupied
172,599 (96%)
46,991 (91.6%)
Houses occupied by owners
69,470 (40.2%)
36,693 (78.1%)
Houses occupied by renters
103,129 (59.8%)
10,298 (21.9%)
Median rent asked for vacant for-rent units
$1,057
$1,322
Median price asked for vacant for-sale houses and condos
$520,992
$464,486
Estimated median house or condo value
$693,600
$376,802
Median number of rooms in apartments
3.6
5.7
Median number of rooms in houses and condos
5.5
6.2
Renting percentage
58.4%
27.2%
Housing density (houses/condos per square mile)
3,565.7
185.6
Household income disparities
44.7%
42.4%
Housing units without a mortgage
394 (0.8%)
6,227 (22.3%)
Housing units with both a second mortgage and home equity loan
3,069 (6.2%)
116 (0.4%)
Housing units with a mortgage
49,321 (99.2%)
21,647 (77.7%)
Housing units with a home equity loan
48 (0.1%)
962 (3.5%)
Housing units with a second mortgage
3,709 (7.5%)
3,573 (12.8%)
Housing units lacking complete kitchen facilities
2.6%
1.1%
Housing units lacking complete plumbing facilities
Self-employed workers in own not incorporated business
18,532
4,282
State government workers
6,550
1,900
Unpaid family workers
178
195
Industries and Occupations
Long Beach's economy is diverse with industries such as healthcare, aviation, technology, manufacturing, and international trade. Perris Valley's economy is largely centered around retail, education, healthcare, and logistics. Each city provides varied career opportunities depending on ones industry interest.
Long Beach has a robust healthcare system with numerous hospitals and clinics including the Long Beach Memorial Medical Center. Perris Valley also offers quality healthcare, although the options aren't as diverse as in Long Beach.
Health (county statistics)
Type
Long Beach
Perris Valley
General health status score of residents in this county from 1 (poor) to 5 (excellent)
As a major city, Long Beach boasts robust infrastructure that includes a large seaport, airport, highways, and public transportation. Perris Valley's infrastructure is not as extensive, but it is continually developing with new housing projects and roadways, as well as the expansion of the Metrolink commuter rail system.
Infrastructure
Type
Long Beach
Perris Valley
TV stations
5
4
Culture and Food
Long Beach is known for its diverse cultural and culinary scene, with a wide range of restaurant choices reflecting its culturally diverse population. Perris Valley, while not as diverse as Long Beach, is home to a variety of tasty food options, particularly authentic Mexican cuisine.
Sports Teams
Long Beach doesn't host any major league sports teams but it's just a short drive away from the major sports teams of Los Angeles. Perris Valley doesn't have any major sports teams either, but it's known for extreme sports like skydiving and motor racing.
 Long Beach, CA
 Perris Valley, CA