New York City and Los Angeles are two of the most renowned cities in the United States, each offering a unique way of life. Whether it be tourists exploring the city charm or individuals trying to base their decision on relocating, it's vital to delve into aspects like safety, cost of living, education, work and economy, and the cultural tapestry that makes each city unique. Here's a comparative analysis of both cities using various parameters.
Distance between
New York, NY and
Los Angeles, CA : 2,456.0 miles
New York's population is larger by 120%. Its population has grown by 459,235 people (5.7%) since 2000. The population of Los Angeles has grown by 154,477 people (4.2%) during that time.
Both cities have areas with higher crime rates than the national average. However, the overall crime rate in New York City has been steadily declining over the years, and it's safer than Los Angeles in terms of violent crimes. LA has a higher property crime rate than New York. Police presence is visible in both cities, and neighborhood safety can vary greatly within each city.
City-data.com crime index counts serious crimes and violent crime more heavily. It adjusts for the number of visitors and daily workers commuting into cities. (higher means more crime, U.S. average = 301.1)
City-data.com crime index counts serious crimes and violent crime more heavily. It adjusts for the number of visitors and daily workers commuting into cities. (higher means more crime, U.S. average = 301.1)
Sex Offenders
According to our data, there are 4,554 registered sex offenders living in New York and 4,425 registered sex offenders living in . The ratio of residents to sex offenders in New York is 1,875 to 1; the ratio in Los Angeles is 899 to 1. The number of registered sex offenders compared to the number of residents is a smaller in New York than in Los Angeles.
Cost of Living
Living in either city can be pricey, but living in New York is generally more expensive. LA has lower costs in terms of rent and everyday expenses like food and healthcare. However, the median household income in New York is often higher, potentially offsetting some of those higher costs.
Income Tax
New York state has a progressive income tax system, with rates ranging from 4% to 8.82%. California has the highest state income tax rates in the country, ranging from 1% to 13.3%.
Property Tax
New York has an average property tax rate of 0.88%, while Los Angeles county has a rate of 0.72%. New York City also has a progressive property tax system, meaning more expensive properties face higher tax rates.
Sales Tax
New York City has a higher combined city and state sales tax rate at 8.875% compared to Los Angeles’s 9.5%. Both rates are above the national average, but the difference is slight.
Income
Type
New York
Los Angeles
Estimated median household income
$67,997
$70,372
Estimated per capita income
$42,406
$39,509
Cost of living index (U.S. average is 100)
160.2
145.1
If you make $50,000 in Los Angeles, you will have to make $55,203 in New York to maintain the same standard of living.
Geographical Conditions
LA is noted for its beaches, mountains, and mild weather, offering a great outdoor lifestyle. New York has an urban landscape filled with skyscrapers, parks, and is surrounded by water, offering a vibrant city life.
Both cities are home to esteemed educational institutions. LA boasts the prestigious University of California, Los Angeles and University of Southern California, amongst others. New York City hosts Ivy League school Columbia University, and NYU. Public school quality varies in both cities, determined largely by the neighborhood.
New York is considered a global hub for finance and communications. LA, on the other hand, is the heart of entertainment, with Hollywood as the central force and a flourishing tech industry. Both cities also boast strong creative, design, and fashion scenes. Job opportunities can be abundant, although competitive in both cities.
Biggest Employers
In LA, some of the largest employers are the County of Los Angeles, the City of Los Angeles, and the University of California, Los Angeles. In New York, some of the biggest employers include the City of New York, Northwell Health, and JP Morgan Chase.
In New York (New York County), 83.9% voted for Democrats and 14.9% for Republicans in 2012 Presidential Election. In Los Angeles (Los Angeles County), 69.7% voted for Democrats and 27.8% for Republicans.
Elections
Type
Democrats
Republicans
Other
Year
New York
Los Angeles
New York
Los Angeles
New York
Los Angeles
2020
86.5%
71.0%
12.2%
26.9%
1.2%
2.1%
2016
86.7%
72.0%
9.7%
22.5%
3.6%
5.5%
2012
83.9%
69.7%
14.9%
27.8%
1.2%
2.4%
2008
86.1%
69.2%
13.5%
28.8%
0.3%
1.9%
2004
82.3%
63.3%
16.8%
35.7%
0.9%
1.0%
2000
80.0%
63.6%
14.5%
32.4%
5.5%
4.0%
1996
80.0%
59.3%
13.8%
31.0%
6.3%
9.7%
Breakdown of population affiliated with a religious congregation
Type
Adherents
Congregations
Religion
New York
Los Angeles
New York
Los Angeles
CATHOLIC CHURCH
20.4%
36.1%
12.6%
4.7%
MUSLIM ESTIMATE
2.7%
0.7%
2.4%
1.0%
EPISCOPAL CHURCH
1.7%
0.4%
5.3%
1.4%
AMERICAN BAPTIST CHURCHES IN THE USA
1.6%
0.5%
4.7%
3.1%
REFORMED CHURCH IN AMERICA
0.6%
0.1%
1.2%
0.2%
PATRIAR PARISHE RUSSIAN ORTHODO CHURCH USA
0.4%
0.0%
0.2%
0.0%
SEVENTH DAY ADVENTIST CHURCH
0.3%
0.5%
2.4%
2.4%
SOUTHERN BAPTIST CONVENTION
0.2%
1.0%
2.9%
9.0%
Weather
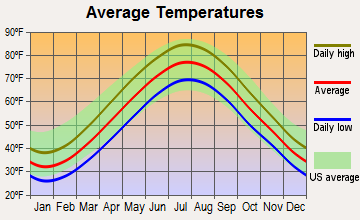
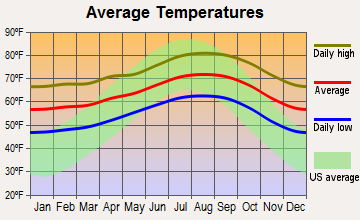
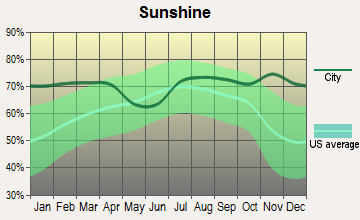
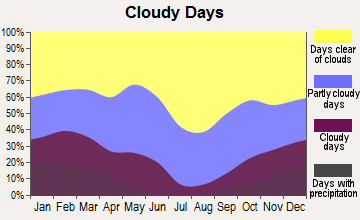
LA enjoys a Mediterranean climate with mild, wet winters and summers that are warm and dry. It is known for having over 300 days of sunshine each year. Conversely, New York City experiences a humid subtropical climate with all four seasons, including chilled winters and humid summers which bring wide-ranging weather experiences.
Weather and climate
Type
New York
Los Angeles
Temperature - Average
54.9°F
63.9°F
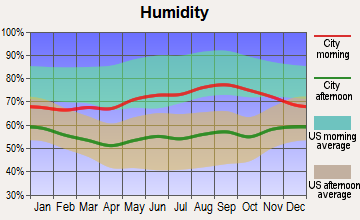
Humidity - Average morning or afternoon humidity
67.6%
60.9%
Humidity - Differences between morning and afternoon humidity
26.5%
16.1%
Humidity - Maximum monthly morning or afternoon humidity
75.9%
65.1%
Humidity - Minimum monthly morning or afternoon humidity
49.4%
49%
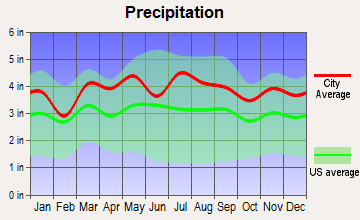
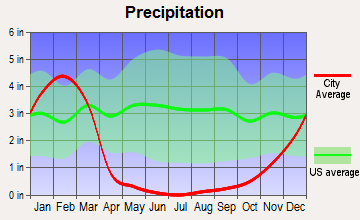
Precipitation - Yearly average
46.6 in
17.1 in
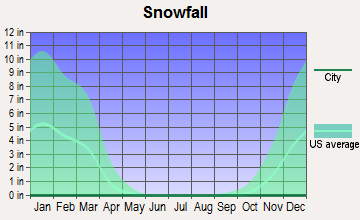
Snowfall - Yearly average
54.4 in
0 in
Clouds - Number of days clear of clouds
16.6%
29.9%
Sunshine amount - Average
60.2%
78.4%
Sunshine amount - Differences during a year
20%
22%
Sunshine amount - Maximum monthly
64%
85%
Sunshine amount - Minimum monthly
44%
63%
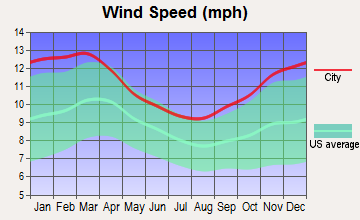
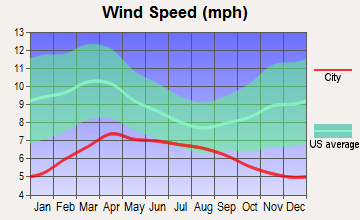
Wind speed - Average
10.4 mph
2.1 mph
Average climate in New York, New York
Average climate in Los Angeles, California
Air pollution
Type
AQI
CO
NO2
OZONE
PB
PM10
PM25
SO2
Year
New York
Los Angeles
New York
Los Angeles
New York
Los Angeles
New York
Los Angeles
New York
Los Angeles
New York
Los Angeles
New York
Los Angeles
New York
Los Angeles
2018
93
137
0.28
0.38
15.7
9.9
24.2
26.9
N/A
0.008
N/A
24.4
7.1
16.0
0.5
0.4
2017
95
136
0.08
0.41
15.8
10.3
25.0
27.2
N/A
0.007
N/A
25.0
7.0
16.2
0.6
0.5
2016
93
128
0.27
0.37
16.6
10.0
25.3
27.7
N/A
0.007
N/A
23.8
7.1
15.4
0.7
0.4
2015
100
128
0.29
0.38
18.2
10.9
24.0
28.5
N/A
0.005
N/A
21.8
8.3
17.4
1.3
0.3
2014
95
139
0.32
0.50
18.0
12.0
23.5
27.8
N/A
0.007
N/A
26.4
8.2
19.9
1.5
0.3
2013
96
140
0.34
0.48
18.8
11.8
24.2
26.2
N/A
0.007
N/A
25.5
8.9
19.0
1.6
0.3
2012
98
144
0.37
0.48
18.4
10.9
24.8
26.3
N/A
0.008
N/A
24.8
9.2
19.9
2.5
0.4
2011
107
141
0.40
0.38
20.5
13.4
24.0
24.2
N/A
0.009
N/A
32.4
10.8
18.3
3.7
0.3
2010
112
127
0.45
0.44
20.2
12.2
24.6
23.2
N/A
0.027
N/A
33.9
10.2
17.3
4.1
0.5
2009
104
153
0.47
0.51
22.4
16.0
20.5
24.0
N/A
0.009
N/A
45.2
10.3
18.8
5.0
1.1
2008
109
145
0.48
0.37
23.5
14.0
20.9
24.8
0.013
0.010
N/A
44.7
11.7
19.5
5.4
1.0
2007
121
121
0.54
0.39
24.3
14.0
19.9
24.3
0.016
0.013
N/A
N/A
12.6
N/A
6.3
1.9
2006
116
131
0.47
0.38
24.9
15.4
19.9
23.1
0.018
0.006
N/A
N/A
12.9
N/A
6.9
1.9
2005
107
132
0.56
0.43
26.9
12.8
18.9
24.1
N/A
0.012
N/A
N/A
N/A
N/A
8.7
3.7
2004
106
142
0.58
0.64
26.7
17.6
17.7
27.5
0.030
0.016
N/A
N/A
N/A
N/A
8.2
2.5
2003
107
145
0.69
0.94
28.2
27.1
18.0
19.8
0.015
0.030
27.0
N/A
N/A
N/A
8.8
2.1
2002
122
154
0.62
1.04
28.3
31.3
19.1
21.7
0.008
0.027
25.8
N/A
N/A
N/A
8.3
2.4
2001
121
135
0.61
1.16
29.2
37.0
20.3
18.7
0.020
0.041
23.1
N/A
N/A
N/A
9.2
2.4
2000
115
147
0.63
1.13
29.0
31.1
18.2
16.7
0.022
0.035
22.2
N/A
N/A
N/A
8.8
1.4
Natural disasters
Type
New York
Los Angeles
Tornado activity compared to U.S. average
56.5%
16.2%
Earthquake activity compared to U.S. average
30.8%
7,082.4%
Natural disasters compared to U.S. average
18%
57%
Transportation
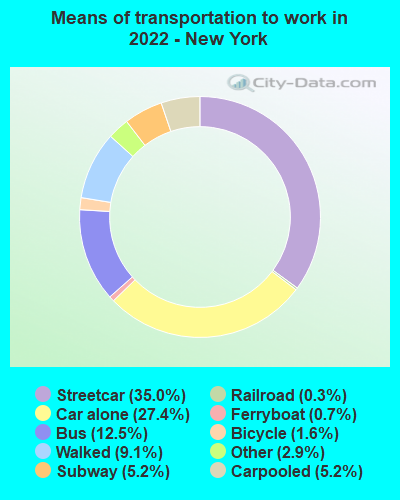
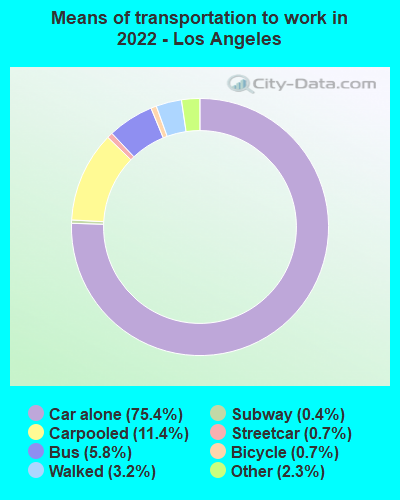
New York’s extensive subway system makes it easy to get around without a car, and the city is also highly walkable. LA’s public transportation is not as extensive or efficient, and the city is more car-focused. Both cities also have bike-share programs and ride-sharing services.
Transport
Type
New York
Los Angeles
Amtrak stations
1
1
Amtrak stations nearby
3
3
FAA registered aircraft
753
669
FAA registered aircraft manufacturers and dealers
8
14
Means of transportation to work
Type
New York
Los Angeles
Bicycle
1.7%
0.6%
Bus
12.3%
5.8%
Carpooled
5.6%
10.6%
Car alone
30.5%
76.5%
Ferryboat
0.4%
0.2%
Motorcycle
0%
0.2%
Railroad
0.3%
0.1%
Streetcar
32%
0.5%
Subway
4%
0.2%
Taxicab
1.7%
0.1%
Walked
10.1%
3%
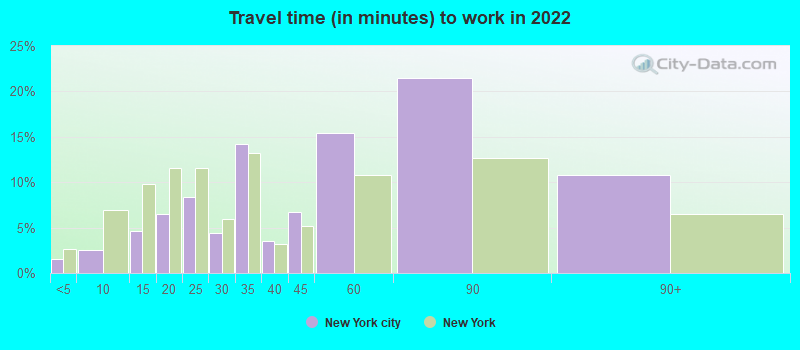
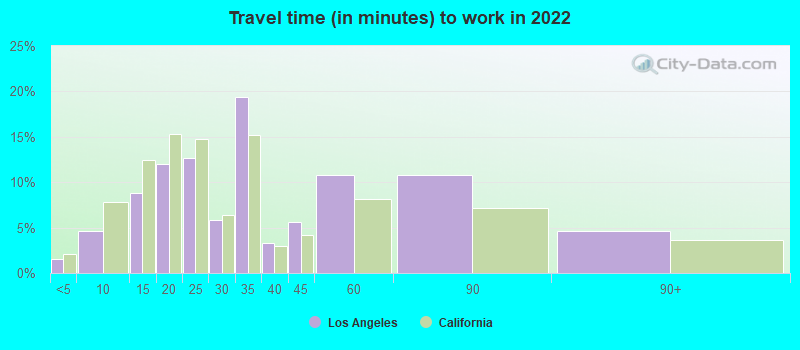
Average travel time to work
Type
New York
Los Angeles
Average
46.2 min
34.8 min
Other means
31.3 min
28.5 min
Public transportation
49.3 min
46.4 min
Private vehicle occupancy
Type
New York
Los Angeles
Average
1.3
1.2
Drove alone
83.3%
87.4%
In 2 person carpool
12.5%
10.1%
In 3 person carpool
1.8%
1.6%
In 4 person carpool
1%
0.5%
In 5-6 person carpool
0.8%
0.3%
In 7+ person carpool
0.6%
0.1%
How many people usually rode to work in the car, truck or van.
Real Estate
Real estate is expensive in both cities, but median home prices are traditionally higher in Los Angeles. New York is known for its high rent prices, especially in Manhattan. Both cities offer a mix of apartment living and single-family homes with price varying greatly based on the neighborhood.
Neighborhoods
Both cities have their own unique neighborhoods to explore. In New York, the hustle of Manhattan, the charm of Brooklyn, the diversity of Queens, and the uniqueness of The Bronx and Staten Island offer something for everyone. LA is similarly diverse, with the seaside allure of Santa Monica, the glamour of Beverly Hills, or the artsy vibe of Silver Lake.
Houses and residents
Type
New York
Los Angeles
Houses
3,641,931
1,542,391
Average household size (people)
2.6
2.8
Median year apartment built
1952
1970
Median year house/condo built
1952
1957
Length of stay in the house since moving in
15.6 years
16 years
Houses occupied
3,263,895 (89.6%)
1,410,594 (91.5%)
Houses occupied by owners
1,085,936 (33.3%)
521,485 (37%)
Houses occupied by renters
2,177,959 (66.7%)
889,109 (63%)
Median rent asked for vacant for-rent units
$2,362
$2,146
Median monthly housing costs
$1,632
$1,845
Median price asked for vacant for-sale houses and condos
$1,459,403
$1,410,311
Estimated median house or condo value
$685,700
$812,800
Median numbers of rooms
3.9
4.1
Median number of rooms in apartments
3.6
3.4
Median number of rooms in houses and condos
5.2
5.8
Median house price - detached houses
$878,380
Over $1,000,000
Median house price - in 2-unit structures
$579,409
$906,968
Median house price - in 3-to-4-unit structures
$841,459
$752,598
Median house price - in 5 or more unit structures
$977,752
$760,192
Median house price - mobile homes
$329,668
$204,691
Median house price - occupied boats, rvs, vans etc.
Over $1,000,000
$134,345
Median house price - Townhouses or other attached units
$989,845
$809,932
Median house price - All housing units
$971,396
Over $1,000,000
Median house age
70
57
Renting percentage
69%
61.8%
Housing density (houses/condos per square mile)
12,007
3,288.2
House value disparities
28.5%
23.2%
Household income disparities
48.8%
47.7%
Median household income for houses/condes with a mortgage
$120,618
$122,032
Median household income for apartments without a mortgage
$81,926
$83,712
Housing units without a mortgage
14,867 (2.4%)
5,970 (1.6%)
Housing units with both a second mortgage and home equity loan
43,914 (7.1%)
28,556 (7.6%)
Housing units with a mortgage
601,226 (97.6%)
369,242 (98.4%)
Housing units with a home equity loan
2,495 (0.4%)
2,061 (0.5%)
Housing units with a second mortgage
55,108 (8.9%)
37,750 (10.1%)
House/condo owner moved in on average (years ago)
15
15
House/condo renter moved in on average (years ago)
6
4
Housing units lacking complete kitchen facilities
1.3%
3.1%
Housing units lacking complete plumbing facilities
0.8%
0.9%
Housing units in structures
Housing units in structures
New York
Los Angeles
One, detached
9.6%
37.2%
One, attached
7.2%
5.7%
Two
11.9%
2.8%
3 or 4
8.9%
6.3%
5 to 9
6.8%
8.9%
10 to 19
6.4%
9.5%
20 to 49
15.7%
13.1%
50 or more
33.3%
15.9%
Mobile homes
0.1%
0.6%
Median real estate property taxes paid for housing units
Self-employed workers in own not incorporated business
231,322
200,073
State government workers
104,763
54,504
Unpaid family workers
8,965
4,643
Industries and Occupations
New York’s paramount fields include finance, healthcare, and professional services, with Wall Street and Madison Avenue being prominent symbols. Meanwhile LA is tied closely to the entertainment industry and tech startups, along with tourism, aerospace, and fashion.
Both cities are home to top-rated hospitals. New York City has the highest number of top-ranked hospitals in the country, including New York-Presbyterian Hospital. Los Angeles is home to UCLA Medical Center, which continually ranks as one of the top hospitals nationally.
Health (county statistics)
Type
New York
Los Angeles
General health status score of residents in this county from 1 (poor) to 5 (excellent)
LA is widespread with a significant highway system catering to its car-centric lifestyle. New York City’s infrastructure is more vertical, accommodating the limited space with high-rise buildings, extensive subway system, and pedestrian-friendly streets. Both cities face infrastructure challenges related to aging systems and congestion.
Infrastructure
Type
New York
Los Angeles
Hospitals
58
62
TV stations
29
21
Arenas or stadiums
5
5
Bank branches located here
487
385
Bank institutions located here
87
73
Main business address for public companies
395
69
Drinking water stations with no reported violations in the past
5
5
Drinking water stations with reported violations in the past
HMDA - Conventional home purchase loans - Applications denied
Year
New York
Los Angeles
1999
11,926
10,170
2000
13,707
9,527
2001
10,631
7,928
2002
11,771
9,092
2003
14,863
14,114
2004
20,738
18,901
2005
29,499
22,524
2006
37,583
26,600
2007
30,997
19,394
2008
17,112
7,924
2009
8,288
4,210
Culture and Food
Both cities are cultural melting pots. New York is renowned for its broadway shows, diverse cuisines, and iconic landmarks like Times Square. LA offers the Hollywood glamour, beautiful beaches, and is noted for Mexican impact on the local cuisine, though it hosts other international cuisines as well.
Sports Teams
New York City offers two MLB teams (Yankees, Mets), two NBA teams (Knicks, Nets), two NFL teams (Giants, Jets), and one NHL team (Rangers). LA hosts two NBA teams (Lakers, Clippers), two MLB teams (Dodgers, Angels), two NFL teams (Rams, Chargers), and one NHL team (Kings).


 New York, NY
 Los Angeles, CA