Oakland and Sunnyvale are two distinct cities in California with unique qualities. Oakland is a vibrant, diverse, and cultural city located in the San Francisco Bay Area, known for its arts scene, diverse population, and sports heritage. Sunnyvale, on the other hand, lies in the heart of Silicon Valley - renowned for its technology-driven atmosphere, excellent education system, and high standard of living. Both cities offer different lifestyles, economic opportunities, tax structures, and cultural experiences.
Distance between
Oakland, CA and
Sunnyvale, CA : 31.3 miles
Oakland's population is larger by 185%. Its population has grown by 34,339 people (8.6%) since 2000. The population of Sunnyvale has grown by 20,498 people (15.6%) during that time.
Oakland has struggled with crime and is generally perceived as less safe than Sunnyvale. However, it's worth noting that crime rates can vary greatly by neighborhood, and the city has been making efforts to improve safety. Sunnyvale, on the other hand, consistently ranks as one of the safest cities in the U.S., offering a sense of security for both residents and tourists.
City-data.com crime index counts serious crimes and violent crime more heavily. It adjusts for the number of visitors and daily workers commuting into cities. (higher means more crime, U.S. average = 301.1)
City-data.com crime index counts serious crimes and violent crime more heavily. It adjusts for the number of visitors and daily workers commuting into cities. (higher means more crime, U.S. average = 301.1)
Sex Offenders
According to our data, there are 916 registered sex offenders living in Oakland and 117 registered sex offenders living in . The ratio of residents to sex offenders in Oakland is 459 to 1; the ratio in Sunnyvale is 1,302 to 1. The number of registered sex offenders compared to the number of residents is much larger in Oakland than that in Sunnyvale.
Cost of Living
The cost of living is high in both cities due to their California location and desirable features. However, Sunnyvale, being in the center of Silicon Valley, is generally more expensive than Oakland. Housing is the largest expense in both locales.
Income Tax
As they are located in the same state, both Oakland and Sunnyvale have the same California state income tax rates which can range from 1% to 13.3% depending on income levels.
Property Tax
Property taxes in both cities are within the typical Californian range and are determined based on the assessed value of the property. Despite similar rates, homeowners in Sunnyvale often pay more due to the higher property values.
Sales Tax
Oakland and Sunnyvale have similar sales tax rates, with Oakland at 9.25% and Sunnyvale at 9.00%. Both are above the national average, reflecting California's generally higher sales tax rate.
Income
Type
Oakland
Sunnyvale
Estimated median household income
$82,236
$156,059
Estimated per capita income
$49,966
$82,723
Cost of living index (U.S. average is 100)
126.7
132.7
If you make $50,000 in Oakland, you will have to make $52,368 in Sunnyvale to maintain the same standard of living.
Geographical Conditions
Oakland is situated on the east side of the San Francisco Bay and offers diverse landscapes from hills to flatland. Sunnyvale, largely flat, sits in the Santa Clara Valley with views to nearby mountain ranges.
Sunnyvale boasts a highly rated education system, with schools that often outperform state averages. Oakland, in contrast, has a more varied education system with both underperforming and highly-rated schools. It is home to diverse educational opportunities, including arts-focused and charter schools.
The economies of both cities are strong. Oakland is a major West Coast port, and healthcare and social assistance are its largest sectors. Sunnyvale, in the heart of Silicon Valley, enjoys a thriving technology-based economy. LinkedIn and other big tech companies call Sunnyvale home.
Biggest Employers
In Oakland, Kaiser Permanente and Sutter Health are the biggest employers. Sunnyvale counts LinkedIn, Apple, and Google among its biggest employers reflecting its tech-industry dominance.
There were 114 building permits issued in Oakland in 2012 (73 more than in 2011) compared to 191 building permits issued in Sunnyvale in 2012 (20 less than in 2011).
In Oakland (Alameda County), 78.9% voted for Democrats and 18.2% for Republicans in 2012 Presidential Election. In Sunnyvale (Santa Clara County), 70.0% voted for Democrats and 27.1% for Republicans.
Elections
Type
Democrats
Republicans
Other
Year
Oakland
Sunnyvale
Oakland
Sunnyvale
Oakland
Sunnyvale
2020
79.8%
72.7%
17.6%
25.2%
2.6%
2.1%
2016
78.2%
72.7%
14.6%
20.6%
7.2%
6.7%
2012
78.9%
70.0%
18.2%
27.1%
3.0%
2.9%
2008
78.8%
69.6%
19.3%
28.6%
2.0%
1.8%
2004
75.5%
64.3%
23.4%
34.8%
1.1%
0.9%
2000
69.6%
60.7%
24.2%
34.4%
6.2%
4.9%
1996
65.8%
56.9%
23.1%
32.2%
11.2%
11.0%
Breakdown of population affiliated with a religious congregation
Type
Adherents
Congregations
Religion
Oakland
Sunnyvale
Oakland
Sunnyvale
CATHOLIC CHURCH
15.3%
25.1%
4.9%
6.0%
MUSLIM ESTIMATE
2.0%
1.1%
2.5%
1.8%
SOUTHERN BAPTIST CONVENTION
1.5%
0.9%
10.9%
7.7%
AMERICAN BAPTIST CHURCHES IN THE USA
0.5%
0.1%
2.5%
1.1%
EPISCOPAL CHURCH
0.3%
0.5%
1.7%
2.3%
EVANGELICAL LUTHERAN CHURCH IN AMERICA
0.3%
0.3%
2.3%
2.3%
SEVENTH DAY ADVENTIST CHURCH
0.3%
0.4%
1.4%
2.6%
Weather
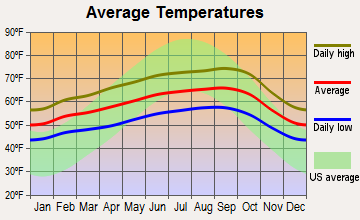
Both Oakland and Sunnyvale enjoy typical Mediterranean climates, with mild, wet winters, and warm, dry summers. However, due to its location further south and closer to the water, Sunnyvale tends to be a bit warmer than Oakland, with less fog and wind.
Weather and climate
Type
Oakland
Sunnyvale
Temperature - Average
59.1°F
60.1°F
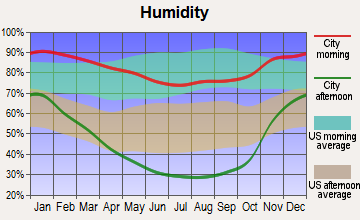
Humidity - Average morning or afternoon humidity
84.2%
80.8%
Humidity - Differences between morning and afternoon humidity
29%
30.7%
Humidity - Maximum monthly morning or afternoon humidity
90.9%
87.5%
Humidity - Minimum monthly morning or afternoon humidity
61.9%
56.8%
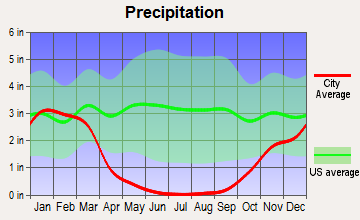
Precipitation - Yearly average
23.5 in
15.2 in
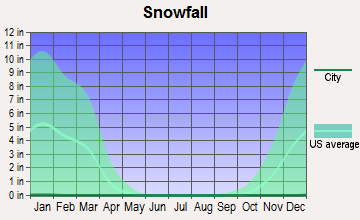
Snowfall - Yearly average
0 in
0 in
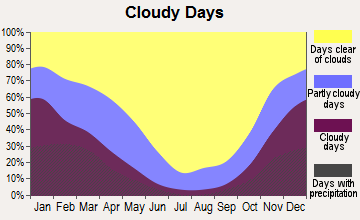
Clouds - Number of days clear of clouds
26.9%
27%
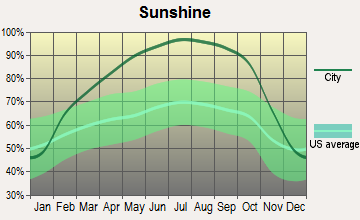
Sunshine amount - Average
73%
73.3%
Sunshine amount - Differences during a year
22%
22.5%
Sunshine amount - Maximum monthly
77%
77.2%
Sunshine amount - Minimum monthly
55%
54.7%
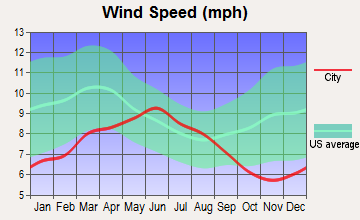
Wind speed - Average
11.4 mph
10.9 mph
Average climate in Oakland, California
Average climate in Sunnyvale, California
Air pollution
Type
AQI
CO
NO2
OZONE
PB
PM25
SO2
Year
Oakland
Sunnyvale
Oakland
Sunnyvale
Oakland
Sunnyvale
Oakland
Sunnyvale
Oakland
Sunnyvale
Oakland
Sunnyvale
Oakland
Sunnyvale
2018
105
96
0.46
0.45
13.0
13.3
20.9
23.4
0.012
0.006
13.7
12.0
0.4
0.2
2017
100
93
0.48
0.44
13.5
13.3
21.2
23.7
0.008
0.004
11.3
9.7
0.5
0.2
2016
80
70
0.41
0.42
12.9
12.3
20.3
22.4
0.005
0.003
7.9
8.5
0.9
0.2
2015
93
85
0.43
0.47
14.5
13.9
20.6
22.6
0.004
0.004
9.5
8.6
0.8
0.3
2014
90
87
0.42
0.40
14.7
13.0
20.6
22.4
0.005
0.004
9.1
8.1
0.5
0.2
2013
89
90
0.39
0.40
15.2
10.8
18.0
22.2
0.004
0.003
11.6
9.7
0.5
0.4
2012
87
75
0.38
0.37
13.7
9.8
18.7
23.0
0.003
0.002
8.5
8.0
0.7
0.9
2011
94
83
0.32
0.38
14.4
10.9
18.5
22.1
0.003
0.002
10.1
11.0
1.1
0.8
2010
90
87
0.21
0.36
14.4
12.1
19.4
21.7
0.013
0.003
8.4
8.1
1.0
0.4
2009
99
90
0.22
0.41
15.2
13.8
19.0
20.1
0.006
0.004
11.3
9.6
1.3
0.3
2008
110
100
0.29
0.47
15.1
15.4
20.1
21.4
0.006
N/A
12.4
12.0
1.0
N/A
2007
100
92
0.41
0.47
13.4
15.3
21.3
19.1
0.006
0.009
9.5
10.8
1.1
N/A
2006
106
100
0.47
0.50
13.8
16.6
22.6
20.8
N/A
N/A
9.4
10.6
1.3
N/A
2005
97
95
0.56
0.60
13.3
17.0
15.3
18.0
N/A
N/A
9.6
11.8
1.4
N/A
2004
107
98
0.51
0.56
14.3
17.0
15.3
20.0
0.004
N/A
11.3
10.3
1.8
N/A
2003
82
87
0.63
0.65
16.1
18.7
15.8
20.5
N/A
N/A
N/A
N/A
1.7
N/A
2002
81
78
0.69
0.64
18.8
18.9
16.7
19.6
0.008
0.006
N/A
N/A
1.6
N/A
2001
87
77
0.70
0.63
17.2
18.3
12.7
16.0
0.008
0.007
N/A
N/A
1.5
N/A
2000
78
65
0.84
0.69
17.1
18.6
11.8
16.8
0.012
0.008
N/A
N/A
1.8
N/A
Natural disasters
Type
Oakland
Sunnyvale
Tornado activity compared to U.S. average
8.8%
8.9%
Earthquake activity compared to U.S. average
7,647.7%
7,684.8%
Natural disasters compared to U.S. average
20%
19%
Transportation
Oakland, located on the BART line, offers convenient public transportation options to San Francisco and around the Bay Area. Sunnyvale also provides robust public-transport options, including Caltrain, and easy access to Highways 101 and 280 for commuting to other parts of Silicon Valley.
Transport
Type
Oakland
Sunnyvale
Amtrak stations
1
0
Amtrak stations nearby
3
3
FAA registered aircraft
154
81
FAA registered aircraft manufacturers and dealers
2
2
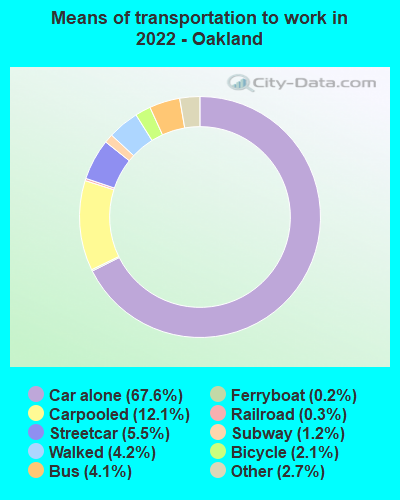
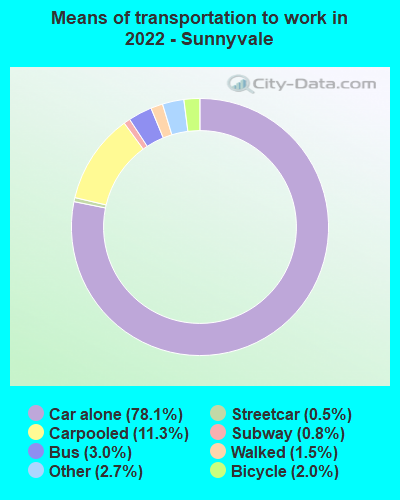
Means of transportation to work
Type
Oakland
Sunnyvale
Bicycle
1%
1%
Bus
3.2%
0.9%
Carpooled
12.6%
9.3%
Car alone
72.2%
82.2%
Ferryboat
0.1%
0%
Motorcycle
0.4%
0.4%
Railroad
0.1%
0.3%
Streetcar
2.3%
0.1%
Subway
0.5%
0.8%
Taxicab
0.1%
0%
Walked
5.5%
2.7%
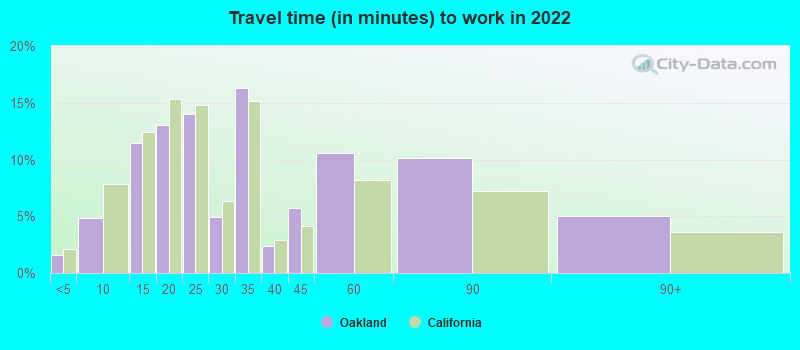
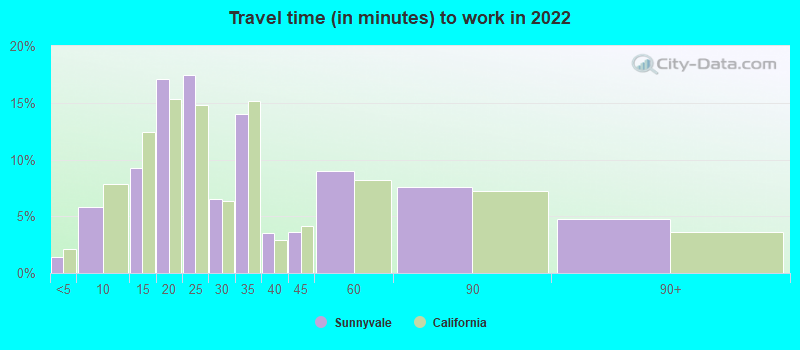
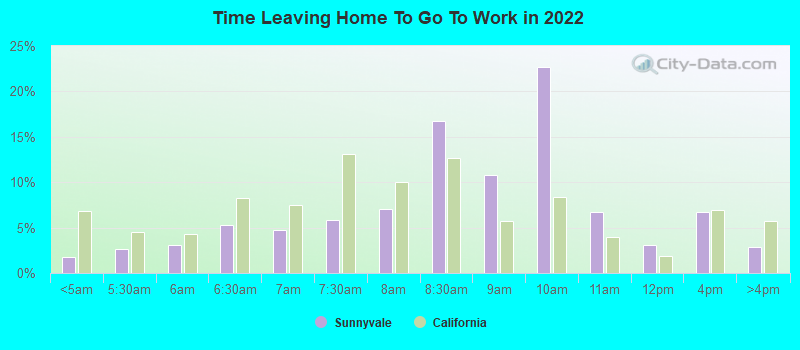
Average travel time to work
Type
Oakland
Sunnyvale
Average
33.6 min
30.8 min
Other means
29 min
21.8 min
Public transportation
45.3 min
50.3 min
Private vehicle occupancy
Type
Oakland
Sunnyvale
Average
1.2
1.2
Drove alone
88.1%
86.5%
In 2 person carpool
9.2%
11.1%
In 3 person carpool
2%
2%
In 4 person carpool
0.6%
0%
In 5-6 person carpool
0%
0.4%
How many people usually rode to work in the car, truck or van.
Real Estate
Real estate in both Oakland and Sunnyvale is expensive compared to the national average, reflecting the desirability of Bay Area living. However, home prices in Sunnyvale are among the highest in the nation due to its proximity to major tech firms.
Neighborhoods
Oakland is famous for its diversity, with neighborhoods like Chinatown, Fruitvale, and Rockridge offering distinctive cultural experiences. Sunnyvale neighborhoods tend to be more homogeneous, reflecting the tech-oriented populace.
Houses and residents
Type
Oakland
Sunnyvale
Houses
186,660
63,065
Average household size (people)
2.5
2.6
Median year apartment built
1958
1981
Median year house/condo built
1943
1967
Length of stay in the house since moving in
15.4 years
15 years
Houses occupied
170,366 (91.3%)
59,567 (94.5%)
Houses occupied by owners
72,661 (42.7%)
27,299 (45.8%)
Houses occupied by renters
97,705 (57.4%)
32,268 (54.2%)
Median rent asked for vacant for-rent units
$3,127
$3,823
Median monthly housing costs
$1,921
$2,619
Median price asked for vacant for-sale houses and condos
$923,387
$2,505,218
Estimated median house or condo value
$848,600
Over $1,000,000
Median numbers of rooms
4.3
4.4
Median number of rooms in apartments
3.6
3.5
Median number of rooms in houses and condos
5.7
5.8
Median house price - detached houses
Over $1,000,000
Over $1,000,000
Median house price - in 2-unit structures
$781,885
Over $1,000,000
Median house price - in 3-to-4-unit structures
$716,428
$687,957
Median house price - in 5 or more unit structures
$709,698
Over $1,000,000
Median house price - mobile homes
$365,144
$285,839
Median house price - Townhouses or other attached units
$834,685
Over $1,000,000
Median house price - All housing units
$991,120
Over $1,000,000
Median house age
69
45
Renting percentage
58.9%
52%
Housing density (houses/condos per square mile)
3,329.9
2,874.9
House value disparities
22.3%
33.3%
Household income disparities
45.9%
33.9%
Median household income for houses/condes with a mortgage
$153,718
$213,507
Median household income for apartments without a mortgage
$81,904
$100,313
Housing units without a mortgage
1,176 (2.2%)
347 (2%)
Housing units with both a second mortgage and home equity loan
4,996 (9.4%)
1,480 (8.4%)
Housing units with a mortgage
51,720 (97.8%)
17,227 (98%)
Housing units with a home equity loan
139 (0.3%)
0 (0%)
Housing units with a second mortgage
6,096 (11.5%)
2,171 (12.4%)
House/condo owner moved in on average (years ago)
13
15
House/condo renter moved in on average (years ago)
4
1
Housing units lacking complete kitchen facilities
2.4%
1.1%
Housing units lacking complete plumbing facilities
1.6%
0.5%
Housing units in structures
Housing units in structures
Oakland
Sunnyvale
One, detached
42.3%
35.6%
One, attached
4.9%
11.4%
Two
6.2%
1.6%
3 or 4
11.1%
7.7%
5 to 9
6.6%
9.0%
10 to 19
6.9%
4.8%
20 to 49
9.9%
8.3%
50 or more
11.7%
15.0%
Mobile homes
0.3%
6.6%
Boats, RVs, vans, etc.
0.1%
0.0%
Median real estate property taxes paid for housing units
Self-employed workers in own not incorporated business
20,615
3,582
State government workers
9,112
1,192
Unpaid family workers
529
0
Industries and Occupations
In Oakland, the healthcare industry is the largest employer, but sectors such as education, retail trade, and manufacturing also provide considerable employment. In Sunnyvale, occupations are heavily skewed towards the high-tech industry, with professional, scientific, and technical services being the largest sector.
Both Oakland and Sunnyvale enjoy access to high-quality healthcare services. Oakland is home to Kaiser Permanente, a well-known healthcare provider. Meanwhile, Sunnyvale residents often visit top-ranked health facilities located throughout Silicon Valley.
Health (county statistics)
Type
Oakland
Sunnyvale
General health status score of residents in this county from 1 (poor) to 5 (excellent)
Oakland, being an older and more major city, has a well-developed infrastructure with a couple of noticeable issues in areas including roads, fewer bicycle lanes and some aging buildings. Sunnyvale, being a part of a more recently developed Silicon Valley, enjoys more recently built infrastructure, including modern buildings and public transport and cycling amenities.
HMDA - Conventional home purchase loans - Applications denied
Year
Oakland
Sunnyvale
1999
1,291
402
2000
1,721
209
2001
1,244
181
2002
1,370
194
2003
2,021
301
2004
3,261
441
2005
3,850
594
2006
4,422
515
2007
2,645
430
2008
1,041
296
2009
700
201
Culture and Food
Oakland is renowned for its diverse population, which is reflected in its vibrant food scene and bustling arts district. Sunnyvale also offers a variety of dining options, but its cultural scene is quieter than Oakland’s, reflecting its suburban nature.
Sports Teams
Oakland cheers for its home teams, the Oakland Athletics (MLB) and the Golden State Warriors (NBA). Sunnyvale does not have its own sports teams, but residents often root for nearby San Francisco and San Jose teams.

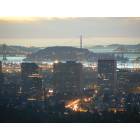


 Oakland, CA
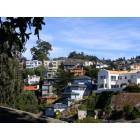
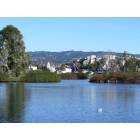
 Sunnyvale, CA