This analysis focuses on the comparison between living in Oakland, CA, and Vallejo, CA. Factors considered include crime and safety, weather, cost of living, education, work and economy, infrastructure, industries, employers, real estate, neighborhoods, transportation, taxes, food and culture, sports teams, geographical conditions, and healthcare. Whether you're a potential resident or a tourist, understanding these components can influence your decision and provide a more comprehensive view of each city.
Distance between
Oakland, CA and
Vallejo, CA : 22.0 miles
Oakland's population is larger by 247%. Its population has grown by 34,339 people (8.6%) since 2000. The population of Vallejo has grown by 8,126 people (7.0%) during that time.
Oakland, CA has a higher crime rate than Vallejo, CA, making Vallejo a safer choice for residents and tourists alike. However, Oakland is committing itself to improving safety throughout the city. Neighborhood Watch groups are popular, and the city is investing in crime prevention strategies. On the other hand, Vallejo, while having a lower crime rate, also shows an emphasis on community-led safety initiatives and maintains a more suburban feel, which often translates to a safer environment.
City-data.com crime index counts serious crimes and violent crime more heavily. It adjusts for the number of visitors and daily workers commuting into cities. (higher means more crime, U.S. average = 301.1)
City-data.com crime index counts serious crimes and violent crime more heavily. It adjusts for the number of visitors and daily workers commuting into cities. (higher means more crime, U.S. average = 301.1)
Sex Offenders
According to our data, there are 916 registered sex offenders living in Oakland and 327 registered sex offenders living in . The ratio of residents to sex offenders in Oakland is 459 to 1; the ratio in Vallejo is 371 to 1. The number of registered sex offenders compared to the number of residents in Oakland is near to than in Vallejo.
Cost of Living
Living in Oakland tends to be more expensive than in Vallejo. This includes housing, transportation, and other essential costs. For someone looking to relocate or visit, the difference in cost of living might be a significant factor in decision-making. Tourists will generally find accommodation, dining, and attractions more affordable in Vallejo.
Income Tax
Both cities adhere to California's progressive state income tax, which ranges from 1% to 13.3% depending on income level. Neither Oakland nor Vallejo impose their own city-level income taxes.
Property Tax
Both Oakland and Vallejo fall within California’s average property tax rate of 0.73%. However, due to the higher property values in Oakland, homeowners often pay more in total taxes than those in Vallejo.
Sales Tax
Oakland and Vallejo both operate under California's state sales tax of 7.25%. However, when considering local add-ons, total sales tax in Oakland comes to 9.25% and in Vallejo, it is 8.375%.
Income
Type
Oakland
Vallejo
Estimated median household income
$82,236
$77,711
Estimated per capita income
$49,966
$37,204
Cost of living index (U.S. average is 100)
126.7
113.3
If you make $50,000 in Vallejo, you will have to make $55,914 in Oakland to maintain the same standard of living.
Geographical Conditions
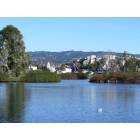
Oakland, nestled against the San Francisco Bay, boasts hilly landscapes, waterfront, and significant green spaces including Joaquin Miller Park and Lake Merritt. Vallejo has a unique appeal with its location by the water, San Pablo Bay and the Napa River, and its own series of hills and open spaces.
Oakland offers numerous higher learning institutions, including the Oakland City University and Laney College. The quality of elementary and secondary education varies, with many schools demonstrating excellent performances. In Vallejo, the education system is fairly diverse, with a mix of public, private and charter schools. Touro University, located on Mare Island, is a health science focused institution also located in Vallejo.
Oakland has a more diverse economy than Vallejo, thanks to its port, which is among the busiest in the world, the healthcare sector, tech startups, and a range of other industries. Vallejo's economy leans towards public sector employment with a scale towards health care and social assistance. While opportunities exist in both cities, Oakland might offer more diverse prospects for job seekers.
Biggest Employers
Oakland's major employers include Kaiser Permanente, the County of Alameda, and the Oakland Unified School District. In Vallejo, the largest employers include Kaiser Permanente, Six Flags Discovery Kingdom, and the Vallejo City Unified School District.
There were 114 building permits issued in Oakland in 2012 (73 more than in 2011) compared to 30 building permits issued in Vallejo in 2012 (5 more than in 2011).
In Oakland (Alameda County), 78.9% voted for Democrats and 18.2% for Republicans in 2012 Presidential Election. In Vallejo (Solano County), 63.3% voted for Democrats and 34.1% for Republicans.
Elections
Type
Democrats
Republicans
Other
Year
Oakland
Vallejo
Oakland
Vallejo
Oakland
Vallejo
2020
79.8%
63.7%
17.6%
33.5%
2.6%
2.8%
2016
78.2%
60.9%
14.6%
30.9%
7.2%
8.2%
2012
78.9%
63.3%
18.2%
34.1%
3.0%
2.6%
2008
78.8%
63.4%
19.3%
34.8%
2.0%
1.8%
2004
75.5%
57.6%
23.4%
42.1%
1.1%
0.3%
2000
69.6%
57.1%
24.2%
39.3%
6.2%
3.6%
1996
65.8%
55.1%
23.1%
34.7%
11.2%
10.1%
Breakdown of population affiliated with a religious congregation
Type
Adherents
Congregations
Religion
Oakland
Vallejo
Oakland
Vallejo
CATHOLIC CHURCH
15.3%
19.6%
4.9%
3.4%
MUSLIM ESTIMATE
2.0%
0.8%
2.5%
1.0%
SOUTHERN BAPTIST CONVENTION
1.5%
3.4%
10.9%
11.9%
AMERICAN BAPTIST CHURCHES IN THE USA
0.5%
0.6%
2.5%
4.1%
EPISCOPAL CHURCH
0.3%
0.3%
1.7%
1.4%
EVANGELICAL LUTHERAN CHURCH IN AMERICA
0.3%
0.3%
2.3%
1.4%
LUTHERAN CHURCH
0.3%
0.3%
1.6%
1.0%
SEVENTH DAY ADVENTIST CHURCH
0.3%
0.3%
1.4%
2.0%
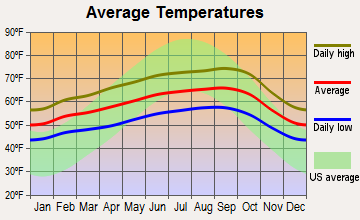
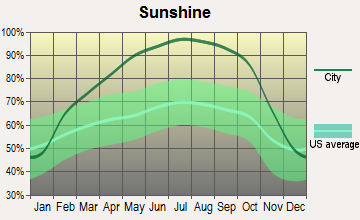
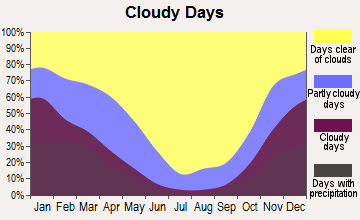
Weather
Both cities have a Mediterranean climate, with mild, wet winters and dry, warm summers. Oakland typically has a more balanced climate with more sunny days, less fog and wind than Vallejo. Vallejo can be warmer in summer but colder in winter, so potential relocations and tourists might consider their weather preferences.
Weather and climate
Type
Oakland
Vallejo
Temperature - Average
59.1°F
59.5°F
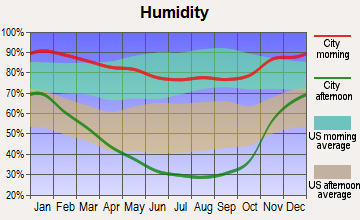
Humidity - Average morning or afternoon humidity
84.2%
81.4%
Humidity - Differences between morning and afternoon humidity
29%
30.4%
Humidity - Maximum monthly morning or afternoon humidity
90.9%
87.6%
Humidity - Minimum monthly morning or afternoon humidity
61.9%
57.3%
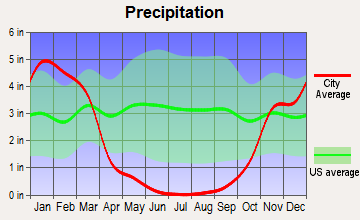
Precipitation - Yearly average
23.5 in
23.5 in
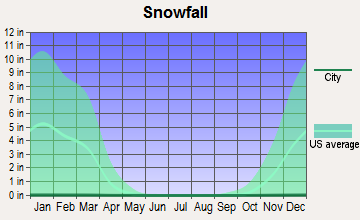
Snowfall - Yearly average
0 in
0 in
Clouds - Number of days clear of clouds
26.9%
28.5%
Sunshine amount - Average
73%
74.1%
Sunshine amount - Differences during a year
22%
23.3%
Sunshine amount - Maximum monthly
77%
77.5%
Sunshine amount - Minimum monthly
55%
54.2%
Wind speed - Average
11.4 mph
10.8 mph
Average climate in Oakland, California
Average climate in Vallejo, California
Air pollution
Type
AQI
CO
NO2
OZONE
PB
PM25
SO2
Year
Oakland
Vallejo
Oakland
Vallejo
Oakland
Vallejo
Oakland
Vallejo
Oakland
Vallejo
Oakland
Vallejo
Oakland
Vallejo
2018
105
104
0.46
0.37
13.0
8.2
20.9
23.7
0.012
N/A
13.7
12.7
0.4
0.6
2017
100
104
0.48
0.41
13.5
8.2
21.2
24.4
0.008
N/A
11.3
10.5
0.5
0.8
2016
80
76
0.41
0.38
12.9
7.2
20.3
23.7
0.005
N/A
7.9
8.1
0.9
0.7
2015
93
92
0.43
0.40
14.5
8.2
20.6
24.4
0.004
N/A
9.5
9.7
0.8
0.7
2014
90
85
0.42
0.35
14.7
8.2
20.6
24.5
0.005
N/A
9.1
9.9
0.5
0.7
2013
89
89
0.39
0.40
15.2
9.9
18.0
23.0
0.004
N/A
11.6
10.6
0.5
0.6
2012
87
86
0.38
0.38
13.7
9.1
18.7
24.2
0.003
N/A
8.5
9.0
0.7
0.7
2011
94
86
0.32
0.41
14.4
10.2
18.5
23.0
0.003
N/A
10.1
10.1
1.1
0.9
2010
90
87
0.21
0.35
14.4
9.3
19.4
23.6
0.013
0.017
8.4
8.3
1.0
0.6
2009
99
96
0.22
0.36
15.2
9.7
19.0
22.7
0.006
0.006
11.3
9.7
1.3
0.7
2008
110
113
0.29
0.41
15.1
10.5
20.1
24.3
0.006
0.005
12.4
12.6
1.0
0.9
2007
100
99
0.41
0.44
13.4
10.6
21.3
22.7
0.006
N/A
9.5
12.0
1.1
0.9
2006
106
103
0.47
0.49
13.8
11.6
22.6
22.1
N/A
N/A
9.4
12.4
1.3
1.0
2005
97
93
0.56
0.45
13.3
10.8
15.3
20.9
N/A
N/A
9.6
11.5
1.4
1.2
2004
107
107
0.51
0.48
14.3
11.9
15.3
21.2
0.004
N/A
11.3
12.8
1.8
1.3
2003
82
78
0.63
0.49
16.1
11.9
15.8
22.0
N/A
N/A
N/A
N/A
1.7
1.2
2002
81
81
0.69
0.56
18.8
13.0
16.7
22.6
0.008
N/A
N/A
N/A
1.6
1.3
2001
87
82
0.70
0.53
17.2
12.9
12.7
21.6
0.008
N/A
N/A
N/A
1.5
1.0
2000
78
79
0.84
0.64
17.1
13.4
11.8
17.6
0.012
N/A
N/A
N/A
1.8
1.5
Natural disasters
Type
Oakland
Vallejo
Tornado activity compared to U.S. average
8.8%
8.6%
Earthquake activity compared to U.S. average
7,647.7%
7,698%
Natural disasters compared to U.S. average
20%
23%
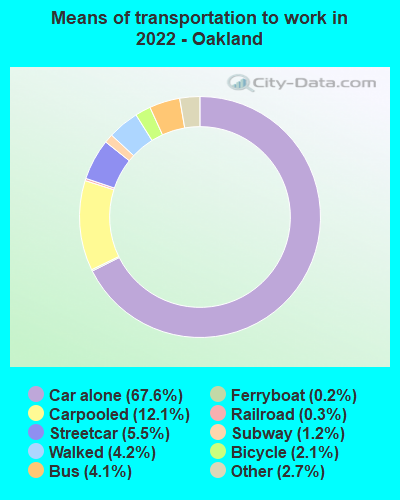
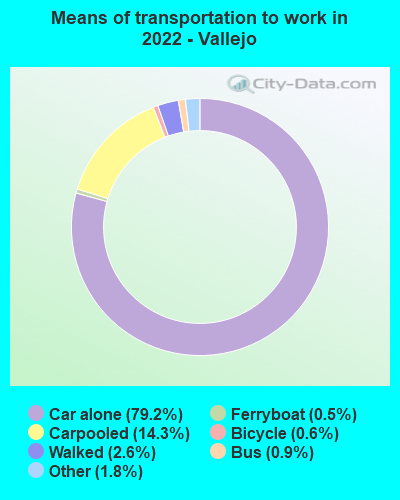
Transportation
Oakland enjoys broad access to public transportation with buses, BART (Bay Area Rapid Transit), and ferry service. Vallejo also provides public transportation like the Vallejo Transit and a direct ferry to San Francisco, but it lacks the comprehensive transit network that Oakland offers.
Transport
Type
Oakland
Vallejo
Amtrak stations
1
1
Amtrak stations nearby
3
3
FAA registered aircraft
154
28
FAA registered aircraft manufacturers and dealers
2
1
Means of transportation to work
Type
Oakland
Vallejo
Bicycle
1%
0.4%
Bus
3.2%
0.9%
Carpooled
12.6%
13.2%
Car alone
72.2%
80.6%
Ferryboat
0.1%
0.3%
Motorcycle
0.4%
0.2%
Railroad
0.1%
0.1%
Streetcar
2.3%
0%
Subway
0.5%
0.1%
Taxicab
0.1%
0.1%
Walked
5.5%
2.9%
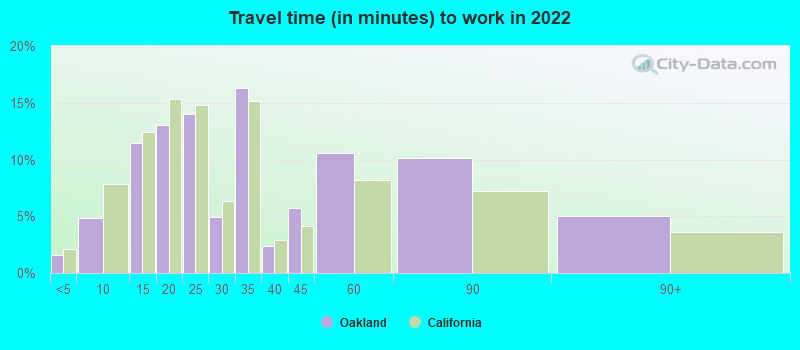
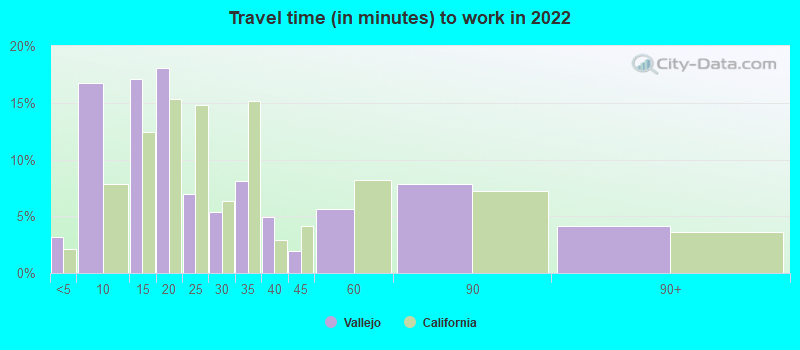
Average travel time to work
Type
Oakland
Vallejo
Average
33.6 min
28.9 min
Other means
29 min
35.1 min
Public transportation
45.3 min
60.4 min
Private vehicle occupancy
Type
Oakland
Vallejo
Average
1.2
1.2
Drove alone
88.1%
84.7%
In 2 person carpool
9.2%
11.5%
In 3 person carpool
2%
1.9%
In 4 person carpool
0.6%
0.9%
In 5-6 person carpool
0%
0.2%
In 7+ person carpool
0%
0.2%
How many people usually rode to work in the car, truck or van.
Real Estate
In terms of housing and real estate, Oakland is significantly more pricey than Vallejo. Its proximity to San Francisco and Silicon Valley accounts for some of the heightened costs. Vallejo, while having experienced recent growth in its real estate market, remains a more affordable option.
Neighborhoods
Oakland is known for its diverse and vibrant neighborhoods, each with a distinct personality, such as Rockridge, Old Oakland, and Chinatown. Vallejo also hosts a variety of neighborhoods that offer a range of options from historic homes to newer developments, such as the downtown area and Hiddenbrooke.
Houses and residents
Type
Oakland
Vallejo
Houses
186,660
45,319
Average household size (people)
2.5
2.8
Median year apartment built
1958
1971
Median year house/condo built
1943
1975
Length of stay in the house since moving in
15.4 years
14.9 years
Houses occupied
170,366 (91.3%)
43,906 (96.9%)
Houses occupied by owners
72,661 (42.7%)
25,911 (59%)
Houses occupied by renters
97,705 (57.4%)
17,995 (41%)
Median rent asked for vacant for-rent units
$3,127
$1,014
Median monthly housing costs
$1,921
$1,784
Median price asked for vacant for-sale houses and condos
$923,387
$455,430
Estimated median house or condo value
$848,600
$505,400
Median numbers of rooms
4.3
5.5
Median number of rooms in apartments
3.6
4.5
Median number of rooms in houses and condos
5.7
6
Median house price - detached houses
Over $1,000,000
$533,412
Median house price - in 2-unit structures
$781,885
$236,764
Median house price - in 3-to-4-unit structures
$716,428
$508,113
Median house price - in 5 or more unit structures
$709,698
$313,555
Median house price - mobile homes
$365,144
$81,773
Median house price - occupied boats, rvs, vans etc.
$485,645
$32,035
Median house price - Townhouses or other attached units
$834,685
$485,712
Median house price - All housing units
$991,120
$505,187
Median house age
69
48
Renting percentage
58.9%
40.4%
Housing density (houses/condos per square mile)
3,329.9
1,501.3
House value disparities
22.3%
23.2%
Household income disparities
45.9%
42.8%
Median household income for houses/condes with a mortgage
$153,718
$116,951
Median household income for apartments without a mortgage
$81,904
$67,083
Housing units without a mortgage
1,176 (2.2%)
180 (1%)
Housing units with both a second mortgage and home equity loan
4,996 (9.4%)
990 (5.3%)
Housing units with a mortgage
51,720 (97.8%)
18,441 (99%)
Housing units with a home equity loan
139 (0.3%)
100 (0.5%)
Housing units with a second mortgage
6,096 (11.5%)
1,659 (8.9%)
House/condo owner moved in on average (years ago)
13
13
House/condo renter moved in on average (years ago)
4
4
Housing units lacking complete kitchen facilities
2.4%
1.3%
Housing units lacking complete plumbing facilities
1.6%
0.3%
Housing units in structures
Housing units in structures
Oakland
Vallejo
One, detached
42.3%
69.1%
One, attached
4.9%
5.4%
Two
6.2%
2.5%
3 or 4
11.1%
6.6%
5 to 9
6.6%
2.4%
10 to 19
6.9%
3.0%
20 to 49
9.9%
1.0%
50 or more
11.7%
7.3%
Mobile homes
0.3%
2.7%
Boats, RVs, vans, etc.
0.1%
0.1%
Median real estate property taxes paid for housing units
Self-employed workers in own not incorporated business
20,615
4,114
State government workers
9,112
3,420
Unpaid family workers
529
153
Industries and Occupations
Oakland's industries range from tech and health care to shipping, retail, and food services. The average income in Oakland tends to be higher than in Vallejo, thanks to high-paying tech and healthcare jobs. Vallejo is home to many working in the health care sector and has a strong presence of artists and those working in manufacturing.
Oakland hosts several top-rated health care organizations, like the UCSF Benioff Children's Hospital Oakland and Kaiser Permanente. Vallejo, while smaller, also has quality medical facilities, including the Sutter Solano Medical Center and Kaiser Permanente Vallejo Medical Center.
Oakland benefits from well-developed infrastructures including public transportation, bike lanes, freeways, and Oakland International Airport. Additionally, it has direct rail and ferry connections to San Francisco. Vallejo also has a solid infrastructure, including ferry services to San Francisco and a substantial park network but lacks an encompassing public transit system like Oakland's BART.
Infrastructure
Type
Oakland
Vallejo
Hospitals
9
10
TV stations
28
21
Bank branches located here
76
16
Bank institutions located here
29
9
Drinking water stations with no reported violations in the past
10
0
Drinking water stations with reported violations in the past
HMDA - Conventional home purchase loans - Applications denied
Year
Oakland
Vallejo
1999
1,291
492
2000
1,721
690
2001
1,244
464
2002
1,370
548
2003
2,021
739
2004
3,261
1,130
2005
3,850
1,568
2006
4,422
1,335
2007
2,645
804
2008
1,041
313
2009
700
231
Culture and Food
Cultural diversity is a highlight in both cities. Oakland is filled with art, music, a renowned food scene, and rich history with influence from its African-American, Latino, and Asian communities. Vallejo offers its own blend of culture, with an emerging arts scene, diverse food options, and historic Victorian homes symbolizing its deep-rooted history.
Sports Teams
Oakland was once home to three major sports teams, the Golden State Warriors (NBA), the Raiders (NFL), and Oakland A’s (MLB). Currently, only the A's remain. Vallejo, while not home to any major sports teams, is located near several major sports cities offering fans plenty of options.


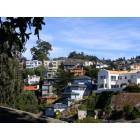

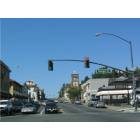


 Oakland, CA
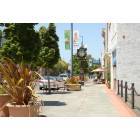
 Vallejo, CA