Riverside and Jurupa are two adjacent cities in Southern California, both offering unique advantages for residents and visitors alike. Riverside, being the larger and older of the two, boasts more amenities, services, and job opportunities. However, Jurupa, also known as Jurupa Valley, offers a more rural setting with a lower cost of living. Comparing these two cities depends on what you value most in a place to live or visit - urban amenities or rural charm, greater job opportunities or lower cost of living, historical culture or suburban modernity.
Riverside, being more urbanized, has a higher crime rate than Jurupa. Both cities, however, have crime rates that are slightly higher than the national average. Riverside's police department is well-staffed, and there are many neighborhood watch groups. Jurupa, being slightly more rural, has a slower police response time, but residents often cite a strong sense of community as contributing to overall safety.
Cost of Living
The cost of living in Riverside is slightly higher than in Jurupa, Heavier population, more amenities, and services all contribute to the higher costs. That said, both cities are more affordable than many other areas in California, especially compared to coastal locations like Los Angeles or San Francisco.
Income Tax
As cities in California, both Riverside and Jurupa adhere to the same state income tax regulations. California has a progressive income tax, meaning the rate you pay depends on your income. The range is from 1% to 13.3%, with the highest rates applied to incomes over $1 million.
Property Tax
In Riverside County, where both cities are located, the average property tax rate is 1.083%, lower than the national average but comparable to the rest of California. This applies to both Riverside and Jurupa.
Sales Tax
The sales tax in both Riverside and Jurupa is relatively high, reflecting California's overall high tax rate. At the time of writing, Riverside has a sales tax rate of 8.75%, while Jurupa Valley has a 7.75% sales tax rate.
Income
Type
Riverside
Jurupa
Estimated median household income
$76,558
$80,697
Estimated per capita income
$29,013
$26,950
Cost of living index (U.S. average is 100)
83
86.5
If you make $50,000 in Riverside, you will have to make $52,108 in Jurupa to maintain the same standard of living.
Geographical Conditions
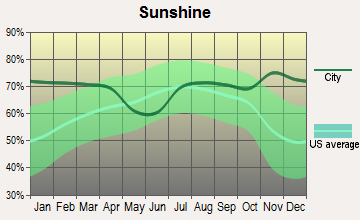
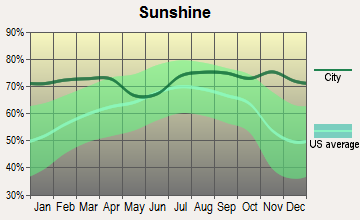
Geographically, Riverside and Jurupa Valley are located in Southern California's Inland Empire area. The terrain is mainly flat to hilly with some scenic mountain views. Both cities enjoy a fair amount of sunshine throughout the year.
Geographical information
Type
Riverside
Jurupa
Land area
78.1 sq. miles
60.8 sq. miles
Population density
4,062.3 people per sq. mile
1,847.2 people per sq. mile
Relative area comparison
Riverside, CA Jurupa, CA
Education
Both Riverside and Jurupa have a wide range of educational opportunities. Riverside is home to several institutions of higher education, including the University of California, Riverside. On the other hand, Jurupa Valley has a strong network of public schools and some charter schools. Both cities value education and provide plenty of resources for students.
The economies of both Riverside and Jurupa are quite diverse. Riverside has a strong economy with job opportunities in education, healthcare, and the public sector. Jurupa, with its more rural setting, presents opportunities in construction, transportation, and warehousing.
Biggest Employers
Some of the largest employers in Riverside include the County of Riverside, Riverside Unified School District, and the University of California, Riverside. In Jurupa, the major employers come from the logistics sector, such as Amazon's fulfillment center and numerous transportation companies.
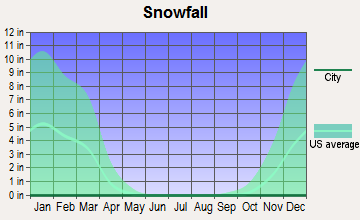
Weather
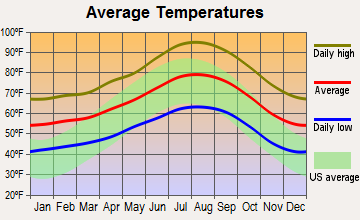
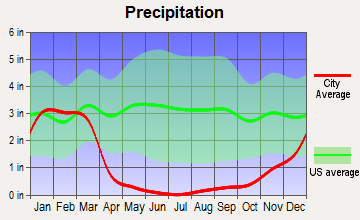
The weather in both Riverside and Jurupa is quite similar due to their geographical proximity. Both cities experience a Mediterranean climate, featuring warm, dry summers, and cool, wet winters. Temperatures in both cities can get pretty high in the summer, sometimes exceeding 100 degrees Fahrenheit.
Weather and climate
Type
Riverside
Jurupa
Temperature - Average
66°F
65.7°F
Humidity - Average morning or afternoon humidity
66.7%
66.8%
Humidity - Differences between morning and afternoon humidity
21.4%
21.6%
Humidity - Maximum monthly morning or afternoon humidity
73.5%
73.7%
Humidity - Minimum monthly morning or afternoon humidity
52.1%
52.1%
Precipitation - Yearly average
10.3 in
13.4 in
Snowfall - Yearly average
0 in
0 in
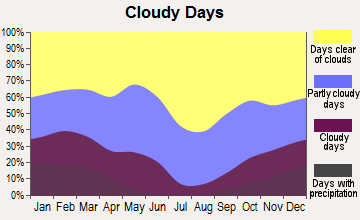
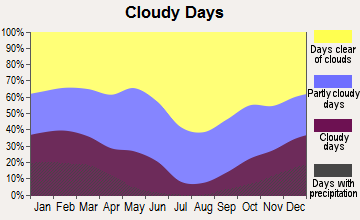
Clouds - Number of days clear of clouds
27.3%
27.4%
Sunshine amount - Average
78.2%
78.3%
Sunshine amount - Differences during a year
21.5%
21.8%
Sunshine amount - Maximum monthly
84.2%
84.6%
Sunshine amount - Minimum monthly
62.6%
62.8%
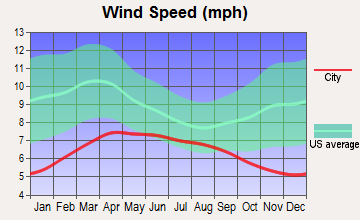
Wind speed - Average
4.5 mph
4.6 mph
Average climate in Riverside, California
Average climate in Jurupa, California
Air pollution
Type
AQI
CO
NO2
OZONE
PB
PM10
PM25
SO2
Year
Riverside
Jurupa
Riverside
Jurupa
Riverside
Jurupa
Riverside
Jurupa
Riverside
Jurupa
Riverside
Jurupa
Riverside
Jurupa
Riverside
Jurupa
2018
153
153
0.35
0.28
14.4
13.7
29.8
29.9
0.006
0.006
44.6
51.8
13.6
15.1
0.4
0.4
2017
151
152
0.34
0.28
14.7
13.3
31.5
30.4
0.004
0.004
48.4
57.2
14.8
15.6
0.3
0.3
2016
140
140
0.33
0.25
14.8
13.7
30.9
30.6
0.006
0.006
44.4
51.8
14.5
16.5
0.2
0.3
2015
147
148
0.33
0.25
14.5
13.5
30.8
29.9
0.004
0.004
43.6
51.3
15.4
18.5
0.3
0.3
2014
147
148
0.37
0.25
15.9
13.9
30.7
30.1
0.006
0.006
34.1
56.9
16.5
18.7
0.3
0.3
2013
147
148
0.38
0.21
16.4
14.0
29.2
28.9
0.006
0.006
33.2
54.8
16.4
18.3
0.2
0.2
2012
148
148
0.35
0.25
16.4
14.5
30.2
29.2
0.007
0.007
32.3
53.0
16.0
20.1
0.3
0.3
2011
150
150
0.37
0.35
16.3
15.1
32.0
30.4
0.006
0.006
33.1
49.6
15.2
22.0
0.3
0.4
2010
144
145
0.42
0.39
17.8
15.4
30.9
29.7
0.008
0.008
31.9
42.6
15.5
20.5
1.3
1.2
2009
151
153
0.37
0.36
20.0
16.7
29.0
27.8
0.009
0.009
38.0
38.4
19.6
18.9
1.5
1.4
2008
157
164
0.41
0.31
20.5
18.2
30.0
29.4
0.010
0.009
43.6
42.7
16.3
18.7
0.9
1.0
2007
135
138
0.65
0.65
20.8
21.5
28.3
28.0
0.011
0.011
N/A
N/A
N/A
N/A
1.6
1.6
2006
129
129
0.58
0.58
21.0
22.2
28.0
27.6
0.005
0.005
N/A
N/A
N/A
N/A
1.4
1.5
2005
134
134
0.53
0.54
22.8
24.1
27.3
27.0
0.012
0.012
N/A
N/A
N/A
N/A
3.3
3.1
2004
142
143
0.72
0.73
18.5
20.0
29.5
29.0
0.013
0.013
N/A
N/A
N/A
N/A
3.1
2.8
2003
144
144
0.75
0.74
22.7
24.2
28.5
27.9
0.013
0.013
N/A
N/A
N/A
N/A
2.0
1.9
2002
142
142
0.82
0.80
24.9
26.5
28.5
27.9
0.015
0.015
N/A
N/A
N/A
N/A
0.2
0.3
2001
145
147
0.79
0.79
25.7
27.4
26.1
25.4
0.025
0.025
N/A
N/A
N/A
N/A
0.9
1.0
2000
157
158
0.82
0.82
24.2
26.3
25.0
24.5
0.031
0.031
N/A
N/A
N/A
N/A
1.2
1.3
Natural disasters
Type
Riverside
Jurupa
Tornado activity compared to U.S. average
17.4%
17.7%
Earthquake activity compared to U.S. average
7,322.6%
7,347.7%
Natural disasters compared to U.S. average
46%
46%
Transportation
Both Riverside and Jurupa are conveniently located near major transportation corridors. Riverside has a more developed public transit system, with bus and Metrolink train services. Jurupa has fewer public transit options but does offer convenient access to several freeways.
Transport
Type
Riverside
Jurupa
Amtrak stations
1
0
Amtrak stations nearby
3
3
FAA registered aircraft
307
0
FAA registered aircraft manufacturers and dealers
15
0
Means of transportation to work
Type
Riverside
Jurupa
Bicycle
0.5%
0.3%
Bus
0.9%
0.8%
Carpooled
9%
20.4%
Car alone
85.7%
72.4%
Motorcycle
0.3%
0.3%
Railroad
0.4%
0.5%
Walked
2.3%
1.1%
Average travel time to work
Type
Riverside
Jurupa
Average
31.3 min
33.3 min
Real Estate
Real estate in Riverside tends to be more expensive than in Jurupa, reflecting the latter's more rural character. However, the housing market in both cities is competitive, especially in highly desirable neighborhoods.
Neighborhoods
Riverside is known for its beautiful historic neighborhoods, while Jurupa Valley is more rural and less densely populated. Both cities have areas offering great views of the surrounding mountains, and both have parks and open spaces.
Houses and residents
Type
Riverside
Jurupa
Houses
94,246
24,828
Average household size (people)
3.2
3.9
Houses occupied
91,110 (96.7%)
23,695 (95.4%)
Houses occupied by owners
51,211 (56.2%)
16,891 (71.3%)
Houses occupied by renters
39,899 (43.8%)
6,804 (28.7%)
Median rent asked for vacant for-rent units
$1,277
$1,354
Median price asked for vacant for-sale houses and condos
$414,585
$464,486
Estimated median house or condo value
$483,300
$459,195
Median number of rooms in apartments
3.9
4.3
Median number of rooms in houses and condos
6.1
6.2
Renting percentage
44.3%
27.7%
Housing density (houses/condos per square mile)
1,206.8
408.7
Household income disparities
40.5%
41.2%
Housing units without a mortgage
393 (1%)
1,818 (12.7%)
Housing units with both a second mortgage and home equity loan
1,312 (3.3%)
8 (0.1%)
Housing units with a mortgage
39,744 (99%)
12,451 (87.3%)
Housing units with a home equity loan
123 (0.3%)
740 (5.2%)
Housing units with a second mortgage
2,112 (5.3%)
2,211 (15.5%)
Housing units lacking complete kitchen facilities
2.5%
1.1%
Housing units lacking complete plumbing facilities
Self-employed workers in own not incorporated business
8,164
2,794
State government workers
8,293
806
Unpaid family workers
199
147
Industries and Occupations
Riverside’s diverse economy supports various industries such as healthcare, education, retail, and government services. Jurupa’s economy is more focused on construction, transportation, and warehousing due to the city's more industrialized zones and areas dedicated to logistics operations.
Health Care
Riverside is better served in regards to health care facilities, with several hospitals and clinics within the city limits. Jurupa may not have its own hospital, but residents have access to healthcare facilities in neighboring cities, including Riverside.
Infrastructure
Riverside, as a larger city, has more developed infrastructure, including well-maintained roads, a public transportation system, and several hospitals. Jurupa, although not as populated or built-up, still has essential infrastructure in place, including schools, municipal buildings, and a public transportation system.
Infrastructure
Type
Riverside
Jurupa
TV stations
5
8
Schools
School facilities
Type
Riverside
Jurupa
Private elementary/middle schools
10
0
Private high schools
8
0
Public elementary/middle schools
54
20
Public high schools
24
7
Colleges/Universities
10
0
Culture and Food
Riverside boasts a vibrant cultural scene featuring numerous festivals, a lively arts community, and a variety of dining options. Jurupa, on the other hand, has a more laid-back cultural scene with traditional American and Mexican cuisine largely represented.
Sports Teams
Neither Riverside nor Jurupa has its own major professional sports teams. However, both cities are within driving distance of Los Angeles, home to teams like the Dodgers (MLB), Lakers (NBA), and Rams (NFL).
 Riverside, CA
 Jurupa, CA